INCA vs. Metran vs. 13CFlux2: A 2024 Guide to Choosing the Best 13C-MFA Software for Biomedical Research
This comprehensive guide provides researchers, scientists, and drug development professionals with a detailed comparison of the three leading software platforms for 13C Metabolic Flux Analysis (13C-MFA): INCA, Metran, and 13CFlux2.
INCA vs. Metran vs. 13CFlux2: A 2024 Guide to Choosing the Best 13C-MFA Software for Biomedical Research
Abstract
This comprehensive guide provides researchers, scientists, and drug development professionals with a detailed comparison of the three leading software platforms for 13C Metabolic Flux Analysis (13C-MFA): INCA, Metran, and 13CFlux2. We explore their core principles, operational methodologies, and ideal use cases. The article offers practical advice on troubleshooting common issues, optimizing workflows, and validating results. By evaluating each tool's strengths in user interface, computational engine, data integration, and scalability, this guide empowers you to select the optimal software to accelerate your metabolic research, from foundational biochemistry to applied therapeutic development.
Understanding the Core: Foundational Principles of INCA, Metran, and 13CFlux2 for 13C-MFA
What is 13C-MFA? A Brief Refresher on Tracking Metabolic Pathways with Isotopes
¹³C Metabolic Flux Analysis (13C-MFA) is a systems biology technique used to quantify the in vivo rates (fluxes) of metabolic reactions in a biological network. It works by feeding cells or organisms a defined substrate labeled with a stable carbon-13 (¹³C) isotope at specific atomic positions. The subsequent distribution of ¹³C atoms through metabolic pathways is measured in intracellular metabolites, and computational models are used to infer the metabolic flux map that best explains the observed labeling patterns.
Frequently Asked Questions & Troubleshooting Guide
Q1: In my INCA model, the simulation fails with "Non-stationary metabolite detected." What does this mean and how do I fix it? A: This error indicates that the labeling pattern of one or more metabolites is not at isotopic steady state, which is a core assumption for standard 13C-MFA. To troubleshoot:
- Check Experimental Design: Ensure your cells were cultured for a sufficient number of doublings (typically 4-5) on the labeled substrate to reach isotopic steady state.
- Verify Harvesting: Confirm metabolism was rapidly quenched at harvest.
- Review Model: In INCA, check that the metabolite pool in question is correctly defined as "free" or "EMU" and that its network connections are accurate. You may need to extend the culturing time or re-examine the pathway structure.
Q2: When comparing flux results between 13CFLUX2 and Metran, I get different confidence intervals for the same dataset. Why? A: Discrepancies often arise from differences in the statistical approaches and algorithms used for confidence interval estimation.
- 13CFLUX2 typically uses a parameter continuation method or Monte Carlo sampling.
- Metran employs a Bayesian approach for statistical analysis.
- Action: This is expected. Consistently use one software's methodology for a given project. When publishing, clearly state which software and statistical method was used.
Q3: My GC-MS fragment data shows low enrichment, leading to poor flux resolution in 13CFLUX2. What are the main causes? A: Low enrichment reduces the information content for flux estimation.
- Substrate Purity: Verify the isotopic purity of your ¹³C-labeled input substrate (e.g., [1-¹³C]glucose). Use an unlabeled control.
- Dilution Effects: High intracellular metabolite pools or rich media components can dilute the label. Switch to a minimal or defined medium if possible.
- Measurement Error: Re-check your derivatization and GC-MS calibration. Ensure you are quantifying the correct mass isotopomer distributions (MIDs).
Q4: How do I choose between INST-MFA (used with INCA) and steady-state MFA (used with 13CFLUX2/Metran) for my drug response study? A: The choice depends on your biological question and experimental feasibility.
| Feature | Steady-State 13C-MFA | INST-MFA |
|---|---|---|
| Software | 13CFLUX2, Metran, INCA | INCA |
| Core Requirement | Isotopic Steady State | Isotopic Non-Stationary (Time-course) |
| Experiment Duration | Long (4-5 cell doublings) | Short (Seconds to Hours) |
| Key Output | Net fluxes through pathways | Fluxes and metabolite pool sizes |
| Best For | Homeostatic metabolism, long-term adaptation | Rapid metabolic transients, drug perturbation kinetics |
Protocol: Steady-State 13C-MFA Experiment with [1-¹³C]Glucose
- Cell Culture: Cultivate cells in a validated, minimal medium.
- Labeling: Replace glucose with >99% pure [1-¹³C]glucose at the same concentration. Passage cells 4-5 times in the labeled medium.
- Quenching & Extraction: Rapidly quench metabolism (e.g., cold methanol/water). Perform metabolite extraction (chloroform/methanol/water).
- Derivatization: For GC-MS, derivative polar metabolites (e.g., amino acids, organic acids) using MTBSTFA or methoxyamine/TBDMS.
- MS Measurement: Acquire mass isotopomer distribution (MID) data via GC-MS or LC-MS.
- Flux Estimation: Input MIDs, substrate labeling, and a genome-scale metabolic model into software (e.g., INCA, 13CFLUX2) to compute the flux map.
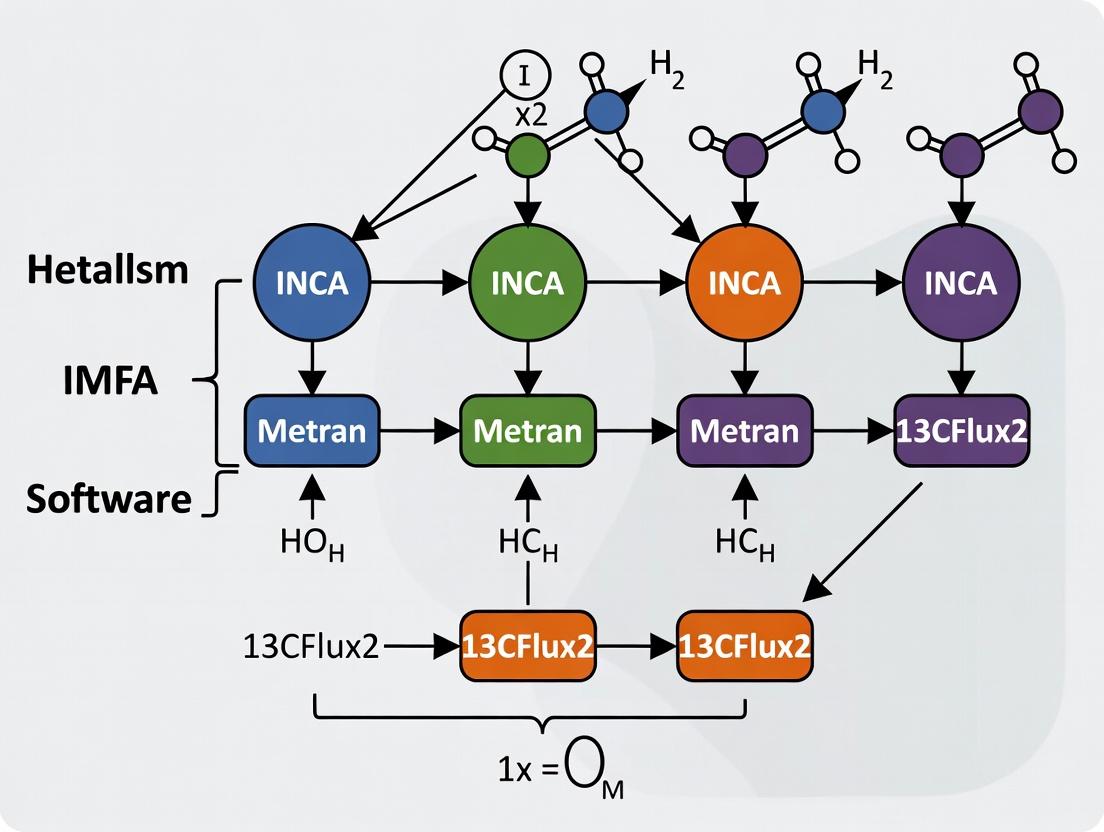
Metabolic Network Modeling Workflow
Title: 13C-MFA Experimental and Computational Workflow
The Scientist's Toolkit: Key Research Reagent Solutions
| Item | Function in 13C-MFA |
|---|---|
| ¹³C-Labeled Substrate (e.g., [1-¹³C]Glucose, [U-¹³C]Glutamine) | The tracer that introduces measurable labels into metabolism. Purity is critical. |
| Chemically Defined/Minimal Medium | Eliminates unlabeled carbon sources that dilute the isotopic label, improving resolution. |
| Quenching Solution (e.g., -40°C Methanol/Water) | Instantly halts metabolic activity to capture in vivo labeling states. |
| Metabolite Extraction Solvent (e.g., Chloroform, Methanol) | Efficiently extracts intracellular polar and non-polar metabolites for analysis. |
| Derivatization Reagent (e.g., MTBSTFA, Methoxyamine) | For GC-MS: Volatilizes and stabilizes metabolites for accurate MID measurement. |
| Internal Standards (¹³C or ²H-labeled) | Corrects for instrument variability and quantifies absolute metabolite concentrations (INST-MFA). |
Core Software Comparison for Thesis Research
| Software | Primary Use | Key Strength | Statistical Framework | Best Suited For |
|---|---|---|---|---|
| INCA | Steady-State & INST-MFA | Gold standard for INST-MFA; intuitive GUI for model creation. | Least-squares regression; Monte Carlo for confidence intervals. | Dynamic labeling studies, complex mammalian cell models. |
| 13CFLUX2 | Steady-State MFA | High-performance, command-line driven; excellent for large networks. | Least-squares with flexible parameter continuation/confidence interval estimation. | Microbial systems, high-throughput flux screening, advanced users. |
| Metran | Steady-State MFA | Integrated Bayesian statistical analysis and comprehensive result visualization. | Bayesian Markov Chain Monte Carlo (MCMC) for posterior flux distributions. | Probabilistic flux analysis, rigorous uncertainty quantification. |
Title: Key Metabolic Pathways Traced by [1-13C]Glucose
Technical Support Center
Frequently Asked Questions (FAQs) & Troubleshooting Guides
Q1: I have imported my GC-MS data, but INCA is reporting "Labeling Pattern Error" or "Mass Isotopomer Distribution Sum ≠ 1". What should I check? A: This is a common data preprocessing issue. Follow this protocol:
- Correct for Natural Isotope Abundance: Ensure you have correctly applied natural abundance correction to your raw mass spectrometry data using the instrument's software or a validated script before importing into INCA.
- Verify Data Format: Confirm your input file matches INCA's required format precisely. The sum of Mass Isotopomer Distributions (MIDs) for each fragment should be 1.0 (or 100%). Re-normalize your MIDs.
- Check for Contaminants: Review your chromatograms for co-eluting peaks that may skew the integration.
Q2: My model fails to converge, or the solver returns "No feasible solution found." What are the typical causes? A: This often stems from model definition or data mismatch.
- Protocol - Parameter Initialization:
- Use the
INCAscripting commandfit.init()with multiple random starting points. - Manually provide initial flux estimates from literature or a simpler model.
- Relax bounds on exchange fluxes (e.g., substrate uptake) to ensure the network can accommodate your data.
- Use the
- Check Network Stoichiometry: Use the model debugger to ensure all reactions are mass and redox balanced. A single typo can make the network infeasible.
- Data vs. Model Consistency: Ensure the measured MIDs correspond to the correct metabolite fragments defined in your network atom transition map.
Q3: How do I properly set up a parallel labeling experiment (e.g., [1,2-13C]glucose + [U-13C]glutamine) in INCA? A: INCA's core strength is its ability to model multiple experiments simultaneously.
- Experimental Protocol:
- Design your experiments with complementary labeling substrates to decouple parallel pathways.
- Culture cells under each condition to steady-state isotopic equilibrium.
- Quench, extract, and derive metabolites for GC- or LC-MS analysis separately for each tracer input.
- INCA Software Setup:
- In the
Datatab, create separate "Experiments" for each tracer condition. - For each experiment, define the specific
Tracercomposition (e.g., 100% [1,2-13C]Glucose). - Input the corresponding MIDs measured from that specific experiment.
- The flux estimation will then jointly fit a single flux map to all datasets, greatly improving identifiability.
- In the
Q4: What is the difference between "EMU" and "Isotopomer" model frameworks in INCA, and which should I use? A: This relates to INCA's core computational philosophy.
| Feature | Isotopomer Framework (Original) | EMU Framework (Decomposition) |
|---|---|---|
| Basis | Tracks complete isotopic labeling state of a metabolite. | Tracks subsets of atom groups (Essential Metabolite Units). |
| Computational Scale | Can be large for big molecules. | Dramatically reduces model size and simulation time. |
| When to Use | Smaller networks, or when full isotopomer constraints are needed. | Recommended for most systems, especially large metabolic networks. |
| INCA Implementation | Select "Isotopomer" in model settings. | Select "EMU" in model settings (default for newer versions). |
Q5: How can I export publication-quality flux maps and results from INCA for comparison with 13CFlux2 or Metran outputs? A:
- Flux Values: Use
File -> Export -> Fluxesto save the estimated net and exchange fluxes (in mmol/gDW/h) to a.csvfile. - Flux Map Visualization:
- Use the
Plottab to generate a network map with flux widths. - For custom diagrams, export flux values and use standalone tools (e.g., Escher, Cytoscape) for uniform styling across software comparisons in your thesis.
- Use the
- Statistical Output: Export the variance-covariance matrix and confidence intervals (from Monte Carlo or sensitivity analysis) to compare flux resolution with other platforms.
Q6: I need to model intracellular compartmentation (e.g., mitochondrial vs. cytosolic metabolites). What is the best practice in INCA? A: INCA's name highlights its strength in compartmental analysis.
- Network Definition Protocol: Define distinct metabolite pools for each compartment (e.g.,
AKG_mandAKG_c). - Define Transport Reactions: Explicitly add transport reactions (e.g.,
AKG_c <-> AKG_m) with their own flux variables. - Measurement Assignment: This is critical. In the
Datatab, you must assign each measured MID to its putative compartment of origin based on your analytical method. Misassignment here is a major source of error. - Use Compartment-Specific Tracers: If available, data from compartment-specific reporters (e.g., mitochondrial-targeted sensors) provides the strongest constraints.
The Scientist's Toolkit: Key Research Reagent Solutions for 13C-MFA
| Item | Function in 13C-MFA |
|---|---|
| 13C-Labeled Substrates (e.g., [U-13C]Glucose, [1,2-13C]Glucose, [U-13C]Glutamine) | Tracers that introduce a non-natural isotopic pattern into metabolism, enabling flux inference. Different labeling patterns probe different pathways. |
| Siliconized Microtubes & Vials | Prevent loss of metabolites due to adsorption to tube walls during quenching, extraction, and derivatization. |
| Derivatization Reagents (e.g., MSTFA for GC-MS, Chloroformates for GC-MS/MS) | Chemically modify polar metabolites (e.g., amino acids, organic acids) to increase volatility, stability, and ionization for mass spectrometry. |
| Internal Standards (e.g., 13C or 2H-labeled cell extract, amino acid mix) | Added at quenching/extraction to correct for sample loss during processing and instrument variability. |
| QC Reference Mixture (Unlabeled metabolite standard mix) | Run regularly to monitor instrument performance (retention time, sensitivity, peak shape) over long analytical batches. |
Experimental & Conceptual Visualizations
Title: 13C-MFA Workflow with INCA Core Stages
Title: Software Comparison: Data Integration Philosophy
Title: EMU vs. Full Isotopomer Modeling
Technical Support Center
Troubleshooting Guides & FAQs
Q1: After installing the Metran package in MATLAB, I receive the error: "Undefined function or variable 'metran'." What should I do?
A: This typically indicates that the Metran toolbox path is not correctly added to the MATLAB search path. Navigate to the folder where Metran is installed. In the MATLAB Command Window, execute: addpath(genpath('/full/path/to/metran/folder')). Save the path for future sessions using the savepath command. Ensure you have the required MATLAB toolboxes (Statistics and Machine Learning, Optimization).
Q2: Metran fails during the parameter estimation phase with "Integration tolerance not met" errors. How can I resolve this? A: This is often due to poorly scaled model parameters or incorrect initial conditions.
- Check that your substrate enrichment input (
INPUT) matrix is correctly defined and scaled (e.g., 0-1 for fractional enrichment). - Review your initial metabolite pool size estimates (
X) and flux parameter (V) initial guesses. Use values from prior steady-state 13C-MFA or literature. - Adjust the solver tolerances in the
optionsstructure (e.g.,options.reltolandoptions.abstol) to be less stringent (e.g., from 1e-10 to 1e-6) for initial fitting attempts. - Simplify the model by fixing well-known exchange fluxes before attempting full kinetic parameter estimation.
Q3: The confidence intervals reported by Metran for my estimated fluxes are extremely wide. What does this imply? A: Wide confidence intervals indicate that the experimental data provides insufficient information to precisely identify the parameter(s). This is a state of practical non-identifiability.
- Action: Increase the frequency of sampling points during the isotopic transient, especially during the initial rapid labeling phase. Consider introducing multiple, complementary tracer pulses (e.g., [1,2-13C] and [U-13C] glucose) to enrich the measurement dataset.
Q4: How do I format my time-course labeling data correctly for input into Metran?
A: Metran requires specific structures. The labeling data (data) should be a cell array where each cell corresponds to a measured metabolite. Each cell contains a matrix with rows as time points and columns as mass isotopomer (MID) fractions. The order of columns must match the idv variable defining the isotopomer states in your model. Use the prepdat function to align your raw GC-MS or LC-MS/MID data with the model. Always validate by simulating your initial guess and comparing the output to your data plot.
Q5: When comparing Metran results to a steady-state analysis from INCA, the estimated net fluxes (Vnet) in the central carbon pathway are discrepant. Which should I trust? A: This is an expected scenario highlighting the different capabilities of the tools. Steady-state 13C-MFA (INCA, 13CFlux2) provides a flux map averaged over the growth condition. Metran's kinetic flux profiling captures the in vivo enzymatic rates and metabolic dynamics at the time of the pulse experiment, which can differ from the long-term average due to regulation, metabolite pooling, or transient effects. The "correct" flux depends on your biological question. Use steady-state MFA for metabolic phenotype comparison and Metran to investigate immediate enzymatic responses to perturbations.
Key Experimental Protocol: Instationary 13C Flux Analysis with Metran
Objective: To determine in vivo kinetic metabolic fluxes in a culture of mammalian cells using a rapid 13C tracer pulse.
Materials & Workflow:
- Cell Culture: Grow cells in standard medium to mid-exponential phase.
- Perturbation & Quenching: At t=-10 minutes, apply a biological perturbation (e.g., drug treatment) if required. At t=0, rapidly switch the extracellular medium to an identical, pre-warmed medium where the primary carbon source (e.g., Glucose) is replaced by its 99% [U-13C] labeled equivalent.
- Sampling: At defined time points post-pulse (e.g., 0, 15, 30, 60, 120, 300, 600 seconds), quickly extract metabolites using a cold methanol:water quenching solution.
- Metabolite Processing: Derivatize polar metabolites (e.g., for GC-MS analysis of proteinogenic amino acids or for LC-MS analysis of central carbon intermediates).
- Mass Spectrometry: Acquire mass isotopomer distributions (MIDs) for target metabolites.
- Data Analysis with Metran:
- Model Definition: Code the metabolic network, including pool sizes and reversible reactions.
- Data Preparation: Format MIDs and input tracer enrichment into
dataandINPUTstructures. - Parameter Estimation: Use
metranfunction to fit kinetic parameters (fluxesV, pool sizesX) to the time-course MID data. - Statistical Analysis: Calculate confidence intervals via
mcmcorprofile_likelihoodfunctions.
Research Reagent Solutions
| Item | Function in Kinetic 13C-MFA |
|---|---|
| [U-13C] Glucose (99% atom purity) | The tracer substrate used in the pulse experiment to introduce a detectable label into the metabolic network. |
| Cold Methanol/Water Quench Solution (40:60 v/v, -40°C) | Instantly halts cellular metabolism to "snapshot" the isotopic labeling state at a precise moment. |
| N-Methyl-N-(tert-butyldimethylsilyl)trifluoroacetamide (MTBSTFA) | Derivatization agent for GC-MS analysis; increases volatility and provides clear fragmentation patterns for amino acids. |
| Ion-Pairing Reagents (e.g., tributylamine) | Used in LC-MS mobile phases for the separation of polar, co-eluting metabolites like glycolytic and TCA cycle intermediates. |
| Internal Standards (13C/15N labeled cell extract or synthetic mixes) | Added during extraction to correct for analytical variation and matrix effects in MS quantification. |
Table: Feature Comparison of 13C Metabolic Flux Analysis Platforms
| Feature | INCA | 13CFlux2 | Metran |
|---|---|---|---|
| Primary Analysis Type | Steady-State MFA | Steady-State MFA | Instationary (Kinetic) MFA |
| Core Method | Elementary Metabolite Units (EMUs), Isotopomer Balancing | Isotopomer Network Compartmental Analysis (INCA) | Dynamic Isotopomer Balancing, ODE Integration |
| Data Input | Isotopic Steady-State Labeling (MIDs), Extracellular Rates | Isotopic Steady-State Labeling (MIDs), Extracellular Rates | Time-Course Labeling (MIDs), Pool Size Estimates |
| Estimated Parameters | Net Fluxes (Vnet) | Net Fluxes (Vnet), Exchange Fluxes (Vex) | In vivo Enzymatic Rates (V), Metabolite Pool Sizes (X) |
| Temporal Resolution | Average over many generations | Average over many generations | Seconds to minutes post-perturbation |
| Software Environment | MATLAB | Standalone Java Application | MATLAB Toolbox |
| Key Output | Flux map, Confidence Intervals | Flux map, Flux Variability | Kinetic flux profiles, Pool sizes, Parameter identifiability |
Visualization
Diagram 1: Instationary 13C-MFA Experimental Workflow
Diagram 2: Metran's Core Modeling Logic
Troubleshooting & FAQ Center
Q1: My 13CFlux2 simulation fails with a "Solver Error: Integration Failure." What are the most common causes? A: This typically indicates an issue with the model definition or experimental data compatibility.
- Check 1: Verify that all input tracer percentages (e.g., [1-13C] glucose) in your experimental setup file sum to 100% for each substrate.
- Check 2: Ensure the network stoichiometry is mass-balanced. A common pitfall is an incorrect exchange reaction formulation between intracellular and extracellular compartments.
- Check 3: Review initial flux estimates. Extremely high or low values can cause solver instability. Use the
flux_initialparameter to provide reasonable starting points.
Q2: How do I handle missing or incomplete Mass Isotopomer Distribution (MID) data for certain metabolites in my dataset? A: 13CFlux2 can handle incomplete data. You must explicitly define which measurements are available.
- In your measurement input file, use
NaNfor unmeasured isotopomers. - Configure the
measurement_weightmatrix to assign zero weight (0) to missing data points, preventing them from influencing the residual. - Ensure the measured metabolites are sufficient for observability of your target fluxes; use the network redundancy analysis tool (
check_observability.py) provided in the utilities.
Q3: What is the recommended workflow to compare flux results from 13CFlux2 with a prior result from INCA? A: Perform a comparative validation using a simulated dataset.
- Generate Ground Truth: Use INCA's simulation feature to create noise-free MIDs from a defined flux map.
- Add Noise: Artificially add Gaussian noise (typical SD: 0.2-0.5 mol%) to the simulated MIDs to mimic real data.
- Parallel Estimation: Feed the identical dataset (network stoichiometry, inputs, noisy MIDs) into both 13CFlux2 and INCA.
- Compare Outputs: Evaluate differences in estimated flux values, confidence intervals, and solver objective values. Key metrics are shown in Table 1.
Table 1: Comparative Metrics for 13CFlux2 vs. INCA Validation
| Metric | 13CFlux2 Result | INCA Result | Interpretation |
|---|---|---|---|
| Sum of Squared Residuals (SSR) | Calculated Value | Calculated Value | Lower SSR indicates better fit to the same data. |
| Key Flux v1 (mmol/gDW/h) | Value ± 95% CI | Value ± 95% CI | Overlapping confidence intervals suggest agreement. |
| Key Flux v2 (mmol/gDW/h) | Value ± 95% CI | Value ± 95% CI | Non-overlapping CIs may indicate different model constraints. |
| Solver Runtime (s) | Time | Time | 13CFlux2 (MATLAB) often faster for large networks. |
| Covariance Matrix Condition | Number | Number | Assesses parameter identifiability; high values (>1e9) warn of ill-posed problems. |
Q4: When should I use the "nonstationary" (instationary) framework in 13CFlux2 versus the standard "stationary" approach? A: The choice is dictated by your labeling experiment time course.
- Use Stationary (Steady-State): When cell metabolism and labeling are at isotopic steady state. This requires long labeling times (typically >4-5 times the longest metabolite turnover time). It simplifies computation greatly.
- Use Nonstationary: When analyzing time-series labeling data before steady state is reached. This is essential for slow-turnover pools (e.g., lipids, proteins) or short-term perturbation studies. It requires differential equation solving and precise measurement of time points and pool sizes.
Experimental Protocol: Comparative Benchmarking of 13CFlux2 vs. Metran
Objective: To assess the accuracy and computational performance of 13CFlux2 relative to the Bayesian software Metran using a simulated mammalian cell culture model.
Materials & Methods:
- Network Definition: A core central carbon metabolism network (Glycolysis, PPP, TCA, Anaplerosis) is codified in a common format (SBML).
- Ground Truth Flux Map: A physiologically realistic flux distribution is defined as the reference (
v_ref). - Data Simulation:
- 13CFlux2: Use
simulate_measurements.mwithv_ref, network, and [1,2-13C] glucose tracer specification to generate error-free MIDs. - Metran: Convert the same
v_refand network into Metran's model file. Use its internal simulator with identical tracer specifications.
- 13CFlux2: Use
- Noise Introduction: Add random, normally distributed measurement error (coefficient of variation = 2%) to all simulated MID fractions.
- Flux Estimation:
- 13CFlux2: Run the nonlinear least-squares estimator (
fit_flux.m) with default settings, providing initial fluxes perturbed fromv_ref. - Metran: Execute Markov Chain Monte Carlo (MCMC) sampling (10,000 iterations, 3 chains) to obtain posterior flux distributions.
- 13CFlux2: Run the nonlinear least-squares estimator (
- Analysis: Compare the estimated flux (
v_est) from each tool tov_ref. Calculate root-mean-square error (RMSE) and assess 95% credibility/confidence interval coverage.
The Scientist's Toolkit: Key Research Reagent Solutions
| Item | Function in 13C MFA |
|---|---|
| [U-13C] Glucose | Uniformly labeled tracer; essential for probing comprehensive network activity, including reversibility. |
| [1-13C] Glutamine | Key tracer for analyzing TCA cycle anaplerosis, cataplerosis, and glutamate/glutamine metabolism. |
| Cell Culture Media (Isotope-Free) | Custom, chemically defined media required to control exact concentrations and labeling states of carbon sources. |
| Quenching Solution (Cold < -40°C Methanol) | Rapidly halts metabolism to preserve in vivo metabolite labeling patterns for intracellular MID analysis. |
| Derivatization Agent (e.g., MTBSTFA) | For GC-MS analysis; modifies polar metabolites (e.g., organic acids, amino acids) to volatile compounds. |
| Internal Standard Mix (13C-labeled) | Added post-quench for absolute quantification and correction for sample loss during extraction. |
Visualizations
Title: 13C MFA Software Comparison Workflow
Title: Core Network for Tracer Data Simulation
Troubleshooting Guides and FAQs
Q: INCA fails to converge or produce a feasible solution. What are the common causes? A: This is often due to:
- Incorrect stoichiometric matrix definitions. Verify all reactions and atom transitions.
- Poorly defined measurement standard deviations. Ensure your input error model is realistic.
- Local minima traps. Try using different initial flux estimates or the multi-start optimization feature.
Q: In Metran, what does a high "goodness-of-fit" p-value indicate for my kinetic model? A: A p-value > 0.05 suggests the model fit is statistically not distinguishable from the perfect fit, which is desirable. However, an excessively high p-value coupled with large parameter confidence intervals may indicate an over-parameterized model (too many degrees of freedom).
Q: 13CFlux2 returns a high chi-square value. How should I proceed? A: A high chi-square indicates a poor fit between simulated and measured isotopic labeling data (MDV). Steps:
- Check Data Quality: Verify the accuracy of your measured Mass Isotopomer Distributions (MDVs) and the input substrate labeling purity.
- Check Network Consistency: Ensure the metabolic network is complete for your organism and conditions. A missing or incorrect reaction is a common culprit.
- Review Flux Constraints: Re-evaluate the applied flux constraints (bounds); some may be biologically unrealistic.
Q: How do I handle compartmentalization in INCA for eukaryotic cells? A: You must explicitly define compartments (e.g., cytosol, mitochondria) and their respective reactions. Key steps:
- Define unique pools for metabolites in each compartment (e.g.,
Ala_c,Ala_m). - Specify transport reactions between these pools.
- Assign atom transitions carefully for reactions in each compartment.
Q: What is the primary difference in data input requirements between these tools? A: See the table below for a quantitative summary.
Data Comparison Table
| Feature | INCA (Compartmental) | Metran (Kinetic) | 13CFlux2 (Steady-State) |
|---|---|---|---|
| Core Method | Compartmental, isotopically non-stationary MFA (INST-MFA) | Dynamic kinetic modeling of isotopic tracers | Steady-state ¹³C Metabolic Flux Analysis (MFA) |
| Typical Experiment Duration | Seconds to Minutes (< 1 generation time) | Minutes to Hours (multiple time points) | Hours to Days (> 5 generation times) |
| Key Data Input | Time-course Mass Isotopomer Data (MDVs) | Time-course concentration & MDV data | Steady-state MDV data only |
| Primary Output | Flux maps, pool sizes | Kinetic rates (Vmax, Km), metabolic fluxes | Net and exchange fluxes at metabolic steady-state |
| Complexity of Setup | High | Very High | Moderate |
| Computational Demand | High | Very High | Moderate |
Experimental Protocols
Protocol 1: INST-MFA Experiment for INCA
- Culture: Grow cells to mid-exponential phase in batch or chemostat.
- Perturbation: Rapidly switch feed medium to an identical one containing a ¹³C-labeled substrate (e.g., [U-¹³C] glucose).
- Quenching: At precise time intervals (e.g., 5, 15, 30, 60 sec), rapidly quench metabolism (using cold methanol/saline).
- Extraction: Perform metabolite extraction for target intracellular pools (e.g., amino acids, TCA intermediates).
- Analysis: Derivatize and measure via GC-MS or LC-MS to obtain time-series MDVs.
- Modeling: Input network, MDV data, time points, and pool size estimates into INCA.
Protocol 2: Steady-State MFA for 13CFlux2
- Culture: Establish cells in a metabolic steady-state (continuous culture or prolonged exponential batch).
- Labeling: Feed a chosen ¹³C-labeled substrate (e.g., [1-¹³C] glucose) for >5 generations.
- Harvest: Quench and harvest cells once isotopic steady-state is confirmed (constant MDVs).
- Hydrolysis & Measurement: Hydrolyze protein biomass to obtain amino acids. Measure their MDVs via GC-MS.
- Flux Estimation: Input network stoichiometry, measured MDVs, and flux constraints into 13CFlux2 for flux estimation.
Visualization
Title: INCA INST-MFA Experimental and Computational Workflow
Title: Decision Logic for Selecting 13C MFA Software
The Scientist's Toolkit: Essential Research Reagents & Materials
| Item | Function in 13C MFA Experiments |
|---|---|
| ¹³C-Labeled Substrates (e.g., [U-¹³C] Glucose, [1-¹³C] Glutamine) | The isotopic tracer that enables tracking of metabolic pathways. Purity (>99% ¹³C) is critical. |
| Cold Quenching Solution (e.g., 60% Methanol, -40°C) | Rapidly halts cellular metabolism to capture metabolic state at exact time point. |
| Internal Standards (IS) for MS (e.g., ¹³C/¹⁵N-labeled cell extract) | Allows for quantitative correction for sample loss during extraction and analysis. |
| Derivatization Reagents (e.g., MTBSTFA for GC-MS, Chloroformates for LC-MS) | Chemically modifies metabolites to be volatile (GC-MS) or improve ionization (LC-MS). |
| Silanized Glassware / Microvials | Prevents adsorption of metabolites to surfaces during sample processing, improving recovery. |
| Anion/Cation Exchange Resin Columns | Used for clean-up of metabolite extracts to remove salts and impurities before MS analysis. |
Frequently Asked Questions (FAQs)
Q1: What are the minimum computational hardware requirements for running INCA, Metran, and 13CFlux2? A1: INCA is a MATLAB-based application and has the most straightforward hardware needs, focusing on CPU speed for large models. Metran and 13CFlux2, which involve Bayesian Markov Chain Monte Carlo (MCMC) sampling, are computationally intensive and benefit significantly from multi-core CPUs, high RAM, and fast storage (SSDs). 13CFlux2's Julia backend can leverage multiple cores efficiently.
Q2: My Metran MCMC analysis is taking an extremely long time or failing to converge. What could be the issue? A2: This is often related to model configuration or data quality.
- Check Priors: Inappropriate prior distributions for parameters can slow sampling.
- Thin Chains: Increase the thinning interval to reduce autocorrelation.
- Scale Your Data: Ensure measured fluxes and metabolite concentrations are properly scaled to avoid numerical instability.
- Diagnostic Plots: Always examine trace plots and Gelman-Rubin diagnostics (potential scale reduction factor) to assess convergence. Non-convergence may indicate a poorly identifiable model structure.
Q3: I'm getting "model is not identifiable" errors in INCA. How do I proceed? A3: This means the software cannot find a unique solution for all model parameters from your data.
- Simplify the Model: Reduce the number of free fluxes or apply additional constraints based on biological knowledge.
- Add Measurements: Incorporate additional extracellular rate measurements or mass isotopomer distributions (MIDs) of key metabolites.
- Use the Flux Spanning Tree: In INCA, use this tool to diagnose which fluxes are identifiable and which are not.
Q4: What is the specific format required for inputting isotopic labeling data (MIDs or EMUs) into 13CFlux2? A4: 13CFlux2 requires data in a specific JSON format. You must prepare two main files:
- A model file defining the metabolic network, atoms, and measurements.
- A data file containing the actual measured MIDs. The most common issue is a mismatch in the metabolite or fragment names between these two files. Use the provided template scripts and validation functions in the 13CFlux2 package to check your input.
Q5: How do I choose between using INST-MFA (as in INCA) and dynamic 13C-MFA (as in Metran) for my experiment? A5: The choice is dictated by your experimental design and biological question.
- Use INCA (INST-MFA) when you have reached an isotopic steady state (typically after 24-48+ hours of labeling). It provides a snapshot of fluxes at that steady-state condition.
- Use Metran (Dynamic 13C-MFA) when you have time-series labeling data (multiple time points before reaching steady state). This is essential for capturing flux dynamics in transient biological states.
Technical Specifications & Prerequisites
Table 1: Platform-Specific Prerequisites Overview
| Prerequisite | INCA | Metran | 13CFlux2 |
|---|---|---|---|
| Core Software | MATLAB (Proprietary) | MATLAB, Statistics Toolbox | Python & Julia (Open Source) |
| Licensing | Commercial (Academic available) | Free for academic use | Open Source (MIT License) |
| Primary Data Type | Isotopic Steady-State MIDs | Time-Series MIDs & Extracellular Rates | Isotopic Steady-State or Time-Series MIDs |
| Key Method | Elementary Metabolite Units (EMU), INST-MFA | Bayesian MCMC, Dynamic MFA | Flux Balance Analysis (FBA) Integration, EMU |
| Minimum RAM | 8 GB (16+ GB for large models) | 16 GB (32+ GB recommended) | 8 GB (16+ GB for large models) |
| CPU Emphasis | Single-core speed | Multi-core performance (MCMC) | Multi-core performance (Julia) |
| Essential Skill | MATLAB scripting, Metabolic Biochemistry | Bayesian Statistics, MATLAB Debugging | Python/Julia Scripting, Command Line |
Table 2: Research Reagent & Data Solutions Toolkit
| Item | Function | Critical for Platform |
|---|---|---|
| U-¹³C Glucose (or other carbon source) | Uniformly labeled tracer to initiate isotopic labeling and trace metabolic pathways. | INCA, Metran, 13CFlux2 |
| Quenching Solution (e.g., cold methanol) | Rapidly halts metabolism to capture intracellular metabolic state at exact time point. | Metran (time-series) |
| Derivatization Agent (e.g., MTBSTFA) | Chemically modifies polar metabolites for robust detection via Gas Chromatography (GC). | INCA, Metran, 13CFlux2 |
| Internal Standard (e.g., ¹³C-sorbitol) | Added during extraction to correct for sample loss and variability in sample processing. | INCA, Metran, 13CFlux2 |
| Extracellular Rate Data (Secretion/Uptake) | Measured rates of nutrient consumption and product formation. Critical for flux constraints. | INCA, Metran, 13CFlux2 |
| GC-MS or LC-MS System | Instrumentation to separate metabolites and measure mass isotopomer distributions (MIDs). | INCA, Metran, 13CFlux2 |
Experimental Protocol: Core INST-MFA Workflow
Title: Sample Preparation for INST-MFA Methodology:
- Cell Culture & Labeling: Grow cells in biological replicates in unlabeled media. At mid-exponential phase, rapidly replace media with an identical medium containing the U-¹³C tracer (e.g., glucose). Maintain culture conditions.
- Quenching & Harvesting: At isotopic steady-state (e.g., 24-48h), rapidly quench metabolism by transferring culture to cold (-40°C) methanol. Centrifuge to pellet cells.
- Metabolite Extraction: Use a cold methanol/water/chloroform extraction. Vortex and centrifuge. Collect the polar (aqueous) phase containing central carbon metabolites.
- Derivatization: Dry the polar extract under nitrogen. Add methoxyamine hydrochloride (in pyridine) to protect carbonyl groups, followed by an silylating agent (e.g., MTBSTFA).
- GC-MS Analysis: Inject derivatized sample. Use a standard non-polar GC column (e.g., DB-5MS). Acquire data in scan mode to obtain full mass spectra for MID analysis.
- Data Processing: Integrate chromatogram peaks. Correct MIDs for natural isotope abundance using software (e.g., INCA's "MID correction" tool). Export corrected MIDs and extracellular rates for model fitting.
Visualization Diagrams
Title: Core 13C-MFA Experimental & Computational Workflow
Title: Software Selection Logic for 13C-MFA
From Data to Model: A Step-by-Step Methodological Guide for Each Software Platform
Technical Support Center & FAQs
FAQ 1: During data processing, my mass isotopomer distribution (MID) data shows unexpected negative values or values >1. What is the cause and solution?
- Cause: This is often due to improper natural isotope correction or background subtraction in the raw chromatogram integration. It can also stem from inconsistent peak integration across samples or low signal-to-noise ratio.
- Solution:
- Re-inspect Chromatograms: Manually verify peak integration boundaries and baseline selection for all fragments in all samples. Ensure consistency.
- Review Correction Parameters: In your data processing software (e.g., Maven, Xcalibur), verify the isotopic purity of your labeled substrate (e.g., [1-13C]glucose) and the natural isotope correction algorithm.
- Check for Contamination: Ensure sample processing did not introduce unlabeled carbon sources.
- Protocol: For MID calculation, use the formula: MID_i = (Abundance of Isotopologue i) / (Sum of Abundances of all Isotopologues for that fragment), applied after natural isotope correction.
FAQ 2: When setting up my experiment in INCA, the software reports "Stoichiometric Inconsistency" in my network model. How do I debug this?
- Cause: The reaction network is not elementally balanced (for carbon and/or other elements) or contains dead-end metabolites. This violates mass conservation, which is fundamental to MFA.
- Solution:
- Check Carbon Transitions: For each reaction in your model, meticulously verify that the 13C labeling pattern (atom transitions) defined in INCA matches the biochemical reaction. A single misplaced carbon atom mapping will cause this error.
- Balance All Metabolites: Ensure every metabolite in the network is both produced and consumed. Use the network diagnostics tool in INCA/Metran to identify unbalanced or orphan metabolites.
- Protocol: Create a minimal working model with 2-3 reactions first. Gradually add pathways, checking for consistency at each step. Compare atom mappings against databases like MetaCyc.
FAQ 3: My flux fitting in 13CFlux2 or Metran fails to converge or yields unrealistic flux values with large confidence intervals. What steps should I take?
- Cause: This indicates poor identifiability. Common reasons include insufficient labeling data, an overly complex model for the available data, incorrect measurement standard deviations, or local minima in the optimization landscape.
- Solution:
- Simplify the Model: Reduce network complexity by pooling parallel pathways or removing fluxes that cannot be resolved by your dataset.
- Review Input Data: Ensure the MIDs and flux measurements (e.g., uptake/secretion rates) have appropriate, realistic standard deviations assigned. Incorrect weights severely impact fitting.
- Sensitivity Analysis: Use the software's identifiability analysis (e.g., Monte Carlo in Metran, Parameter Sensitivity in 13CFlux2) to determine which fluxes are poorly constrained and need additional measurement data.
- Protocol: Perform a simulation study: generate synthetic MIDs from a known flux map, add realistic noise, and attempt to re-estimate fluxes. This validates your model's capability before using real data.
FAQ 4: How do I compare flux results between INCA, Metran, and 13CFlux2 when they use different algorithms?
- Cause: INCA uses elementary metabolite unit (EMU) framework and non-linear least squares, Metran uses a decoupled two-step approach with statistical evaluation, and 13CFlux2 employs a computational efficient least squares framework. Differences are expected.
- Solution:
- Standardize Inputs: Use the exact same network stoichiometry, atom mappings, and input data (MIDs, rates) across all three software tools.
- Compare Confidence Intervals: Do not just compare point estimates. Statistically significant fluxes should have confidence intervals that do not overlap zero. Compare the relative widths of intervals.
- Use a Benchmark Network: Test all software on a well-characterized, simple network (e.g., central metabolism of E. coli) with a simulated dataset where the "true" fluxes are known.
- Protocol for Thesis Comparison: Apply all three software packages to the same public 13C-MFA dataset (e.g., from a published S. cerevisiae study). Quantitatively compare flux results, computation time, ease of use, and convergence reliability.
Table 1: Common Software-Specific Issues and Resolutions
| Software | Common Error | Likely Cause | Primary Troubleshooting Step |
|---|---|---|---|
| INCA | "Matrix is singular" during simulation. | Network contains linearly dependent equations or unmetabolizable cycles. | Run "Network Debug" and check for zero-sum futile cycles. |
| Metran | High χ² value after fitting. | Model structure mismatch with biology or underestimated measurement errors. | Use Metran's residual analysis to pinpoint which MID data points contribute most to χ². |
| 13CFlux2 | "ILL-conditioned system" warning. | Poorly designed experiment leading to low sensitivity of MIDs to certain fluxes. | Use the built-in experimental design suite to predict flux resolution before wet-lab work. |
Table 2: Essential Quality Control Metrics for LC-MS/GC-MS Data in 13C-MFA
| Metric | Target Range | Purpose | Tool for Check |
|---|---|---|---|
| Signal Intensity | > 10^4 counts for base peak. | Ensure sufficient signal-to-noise for accurate isotopologue detection. | Raw chromatogram inspector. |
| MID Sum | 1.00 ± 0.02 (after correction). | Validate proper natural isotope and background correction. | Processed data table. |
| Retention Time Drift | < 0.1 min across runs. | Ensure consistent peak identification and integration. | Alignment view in processing software. |
Experimental Protocols
Protocol 1: LC-MS Sample Preparation for Intracellular Metabolite MIDs
- Quenching: Rapidly transfer culture (1-2 mL) into 5-10 mL of -20°C 60% methanol/water (or appropriate quenching solution for your cell type) with vigorous mixing.
- Extraction: Pellet cells. Resuspend in -20°C 80% methanol/water. Vortex 30 sec, freeze in liquid N2, thaw on ice. Repeat freeze-thaw 3x.
- Centrifugation: Spin at 16,000 x g, 4°C for 15 min. Transfer supernatant to a new tube.
- Drying: Evaporate solvent under a gentle stream of N2 or in a vacuum concentrator.
- Derivatization (if needed for LC-MS): For some platforms, derivatize (e.g., with methoxyamine and MSTFA for GC-MS, or with TBDMS for certain LC-MS methods).
- Reconstitution: Redissolve dried extract in appropriate mobile phase for LC-MS analysis (e.g., water/acetonitrile).
- Analysis: Inject onto HILIC or reverse-phase LC column coupled to high-resolution mass spectrometer.
Protocol 2: Building and Validating a Model for INCA/Metran/13CFlux2
- Define Stoichiometric Matrix: List all reactions and metabolites in a balanced biochemical network. Use a spreadsheet.
- Define Atom Transitions: For each reaction, map the transfer of individual carbon atoms from substrates to products. This is the most critical step.
- Input into Software: Import the matrix and atom mappings into your chosen software. Designate measured fluxes (extracellular rates) and measured MIDs.
- Simulation Test: Provide dummy MIDs and flux data. Run a simulation to ensure the model executes without errors.
- Flux Fitting: Input your actual experimental data with associated standard deviations.
- Statistical Evaluation: Examine goodness-of-fit (χ²), flux confidence intervals (via sensitivity analysis or Monte Carlo), and residual analysis.
Visualization
Title: 13C MFA Data Processing and Fitting Workflow
Title: 13C MFA Software Comparison Framework
The Scientist's Toolkit: Key Research Reagent Solutions
Table 3: Essential Materials for 13C Metabolic Flux Analysis Experiments
| Item | Function in 13C-MFA | Example/Notes |
|---|---|---|
| 13C-Labeled Substrate | The tracer that introduces the measurable isotopic pattern into metabolism. | [U-13C]glucose, [1-13C]glutamine. Purity should be >99% atom percent 13C. |
| Quenching Solution | Instantly halts metabolic activity to capture a snapshot of intracellular metabolite labeling. | Cold (-40°C to -20°C) 60% aqueous methanol. Composition is organism-dependent. |
| Extraction Solvent | Efficiently liberates intracellular metabolites from quenched cell pellets. | Cold 80% methanol/water, or chloroform/methanol/water mixtures. |
| Derivatization Reagents | Chemically modify metabolites for analysis by GC-MS or improve detection by LC-MS. | For GC-MS: Methoxyamine hydrochloride (MeOX) and N-Methyl-N-(trimethylsilyl)trifluoroacetamide (MSTFA). For LC-MS: Aniline, TBDMS. |
| HILIC Chromatography Column | Separates polar, hydrophilic metabolites (most central carbon metabolites) for LC-MS analysis. | SeQuant ZIC-pHILIC (Merck) or Acquity BEH Amide (Waters) columns. |
| Mass Spectrometry Standard | Ensures instrument calibration and can aid in quantifying absolute abundances. | A mix of known unlabeled metabolites covering a range of masses and retention times. |
| Software License | Performs the core computational work of simulation, fitting, and statistical analysis. | INCA (Princeton), Metran (UCSD), 13CFlux2 (INRAE). |
Troubleshooting & FAQs
Q1: I get an error when loading my network model in INCA. What are the most common causes?
A: This is often due to inconsistencies in the model definition.
- Cause 1: Atom transitions are defined for a reaction, but that reaction is not listed in the stoichiometric matrix (S-matrix). Solution: Cross-check every reaction with atom transitions against your S-matrix list.
- Cause 2: An atom in a metabolite is mapped more than once in a reaction, or not mapped at all. Solution: Use the "Check Atom Transitions" tool in the GUI. Ensure every carbon atom in every reactant has exactly one destination in the products (for conservation) or is lost to an undefined pool (e.g., CO2).
- Cause 3: The metabolite name or compartment label in the atom transition file does not exactly match the name in the S-matrix. Solution: Ensure spelling and compartment suffixes (e.g.,
_c,_m) are identical.
Q2: My INCA model runs, but the fitting is poor or fails to converge. How do I proceed?
A: This typically points to issues with model-data mismatch or parameter identifiability.
| Potential Cause | Diagnostic Step | Corrective Action |
|---|---|---|
| Incorrect Mass Isotopomer Distribution (MID) Data Format | Verify your input file matches INCA's expected column format (fractional abundances, summed to ~1 per metabolite). | Re-process raw MS or NMR data, ensuring normalization is correct. |
| Inaccurate Network Atom Transitions | Simulate your model with the "Compute MIDs" function using typical fluxes. Compare simulated vs. experimental MIDs for a simple substrate (e.g., [1-13C]glucose). | Re-visit biochemical literature for reaction mechanisms, particularly for complex transformations (e.g., pentose phosphate pathway transaldolase). |
| Poorly Constrained Fluxes | Check the flux confidence intervals provided in the results. Intervals spanning zero indicate non-identifiability. | Add additional labeling constraints (e.g., parallel labeling experiments) or introduce physiologically relevant constraints (e.g., ATP maintenance). |
| Local Optimum | Run the optimization from multiple different initial flux estimates. | Use the "Multi-start" feature in the Matlab interface (incaOpt options). |
Q3: What is the difference between using the INCA GUI and the Matlab interface, and when should I use each?
A:
- INCA GUI: Best for building, visualizing, and debugging your metabolic network and atom transitions. Its strength is interactive model construction and checking.
- Matlab Interface: Essential for advanced analysis, batch processing, and integration into custom scripts. Use it for complex parameter scans, Monte Carlo analysis for uncertainty, or automating the analysis of multiple experimental conditions.
Common Error: Trying to run a model in Matlab that wasn't saved correctly from the GUI. Solution: Always use Export -> To Matlab in the GUI to create the .m file, then call it via incaLoad in your Matlab script.
Q4: How do I properly define atom transitions for reversible reactions in INCA?
A: INCA requires you to define the atom transition for the forward direction of the reaction as it appears in your S-matrix. If the net flux is reversible, the software will handle the calculation correctly. Do not define two separate reactions (forward and backward) with atom mappings unless they are mechanistically different (e.g., facilitated by different enzymes).
Key Experimental Protocol: 13C-MFA with INCA
Objective: Quantify intracellular metabolic fluxes in mammalian cell culture using [U-13C]glucose tracing and LC-MS data.
1. Labeling Experiment:
- Grow cells in defined medium with [U-13C]glucose (e.g., 100% as the sole carbon source) until isotopic steady-state is reached (typically 24-48 hours for proliferating mammalian cells).
- Quench metabolism rapidly (liquid N2). Extract metabolites (80% methanol/water at -40°C).
- Analyze key metabolites (e.g., glycolytic intermediates, TCA cycle acids, amino acids) via LC-MS to obtain Mass Isotopomer Distributions (MIDs).
2. INCA Model Construction Workflow:
- Define Network: Create stoichiometric matrix of central carbon metabolism (Glycolysis, PPP, TCA, etc.).
- Define Atom Transitions: For each reaction, map carbon atoms from substrates to products using the GUI's atom mapping tool.
- Input Data: Format experimental MIDs and external flux measurements (e.g., glucose uptake, lactate secretion rates) into the required
.txtor.xlstemplate. - Simulation & Fitting: Load model and data. Perform flux estimation via least-squares regression to find best-fit fluxes that simulate MIDs matching experimental data.
- Statistical Analysis: Evaluate fit quality, compute confidence intervals for estimated fluxes.
Diagram Title: INCA 13C-MFA Workflow from Experiment to Flux Map
The Scientist's Toolkit: Essential Research Reagents & Materials
| Item | Function in 13C-MFA |
|---|---|
| [U-13C]Glucose | The most common tracer for central carbon metabolism. Uniform labeling enables tracing through complex, branched networks. |
| Defined, Serum-Free Medium | Eliminates unlabeled carbon sources from serum that would dilute the 13C label and complicate data interpretation. |
| 80% Methanol (-40°C) | Standard quenching and extraction solvent for intracellular metabolites. Rapidly inactivates enzymes to preserve in vivo labeling state. |
| LC-MS System (Q-Exactive, TQ) | High-resolution mass spectrometer required to separate and detect the mass isotopomers of intracellular metabolites. |
| INCA Software | The modeling environment used to translate measured Mass Isotopomer Distributions (MIDs) into quantitative metabolic flux maps. |
| Matlab Runtime | Required to run the INCA optimization engine, even when using the standalone GUI. |
Troubleshooting Guides & FAQs
Q1: I receive the error "Model is overparameterized" when specifying my kinetic model. What does this mean and how can I resolve it? A1: This error indicates that the number of unknown parameters (rate constants, pool sizes) exceeds the information content of your time-course 13C labeling data. To resolve:
- Reduce Parameters: Fix well-known parameters (e.g., from literature) using the
metranFixParamsfunction. - Simplify Model: Combine metabolic pools that are expected to reach isotopic equilibrium rapidly.
- Check Data: Ensure your input labeling data has sufficient time points and replicates.
Q2: After inputting time-course data, Metran fails to converge or produces unrealistic flux estimates. What are the potential causes? A2: Common causes and solutions include:
- Initial Parameter Guess: The optimization is highly sensitive to initial values. Use the
metranInitfunction to systematically test starting points from a defined range. - Data Formatting: Verify your input .csv file follows the exact structure: columns for
Time,Tracer(e.g., [1-13C]Glucose),Metabolite,Isotopologue(M0, M1, etc.), andMeasurement. - Noise Specification: Incorrectly specified measurement errors (Sigma matrix) can bias fits. Re-evaluate your experimental MS error model.
Q3: How do I properly interpret the dynamic flux output plots and confidence intervals from Metran in the context of comparing it to INCA and 13CFlux2? A3: Metran provides instantenous flux values at each measured time point, unlike INCA/13CFlux2 which estimate steady-state net fluxes.
- Output: The primary output is a plot of flux (
v(t)) vs. time. Use theplotFluxfunction. - Confidence Intervals: Metran calculates time-point-specific confidence intervals via Monte Carlo sampling. A wide CI suggests the data cannot constrain the flux at that time.
- Comparison Context: For a valid software comparison thesis, note that Metran's dynamic fluxes (e.g., early metabolic transients) are not directly comparable to the average fluxes from INCA/13CFlux2. Focus the comparison on a known metabolic steady-state period where results should theoretically align.
Key Experimental Protocol: Running a 13C Dynamic MFA Experiment with Metran
1. Specifying the Kinetic Model (ODE System):
Define the metabolic network as a series of ordinary differential equations (ODEs) in a model function file (e.g., my_model.m). The ODEs describe the temporal evolution of isotopologue abundances.
2. Inputting Time-Course Labeling Data:
Prepare data in a structured table Data with required columns (Time, Tracer, Metabolite, Isotopologue, Measurement). Load into MATLAB and convert using metranData.
3. Model Calibration and Simulation:
Use metran function to fit parameters and simulate states.
4. Interpreting Dynamic Fluxes: Extract and visualize the time-dependent fluxes.
Table 1: Key Feature Comparison of 13C MFA Software Packages for Thesis Framework
| Feature | Metran | INCA | 13CFlux2 |
|---|---|---|---|
| Core Method | Kinetic (Dynamic) MFA | Steady-State MFA | Steady-State MFA |
| Data Input | Time-course 13C labeling | Isotopic Steady-State 13C labeling | Isotopic Steady-State 13C labeling |
| Flux Output | Instantaneous fluxes (v(t)) |
Net fluxes (constant) | Net fluxes (constant) |
| Parameter Estimation | Nonlinear ODE fitting | Elementary Metabolite Unit (EMU) nonlin. regression | Least-squares regression |
| Best For | Short-term tracer studies, transients | High-resolution, large networks | User-friendly, high-throughput |
| Thesis Comparison Point | Dynamic response to perturbation | Gold-standard steady-state reference | Alternative steady-state benchmark |
Diagrams
Diagram Title: Metran Experimental Workflow
Diagram Title: Dynamic vs Steady-State Flux Interpretation
The Scientist's Toolkit: Research Reagent Solutions
Table 2: Essential Materials for 13C Dynamic MFA Experiments
| Item | Function in Experiment |
|---|---|
| U-13C or [1-13C] Glucose | Stable isotope tracer for labeling central carbon metabolism (glycolysis, PPP, TCA). |
| Rapid Sampling Setup | Quenching apparatus (e.g., cold methanol) to capture metabolite states at precise time points (sec/min). |
| LC-MS/MS System | For quantifying isotopologue distributions (M0, M1, M+...) of intracellular metabolites. |
| MATLAB Runtime | Metran runs within the MATLAB environment; required for execution. |
| Metran Software Suite | Includes core functions (metran, metranData, plotFlux) for dynamic flux analysis. |
| Custom Metabolic Model .m File | Contains the ODEs defining the kinetic metabolic network for your system. |
Frequently Asked Questions (FAQs) & Troubleshooting
Q1: My 13CFlux2 script returns an error stating "Matrix is singular to working precision" during parameter estimation. What does this mean and how can I resolve it? A1: This error indicates an ill-conditioned parameter estimation problem, often due to poor model identifiability.
- Primary Cause: The set of measured fluxes and labeling data is insufficient to uniquely estimate all model parameters (e.g., free fluxes).
- Troubleshooting Steps:
- Check Input Data: Verify the correctness of your measured extracellular fluxes and Mass Isotopomer Distribution (MID) data.
- Simplify the Model: Reduce the number of estimated free fluxes. Use sensitivity analysis or priori identifiability tools (if available in your version) to identify poorly identifiable parameters.
- Provide Additional Constraints: Incorporate additional literature-based constraints on reaction reversibility or flux bounds.
- Re-initialize: Try a different starting point for the optimization algorithm.
Q2: When running a high-throughput batch analysis, 13CFlux2 stops at a specific model and does not proceed. How do I debug this? A2: This is typically a model-specific error causing the batch script to halt.
- Debug Protocol:
- Isolate the Failing Model: Identify the specific condition or model file causing the stop from your batch script log.
- Run Independently: Execute the problematic model script in standalone mode to see the full error output.
- Common Culprits: Check for network connectivity errors (e.g., a reaction is missing in that condition's model), non-physiological flux bounds, or extreme input data for that condition.
- Implement Error Handling: In your batch script, use
try-catchblocks (in MATLAB) or equivalent logic to log the error for the specific model and continue processing the rest of the batch.
Q3: How can I customize 13CFlux2 to incorporate a non-standard metabolic pathway or atom transition? A3: 13CFlux2's script-based framework allows for this via direct editing of the model network and atom mapping files.
- Methodology:
- Define the Network: Add the new reactions to your model definition script (
model.network), specifying substrates, products, stoichiometry, and reversibility. - Create Atom Mapping: This is the critical step. In the atom mapping file (
model.atomMapping), you must explicitly define the exact atomic transition for each carbon atom in the new reaction(s). Use the existing mappings as a template. Incorrect mapping is the most common source of errors here. - Validate: Run the model parser on the updated scripts to check for syntax and consistency errors before attempting a flux estimation.
- Define the Network: Add the new reactions to your model definition script (
Q4: How does the computational performance of 13CFlux2 compare when handling large-scale (genome-scale) models versus core models? A4: Performance scales non-linearly with model size. The key bottlenecks are the simulation of labeling patterns (EMU model generation) and the non-linear parameter estimation.
Table 1: Comparative Performance Metrics (Estimated)
| Model Scale | Typical # Reactions | EMU Simulation Time* | Parameter Estimation Time* | Memory Usage |
|---|---|---|---|---|
| Core Metabolic (e.g., Central Carbon) | 50-100 | 1-5 minutes | 5-30 minutes | Low-Moderate |
| Genome-Scale (Reduced) | 500-1000 | 30 mins - 2 hrs | Several hours | High |
| Genome-Scale (Full) | >2000 | Hours to Days | Very High (Days) | Very High |
Note: Times are highly dependent on hardware, data points, and number of iterations. For large models, leveraging high-performance computing (HPC) clusters via 13CFlux2's batch mode is strongly recommended.
Detailed Experimental Protocol: High-Throughput 13C-MFA using 13CFlux2
This protocol outlines the steps for a multi-condition flux analysis experiment.
1. Experimental Design & Tracer Input:
- Prepare cell cultures for each experimental condition (e.g., different substrates, genetic perturbations, drug treatments).
- Administer a uniform 13C tracer (e.g., [U-13C]glucose). Ensure metabolic steady-state is reached before sampling.
2. Analytical Data Acquisition:
- Extracellular Fluxes: Measure substrate uptake and metabolite secretion rates (e.g., glucose, lactate, ammonia). Use techniques like HPLC or Cedex Bioanalyzer.
- Mass Spectrometry (MS): Harvest cells, quench metabolism, and extract intracellular metabolites.
- Derivatize if necessary (e.g., for GC-MS).
- Acquire Mass Isotopomer Distribution (MID) data for key proteinogenic amino acids or central metabolites (e.g., alanine, glutamate, serine).
3. Data Preprocessing for 13CFlux2:
- Format extracellular fluxes into a vector.
- Process raw MS spectra to correct for natural abundances and calculate normalized MIDs.
- Compile data into a MATLAB structure or a tab-delimited file as required by your 13CFlux2 script wrapper.
4. Script-Based Modeling & Batch Execution:
- Base Model Script: Create a master model script (
master_model.m) defining the metabolic network, atom mappings, and common parameters. - Condition-Specific Scripts: For each experimental condition, generate a script that loads the base model, inputs the condition-specific extracellular fluxes and MIDs, and sets appropriate flux bounds.
- Batch Loop: Write a controller script that iterates through all condition-specific scripts, calls the 13CFlux2 estimation kernel (
flux_estimation), and saves the results (optimal fluxes, goodness-of-fit statistics) to a structured output file (e.g.,.mator.csv).
5. Results Consolidation & Statistical Analysis:
- Parse all output files to compile a table of estimated net and exchange fluxes for each condition.
- Perform comparative statistical analysis (e.g., confidence interval overlap, Monte Carlo-based significance testing) to identify fluxes that are significantly altered between conditions.
The Scientist's Toolkit: Key Reagents & Materials
Table 2: Essential Reagents for 13C-MFA Experiments
| Item | Function / Purpose | Example Product/Specification |
|---|---|---|
| Uniformly Labeled 13C Tracer | Provides the isotopic label to trace metabolic pathways. | [U-13C6] Glucose, [U-13C5] Glutamine (≥99% atom % 13C) |
| Cell Culture Media (Custom) | Tracer-free, chemically defined base medium for precise control of nutrient composition. | DMEM without glucose, glutamine, or phenol red. |
| Quenching Solution | Instantly halts cellular metabolism to preserve in vivo metabolic state. | Cold (≤ -40°C) 60% aqueous methanol buffered with HEPES or ammonium bicarbonate. |
| Metabolite Extraction Solvent | Efficiently lyses cells and extracts polar intracellular metabolites. | Cold mixture of methanol/acetonitrile/water (e.g., 40:40:20 v/v). |
| Derivatization Reagent (for GC-MS) | Increases volatility and stability of metabolites for gas chromatography. | N-methyl-N-(trimethylsilyl)trifluoroacetamide (MSTFA) with 1% TMCS. |
| Internal Standard for MS | Corrects for sample loss and instrument variability during MS analysis. | Stable isotope-labeled internal standards (e.g., 13C15N-labeled amino acid mix). |
| Quality Control (QC) Pool | Monitors instrument performance and data reproducibility across runs. | A pooled sample from all experimental conditions, injected repeatedly throughout the MS sequence. |
Visualizations
13CFlux2 High-Throughput Workflow
Core Central Carbon Metabolism for 13C-MFA
Troubleshooting Guides and FAQs
This technical support center addresses common challenges when using INCA, Metran, and 13CFlux2 within a 13C Metabolic Flux Analysis (MFA) research framework.
FAQ 1: Which software should I choose for my cell type?
- Q: I work with adherent mammalian cell lines (e.g., CHO, HEK293). Which tool is most suitable, and what are the key setup considerations?
- A: INCA is the preferred tool for mammalian cell culture systems. Its strength lies in modeling complex metabolic networks, including compartmentation (e.g., mitochondrial vs. cytosolic pools), which is critical for eukaryotic cells. A frequent issue is incorrect specification of atom transitions in these compartmented models.
- Troubleshooting: If flux solutions fail to converge or produce unrealistic values, rigorously check your atom transition map for each reaction, especially for metabolites like malate, aspartate, and citrate that traverse compartments. Ensure the atom mapping file (.xlsx or .txt) accurately reflects the isotopic tracer's path.
FAQ 2: How do I handle dynamic labeling data?
- Q: My experiment involves a pulse or chase with a 13C tracer over a time-series. Can I use INCA or 13CFlux2 for this?
- A: For dynamic (non-stationary) 13C labeling experiments, Metran is specifically designed. INCA and 13CFlux2 are primarily for steady-state MFA. The most common error when starting with Metran is using an incorrect input data format for the time-course measurements.
- Troubleshooting: Ensure your measurement data file is structured as a tab-delimited matrix where rows are mass isotopomers (e.g., 'm0', 'm1') and columns are specific time points. Missing time points should be left blank, not filled with zeros. Verify that the time vector defined in the model script matches the columns in your data file.
FAQ 3: Why does my 13CFlux2 simulation fail with a "non-positive definite" error?
- Q: When running 13CFlux2 on a well-established E. coli network, the optimization fails with a covariance matrix error.
- A: This error in 13CFlux2 often points to issues with the input labeling data or its covariance matrix estimation, which is a core feature of the tool.
- Troubleshooting: First, recalculate the measurement covariance matrix from your raw GC-MS or NMR data using the provided scripts. Ensure no measured fragment has zero variance. Second, check for consistency between the list of measurements in your network model file (.xml) and the data input file; a mismatch in order or naming will cause this failure.
FAQ 4: How do I compare flux results between tools?
- Q: I have run a core metabolic model in both INCA and 13CFlux2. The central fluxes are similar, but confidence intervals differ. How should I interpret this?
- A: This is expected due to different statistical frameworks. 13CFlux2 uses an exact statistical framework for confidence interval calculation, while INCA typically employs a sensitivity-based approach or parameter continuation.
- Troubleshooting: For a valid comparison, standardize your approach: use the same metabolic network, identical measurement dataset (converted to each tool's format), and the same optimization settings (e.g., allowed flux ranges). Note that 13CFlux2's confidence intervals are generally considered more rigorous for microbial models.
Experimental Protocols
Protocol 1: Mammalian Cell Culture 13C-MFA using INCA
- Culture & Tracer: Grow HEK293 cells in T-75 flasks to ~70% confluence. Replace medium with identical medium containing [U-13C]glucose (e.g., 10 mM) as the sole carbon source.
- Harvest: At metabolic steady-state (typically 24-48h post-tracer addition), rapidly wash cells with ice-cold saline, quench metabolism with -20°C 60% methanol, and extract intracellular metabolites.
- Measurement: Derivatize proteinogenic amino acids (via hydrolysis) and/or intracellular metabolites. Analyze by GC-MS.
- INCA Workflow: a. Define a compartmented network model (e.g., cytosol, mitochondria). b. Create an atom mapping file for all reactions. c. Input corrected Mass Isotopomer Distributions (MIDs) of measured fragments. d. Perform flux estimation and statistical analysis (flux confidence intervals via parameter continuation).
Protocol 2: Dynamic 13C-Pulse Experiment for Metran
- Culture & Perturbation: Grow S. cerevisiae in a bioreactor under glucose-limited chemostat conditions. At steady-state, rapidly switch the feed to an identical medium containing 100% [1-13C]glucose.
- Sampling: Take rapid, sequential samples from the bioreactor (e.g., at 0, 15, 30, 60, 120, 300, 600 seconds) into cold quenching solution.
- Processing: Centrifuge, extract metabolites, and analyze key intermediates (e.g., Glycolytic, TCA cycle) via LC-MS or GC-MS to obtain time-course MIDs.
- Metran Workflow: a. Construct an ordinary differential equation (ODE) model of the metabolic network and isotopic labeling. b. Format time-series MIDs into a single data matrix. c. Estimate kinetic flux parameters by fitting the ODE model to the dynamic labeling data.
Data Presentation: Software Comparison Table
Table 1: Core Feature Comparison of 13C-MFA Software
| Feature | INCA | Metran | 13CFlux2 |
|---|---|---|---|
| Primary Use Case | Mammalian/Complex Cell Culture | Dynamic 13C-MFA | Microbial & Plant Systems |
| Network Compartmentation | Full Support (e.g., cytosol, mito) | Limited/Model-Dependent | Limited |
| Isotopic State | Steady-State | Non-Steady-State (Dynamic) | Steady-State |
| Statistical Framework | Sensitivity & Monte Carlo | Maximum Likelihood | Exact Statistics |
| Core Algorithm | Elementary Metabolite Units (EMUs) | Isotopomer Networks | Metabolic Flux Ratio / EMU |
| Data Input | MIDs, Extracellular Fluxes | Time-Series MIDs | MIDs, Fluxes |
| Key Strength | Flexible, comprehensive network modeling | Kinetic flux parameter estimation | High precision for core metabolism |
| Typical Output | Net & exchange fluxes, confidence intervals | Time-resolved kinetic fluxes | Flux distributions with rigorous confidence intervals |
Visualizations
Diagram 1: Software Selection Workflow for 13C MFA
Diagram 2: Core 13C-MFA Experimental & Computational Workflow
The Scientist's Toolkit: Research Reagent Solutions
Table 2: Essential Reagents for 13C Tracer Experiments
| Reagent / Material | Function in Experiment | Example / Note |
|---|---|---|
| [U-13C]Glucose | Primary carbon tracer for mapping glycolysis & TCA cycle activity. | >99% isotopic purity; used in INCA and 13CFlux2 protocols. |
| [1-13C]Glucose | Tracer for resolving specific pathway fluxes (e.g., PPP vs. glycolysis). | Critical for dynamic experiments analyzed with Metran. |
| Ice-cold Methanol (60%) | Metabolic quenching agent; rapidly halts enzymatic activity. | Must be pre-chilled to -20°C or lower for effective quenching. |
| Derivatization Reagent | Chemically modifies metabolites for volatilization in GC-MS. | Common: N-methyl-N-(tert-butyldimethylsilyl)trifluoroacetamide (MTBSTFA). |
| Isotopically Silent Media | Culture medium with salts, vitamins, and unlabeled components. | Formulated without carbon sources to allow defined 13C tracer addition. |
| Internal Standard (13C-labeled) | For quantification & correction in MS data. | e.g., 13C-labeled cell extract or specific amino acid mix. |
| Anion Exchange Cartridges | Purify and concentrate anionic metabolites prior to analysis. | Used in sample prep for LC-MS based fluxomics. |
Troubleshooting Guides & FAQs
Q1: I get a "File Format Not Recognized" error when importing spectral data from my NMR instrument into INCA. What should I do? A: This error typically indicates a header mismatch. First, ensure you are exporting from your spectrometer (e.g., Bruker TopSpin, Agilent VNMRJ) in a compatible ASCII or CSV format. For INCA, the file must contain:
- A single column of decimal values (no headers or footers).
- Data corresponding to the spectral vector for integration.
Protocol: Re-export your data using the instrument's "Write ASCII" or "Export to Text" function. Open the file in a basic text editor to confirm it contains only numbers. Use a pre-processing script (provided in INCA's
scripts/folder) to strip any metadata.
Q2: When connecting 13CFlux2 output for further analysis in R/Bioconductor, my isotopologue distribution data appears corrupted. How can I verify the data pipeline? A: This is often due to a mismatch in delimiter or decimal character settings between 13CFlux2 and your downstream script. Troubleshooting Protocol:
- Check the 13CFlux2 export settings. Set "Delimiter" to "Comma" and "Decimal" to "Period".
- Open the exported
.csvin a plain text editor (e.g., Notepad++) to verify format. - In R, use
read.csv("file.csv", check.names=FALSE)and then inspect the first few rows withhead(). Ensure no extra quotation marks are present. Commonly, the issue is that the column headers (metabolite fragment names) contain special characters (+,-, parentheses) that R interprets differently. Renaming columns to use underscores may be necessary.
Q3: Metran fails to read the INCA-generated .mat file, throwing a "Model structure mismatch" error. What steps can resolve this?
A: This indicates that the metabolic model defined in INCA does not perfectly align with the expectations of the Metran library file.
Resolution Workflow:
- Verify Consistency: Ensure the same network stoichiometry and atom transitions are used in both INCA and the Metran model definition file (
network.csv). - Check Compartment Labels: Confirm compartment abbreviations (e.g.,
[c],[m]) are identical in both software. - Export Protocol: From INCA, use the "Export for Metran" function (if available in your version). If not, use the standard MATLAB export and ensure all required variables (
ms,idv,sim) are present. - Load in MATLAB: Before running Metran, load the
.matfile in MATLAB and verify the structure of thems(measurement) field matches the template provided in the Metran documentation.
Q4: Can I directly pipe results from 13CFlux2 into a genome-scale model (GEM) for contextual analysis? What is the standard method? A: Direct piping is not automatic, but a standardized export/import workflow exists. Experimental Protocol:
- In 13CFlux2, after completing the flux estimation, export the net flux table (
v_net) and the confidence intervals. - Convert these fluxes into a format compatible with your GEM software (e.g., COBRA Toolbox, Cameo).
- The key step is mapping: Create a two-column CSV mapping file that links the reaction IDs in your 13C MFA network to the corresponding reaction IDs in the genome-scale model.
- Use a constraint integration script (e.g., in Python with
cobrapy) to set the fluxes from 13CFlux2 as constraints on the GEM, typically as lower and upper bounds with a small tolerance.
Key Data & Comparison Tables
Table 1: Spectral Analysis Software Export Requirements for 13C MFA Tools
| Software | Recommended Export Format | Critical Pre-processing Step | INCA | 13CFlux2 | Metran |
|---|---|---|---|---|---|
| Bruker TopSpin | 1D ASCII (PROCNO > 1) | Remove all header lines | Yes | Via script | No |
| Agilent VNMRJ | CSV (Real + Imaginary) | Separate real data column | Yes | Via script | No |
| MestReNova | CSV (Intensity only) | Ensure baseline correction is applied first | Yes | Yes | No |
| Chenomx NMR Suite | Profile (.xml) | Not directly supported; export peak table | No | Indirectly | No |
Table 2: Downstream Bioinformatics Tool Compatibility
| 13C MFA Software | Primary Export Format | Compatible Downstream Tools | Required Adapter/Plugin |
|---|---|---|---|
| INCA | MATLAB .mat, .csv |
Metran, R, Python (SciPy), COBRA | INCA toMetran.m script |
| 13CFlux2 | .csv, .tsv, .xlsx |
R/Bioconductor, Python/Pandas, Omix | Built-in "Export All" function |
| Metran | .mat, .csv |
MATLAB Stats Toolbox, R (via R.matlab) | None |
Experimental Protocols
Protocol 1: Standardized Workflow for INCA to Metran Integration
- Complete INCA Simulation: Finalize your flux fit in INCA. Under the
Filemenu, selectExport>For External Tools. - Select Variables: In the dialog box, ensure
ms(measurements),idv(isotopomer distributions),sim(simulation info), andmodelare checked. - Run Validation Script: Navigate to the INCA installation directory and run the provided MATLAB script
validateForMetran.mon the exported file. - Load in Metran Environment: Start Metran in MATLAB. Use the command
load('your_exported_file.mat')followed bymetran(ms, idv, sim, model). - Verify: The Metran interface should display your model reactions and data without errors.
Protocol 2: Exporting 13CFlux2 Results for Enrichment Analysis in R
- In 13CFlux2, navigate to the
Resultstab after a successful flux estimation. - Click
File>Export>All Result Tables. This generates a zipped folder. - Unzip the folder. The key file for downstream analysis is
result_flux.csv. - Open RStudio. Use the following code to import and prepare the data:
Visualizations
Title: Data Flow from NMR to Metran via INCA
Title: Integrating 13CFlux2 Results with Genome-Scale Models
The Scientist's Toolkit: Research Reagent Solutions
Table 3: Essential Materials for 13C MFA Integration Workflows
| Item | Function in Integration | Example/Supplier |
|---|---|---|
| U-13C Glucose | Tracer for generating labeling data for INCA/13CFlux2. | Cambridge Isotope Laboratories (CLM-1396) |
| Deuterated Solvent (D2O) | NMR lock signal for stable spectral acquisition. | Sigma-Aldrich (151882) |
| MATLAB Runtime Compiler | Enables running INCA/Metran without a full MATLAB license. | MathWorks Website |
R with tidyverse & R.matlab |
Open-source platform for downstream statistical and bioinformatic analysis. | CRAN Repository |
Python with cobrapy/pandas |
For scripting advanced integration with genome-scale models. | Python Package Index (PyPI) |
| CSV Mapping Template File | Critical file to link reaction IDs between MFA and GEM tools. | Custom-generated |
| Validated NMR Spectral Library | For metabolite identification and peak assignment prior to MFA. | Chenomx, BMRB |
Solving Common Problems: Troubleshooting and Advanced Optimization Strategies for Reliable Fluxes
Troubleshooting Guides & FAQs
General Convergence Failures
Q1: What are the most common causes of convergence failure across INCA, Metran, and 13CFlux2? A1: The primary causes are poor initial parameter estimates, model over-parameterization (too many fluxes for the available labeling data), and inconsistencies in the stoichiometric matrix or carbon atom transitions. Issues with the experimental data quality (e.g., low signal-to-noise in MS measurements) are also frequent culprits.
Q2: My optimization stops at the iteration limit without reaching convergence. What should I do first? A2: First, simplify your model. Fix well-known exchange fluxes at literature values, reduce the number of free parameters, or increase the allowed iteration count. Ensure your initial flux estimates are physiologically plausible. Scaling your parameters so they have similar orders of magnitude can also dramatically improve solver performance.
Software-Specific Issues
Q3: In INCA, the solver frequently fails with "Integration Error" or "Jacobian calculation failed." How do I resolve this?
A3: This often indicates an issue with the carbon mapping (atom transitions) or an unstable system of differential equations. Double-check your atom transition network for errors. Try increasing the relative and absolute integration tolerances in the Integrator Settings. Switching the integrator from CVODE to IDA (for DAE problems) can sometimes help.
Q4: Metran reports "Failure in solving ODE system" during the fitting of INST-13C MFA data. What steps can I take? A4: This is typically related to the numerical integration of isotopomer balances. Verify the correctness of your metabolite pool sizes and labeling input. Start with a coarse time grid for measurements before refining. Using the provided analytical solution for the two-compartment model (where applicable) instead of full ODE integration can bypass this issue.
Q5: 13CFlux2 stops with "Error in flux estimation" or "No significant decrease in objective function." What is the likely problem? A5: This usually points to an ill-conditioned problem. Check the consistency of your network stoichiometry and carbon transitions using the built-in network validation tools. The problem may be underdetermined; consider adding additional flux constraints or using the variance-weighted objective function to better condition the estimation.
Table 1: Common Solver Settings and Default Iteration Limits
| Software | Default Solver | Max Iterations (Default) | Key Tolerance Parameter | Recommended Adjustment for Tough Cases |
|---|---|---|---|---|
| INCA | fmincon (MATLAB) | 1000 | FunctionTolerance (1e-6) | Increase to 3000; relax StepTolerance to 1e-5 |
| Metran | levmar (Levenberg-Marquardt) | 100 | xtol (1e-8) | Increase to 500; adjust model.fit() options |
| 13CFlux2 | IPOPT (Nonlinear) | 3000 | convergence tolerance (1e-8) | Use flux.estimate() with slvr_opts max_iter=5000 |
Table 2: Typical Causes and First-Line Fixes for Convergence Failures
| Failure Symptom | Likely Cause (INCA) | Likely Cause (Metran) | Likely Cause (13CFlux2) | First Action |
|---|---|---|---|---|
| Hessian is singular | Over-parameterized model | N/A | Insufficient data/constraints | Fix more fluxes, add constraints |
| ODE Integration Error | Incorrect atom transitions | Wrong pool size or time grid | N/A | Validate network atom mappings |
| Parameter hits bound | Improper bounds | Incorrect prior distribution | Wrong flux bounds | Review physiological flux bounds |
| Slow progress | Poor initial guesses | Poor initial guesses | Poor scaling | Re-scale parameters/variables |
Experimental Protocols for Diagnosis
Protocol 1: Systematic Model Reduction to Diagnose Over-Parameterization
- Start with a core, well-constrained sub-network of your metabolism (e.g., central carbon metabolism only).
- Fit the model successfully to establish a baseline.
- Iteratively add back the extended pathways or free parameters you suspect.
- Monitor the condition number of the sensitivity matrix (in INCA) or the covariance matrix. A sharp increase upon adding a component indicates it is poorly identifiable with your data.
- Permanently remove or keep fixed any non-identifiable parameters.
Protocol 2: Validating Carbon Atom Transitions (Applicable to INCA & 13CFlux2)
- Export or write out the atom transition network for your model.
- For each reaction, manually trace a carbon atom from the substrate to the product using known biochemistry.
- Use the software's built-in simulation tool: simulate isotopic labeling from a perfectly labeled input (e.g., 100% [1-13C]Glucose) with no fluxes.
- Check if the simulated product labeling pattern matches the expected, purely chemical rearrangement. Any discrepancy indicates an error in the atom mapping.
Protocol 3: Assessing Data Consistency for INST-MFA (Metran-Specific)
- Perform a prior-predictive check: Simulate labeling time-courses using the prior mean values for fluxes and pool sizes.
- Visually compare the simulation to your experimental MS data. Large systematic deviations suggest a fundamental model/data mismatch.
- Fit the model to simulated, noiseless data generated from itself. If it fails to recover the true parameters, the problem is structural (network/identifiability). If it succeeds, the problem lies with the actual experimental data.
Visualization of Diagnostics Workflow
Diagram Title: Convergence Diagnostics Decision Workflow
Diagram Title: Key Failure Points in 13C MFA Fitting Pipeline
The Scientist's Toolkit: Research Reagent Solutions
Table 3: Essential Materials for Robust 13C MFA Experiments
| Item | Function in Experiment | Example/Specification |
|---|---|---|
| U-13C or Position-Specific 13C Tracer | Provides the isotopic label to trace metabolic fluxes. | [1,2-13C]Glucose, [U-13C]Glutamine. Purity > 99% atom 13C. |
| Mass Spectrometry (MS) Standards | For quantification and correction of instrument drift. | 13C-labeled internal standards for each measured metabolite. |
| Quenching Solution | Instantly halts metabolism to capture isotopic steady-state. | Cold (-40°C) 60% methanol/buffer solution. |
| Derivatization Reagent | For GC-MS analysis; volatilizes polar metabolites. | N-Methyl-N-(tert-butyldimethylsilyl) trifluoroacetamide (MTBSTFA). |
| Cell Culture Media (Custom) | Chemically defined, tracer-compatible media without unlabeled carbon sources. | DMEM lacking glucose/glutamine, supplemented with 13C tracer. |
| Isotopic Natural Abundance Correction Tool | Software or library to correct for natural 13C abundance. | Used in INCA, 13CFlux2, or open-source packages like pyIsotopomer. |
| Sensitivity Analysis Software | Identifies which parameters are poorly constrained by data. | Built-in tools in INCA, or MATLAB's nlparci. |
Handling Measurement Uncertainty and Its Impact on Flux Confidence Intervals
Technical Support Center
Troubleshooting Guides & FAQs
Q1: My confidence intervals for fluxes in INCA are extremely wide after incorporating measurement error. Is this normal, and how can I diagnose the issue? A: Yes, this is a common but critical observation. Wide confidence intervals indicate that the flux solution is highly sensitive to the measurement uncertainty you provided. To diagnose:
- Check Your Input SDs: Review the standard deviations (SDs) you entered for your measured labeling patterns (e.g., mass isotopomer distributions, MID). Overly conservative (too large) estimates will directly inflate confidence intervals. Re-consult your instrument precision data.
- Examine Residuals: In INCA, check the weighted residuals between simulated and measured data. A systematic pattern (not random scatter) suggests a model-data mismatch, not just measurement error, causing the solver to struggle, widening intervals.
- Parameter Identifiability: Some fluxes in your network may be poorly identifiable given your data and error structure. Use INCA's parameter selection statistics or perform a sensitivity analysis to pinpoint which fluxes are least constrained.
Q2: When comparing flux results from INCA and 13CFlux2, I see significant differences in the reported confidence intervals for the same dataset. Which one should I trust? A: Discrepancies often arise from fundamental differences in how uncertainty is propagated. Do not assume one is universally more correct. You must understand and report the methodology.
- INCA uses a comprehensive approach, often employing Monte Carlo or non-linear error propagation around the optimal fit, which can capture non-linearities but is computationally intensive.
- 13CFlux2 traditionally uses a linear approximation (e.g., based on the sensitivity matrix at the optimum), which is faster but may underestimate intervals for highly non-linear problems.
Actionable Protocol: Re-run your analysis in INCA using the "linear approximation" setting for error propagation (if available) and compare to 13CFlux2's result. If they align, linearity holds. If not, the non-linear Monte Carlo result from INCA is more reliable. Always state the method used.
Q3: In Metran, how do I properly configure the "measurement noise" matrix for my time-course 13C labeling data? A: Metran requires a covariance matrix (Σ) for measurement noise. Mis-specification is a major source of incorrect confidence intervals.
Detailed Protocol:
- Estimation: For each time point and measured mass isotopomer, calculate the variance (SD²) based on technical replicates. If replicates are few, pool variance estimates across similar measurements or time points.
- Matrix Construction: Create a diagonal matrix where each diagonal element is the variance for a specific measurement at a specific time. Assume no covariance between measurements unless you have evidence of correlated instrument error (often set to zero).
- Formatting: Ensure the order of rows/columns in Σ exactly matches the order of data points in your measurement vector. Refer to Metran's user guide for exact input syntax.
Q4: What is the most robust experimental protocol to quantify measurement uncertainty for GC-MS-derived MIDs for use in any MFA software? A: Follow this replicated standard protocol.
Experimental Protocol: Quantifying GC-MS MID Uncertainty
- Sample Preparation: From a single biological condition, prepare n (n≥5) independent biological samples.
- Derivatization: Derivatize each sample separately but using the same rigorous protocol.
- Instrumental Analysis: Inject each derivatized sample m (m≥3) times in randomized order across your GC-MS run sequence to capture both biological and technical variance.
- Data Calculation: For each fragment of interest, calculate the MID for each injection.
- Variance Decomposition: Perform a simple ANOVA for each isotopologue abundance:
- Total Variance: Variance across all n*m data points.
- Technical Variance: Variance within the m replicates of each biological sample.
- Biological Variance: (Variance between biological sample means) - (Technical Variance/m).
- SD for MFA: The standard deviation input for your MFA software for a single experimental measurement should be the standard deviation derived from the technical variance. The biological variance is what the experiment aims to explain.
Quantitative Data Summary
Table 1: Impact of Measurement SD on Flux Confidence Interval Width (Simulated Example)
| Flux Reaction | True Flux (mmol/gDW/h) | Estimated Flux (SD=0.005) | 95% CI Width (SD=0.005) | Estimated Flux (SD=0.02) | 95% CI Width (SD=0.02) | CI Width Increase |
|---|---|---|---|---|---|---|
| v_PGK | 100.0 | 99.8 | ± 2.1 | 100.1 | ± 8.5 | 405% |
| v_PDH | 50.0 | 49.7 | ± 5.3 | 51.2 | ± 21.4 | 404% |
| v_AKGDH | 30.0 | 30.2 | ± 8.9 | 29.5 | ± 35.2 | 395% |
Table 2: Comparison of Error Propagation Methods in MFA Tools
| Software | Primary Error Propagation Method | Computational Cost | Handles Non-linearity? | Best Use Case |
|---|---|---|---|---|
| INCA | Monte Carlo Sampling | High | Excellent | Final publication analysis, non-linear systems |
| 13CFlux2 | Linear Approximation | Low | Moderate (may underestimate) | Initial exploration, large networks, high-throughput |
| Metran | Kalman Filter Covariance Update | Medium | Good for dynamic systems | Time-course 13C labeling data |
Visualizations
Diagram: From Measurement to Flux Confidence Intervals
Diagram: Protocol for Quantifying MID Uncertainty
The Scientist's Toolkit: Key Research Reagent Solutions
| Item | Function in 13C MFA Uncertainty Analysis |
|---|---|
| U-13C Glucose | The primary tracer used to induce a predictable labeling pattern in central carbon metabolism for flux resolution. |
| Internal Standard (e.g., 13C-Sorbitol) | Added uniformly before extraction for normalization, correcting for instrument drift and sample loss, reducing technical variance. |
| Derivatization Agent (e.g., MSTFA) | Converts polar metabolites (amino acids, organic acids) into volatile derivatives for GC-MS analysis. Consistency here is critical. |
| Isotopically Labeled Authentic Standards | Used to calibrate MS response factors, confirm retention times, and create standard curves for absolute quantification. |
| QC Pool Sample | A large, homogeneous biological sample aliquoted and run repeatedly across sequences to monitor and correct for inter-run variation. |
| Cell Culture Media (Dialyzed FBS) | Essential for ensuring that all nutrient contributions are defined and unlabeled, preventing dilution of the 13C label from unknown sources. |
Technical Support Center: INCA, Metran, and 13CFlux2 Troubleshooting Guides
Frequently Asked Questions (FAQs)
Q1: During network compilation in INCA, I encounter "Error: The system is over-parameterized (N > M)". What does this mean and how do I resolve it? A: This error indicates your model has more unknown parameters (N, e.g., fluxes) than independent measurements (M). To enforce parsimony:
- Reduce free fluxes by applying additional constraints from literature (e.g., irreversible reactions, known flux ratios).
- Simplify the metabolic network model by removing peripheral pathways not relevant to your core hypothesis.
- Increase measurement data (M) by incorporating additional labeling measurements from GC-MS or NMR if available.
Q2: In 13CFlux2, my parameter estimation converges to a local solution with high residuals. How can I improve global optimum identification? A: This is a common issue with complex, non-convex models.
- Use the multi-start optimization feature. Increase the number of starts (e.g., from 100 to 500) in the configuration file.
- Implement parameter bounding. Tighten lower and upper bounds for sensitive fluxes based on prior knowledge to reduce the search space.
- Check the consistency of your input labeling data and measurement standard deviations for potential outliers.
Q3: When comparing goodness-of-fit between Metran and INCA outputs, which statistical metrics are directly comparable? A: Focus on the following key metrics, which are common outputs of both software suites:
Table 1: Comparable Goodness-of-Fit Metrics for 13C MFA Software
| Metric | Description | Interpretation in Model Comparison |
|---|---|---|
| Sum of Squared Residuals (SSR) | Sum of squared differences between measured and simulated data. | Lower SSR indicates a better fit. Compare for models fitted to the same dataset. |
| Reduced Chi-Square (χ²/df) | SSR weighted by measurement variances and degrees of freedom (df). | Value close to 1 indicates a good fit. The most robust metric for parsimony assessment. |
| Akaike Information Criterion (AIC) | Balances model fit (SSR) with complexity (number of parameters, k). | Lower AIC suggests a better, more parsimonious model. Directly penalizes over-parameterization. |
Q4: Metran's Markov Chain Monte Carlo (MCMC) simulation returns very wide confidence intervals for my flux estimates. What is the cause? A: Wide confidence intervals signal low practical identifiability, often due to:
- Insufficient Labeling Data: The tracer experiment does not provide enough information to constrain specific fluxes. Consider using a different tracer (e.g., [1,2-¹³C]glucose vs. [U-¹³C]glucose).
- Model Over-parameterization: The network topology has too many parallel or cyclic pathways. Apply the principle of parsimony: fix or remove fluxes that are not central to your biological question.
- High Measurement Noise: Review your MS fragment data processing for inconsistencies.
Experimental Protocol: Comparative Evaluation of Network Identifiability
Objective: To systematically assess the parsimony and practical identifiability of a core metabolic network (e.g., central carbon metabolism) using INCA, Metran, and 13CFlux2.
Methodology:
- Network Definition: Create an identical core network (e.g., glycolysis, PPP, TCA cycle) in SBML format for all three platforms.
- Synthetic Data Generation: Use INCA's simulation tool with a defined "true" flux map and realistic measurement noise (e.g., 0.5 mol% standard deviation) to generate artificial labeling data ([U-¹³C]glucose tracer).
- Parameter Estimation:
- INCA: Use the default trust-region-reflective algorithm.
- 13CFlux2: Employ the provided parallel hybrid local-global optimization.
- Metran: Run an MCMC simulation (≥ 100,000 iterations) after optimization.
- Identifiability Analysis:
- Calculate the coefficient of variation (CV = standard deviation / mean * 100%) for each estimated flux from the Metran MCMC posterior distribution.
- Extract the confidence intervals from INCA's sensitivity analysis and 13CFlux2's covariance matrix estimation.
- Compare the AIC values for the best-fit model from each software.
Diagram 1: 13C MFA Model Parsimony Workflow
Diagram 2: Key Software Comparison for Identifiability Analysis
The Scientist's Toolkit: Essential Reagents & Materials for 13C MFA
Table 2: Key Research Reagent Solutions for 13C Tracer Experiments
| Item | Function & Specification |
|---|---|
| ¹³C-Labeled Tracer Substrate (e.g., [U-¹³C]Glucose) | The core reagent that introduces the isotopic label into metabolism. Purity > 99% atom ¹³C is critical. |
| Custom Cell Culture Medium (Isotope-Free) | A formulation without natural-abundance carbon sources (e.g., glucose, glutamine) to allow precise control of tracer input. |
| Quenching Solution (e.g., -40°C 60% Methanol) | Rapidly halts all metabolic activity at the precise experimental timepoint to preserve intracellular metabolite labeling states. |
| Derivatization Reagents (e.g., MSTFA for GC-MS) | Chemically modifies polar intracellular metabolites (e.g., amino acids, organic acids) into volatile compounds suitable for gas chromatography. |
| Mass Spectrometry Tuning Calibrant (e.g., Perfluorotributylamine) | Ensures the GC-MS or LC-MS instrument is optimally calibrated for accurate mass-to-charge ratio (m/z) detection and quantification. |
| Isotopic Standard Mix | A known mixture of naturally labeled and fully ¹³C-labeled metabolites for correcting instrument drift and calculating molar fractional enrichments. |
Troubleshooting Guides & FAQs
Q1: My 13C Metabolic Flux Analysis (MFA) in INCA is running extremely slowly with a large-scale metabolic model. What are the first steps to diagnose this?
A1: First, check the model scaling and the integrator settings. Large models with many free fluxes and pool sizes can exponentially increase computation time. In INCA, navigate to Simulation Settings and switch the integrator from the default (often ode15s) to CVODE for stiff problems, which can handle larger systems more efficiently. Enable the Sparse Matrix option if available. Profile your system resources (CPU/RAM usage) during a run using your OS task manager to identify if you are memory-bound (high RAM, low CPU) or CPU-bound.
Q2: When using 13CFlux2 for high-resolution time-series data, I encounter "Out of Memory" errors. How can I manage this? A2: This is typically due to holding the entire dataset and Jacobian matrices in memory. Implement data chunking. Pre-process your LC-MS/MS data to load only the time points and mass isotopomer distributions (MIDs) for a specific interval of the simulation. Utilize 13CFlux2's command-line interface to run simulations in batch mode for sequential intervals, writing intermediate flux results to disk. Ensure your system's virtual memory (page file) is adequately sized and on a fast SSD.
Q3: Metran simulations are crashing without an error message when I increase the number of parallel Monte Carlo runs for confidence interval estimation. What could be wrong?
A3: This is likely a resource exhaustion issue. Metran often runs multiple instances for parallel parameter estimation. Reduce the number of parallel workers. In MATLAB, before running Metran, set the parallel pool size manually: parpool('local', 4) to use 4 cores instead of the default. Check for disk space in the temporary directory Metran uses for inter-process communication. Also, verify that your model is properly constrained; an ill-posed problem can cause singular matrices during the parallel runs.
Q4: How can I speed up the data fitting process when comparing multiple model hypotheses (e.g., different network topologies) in INCA?
A4: Employ a two-stage fitting strategy. First, run a quick, approximate fit for all candidate models using reduced solver tolerances (e.g., FunctionTolerance=1e-3, StepTolerance=1e-3). Then, take only the top-performing models (e.g., those within a certain AIC threshold) and run a full, high-precision fit. Cache or save the initial parameter estimates from your first pass to seed the second, more precise fit, reducing the number of iterations needed.
Q5: I need to process hundreds of 13C-MFA datasets for a drug response study. What is a robust workflow for automation? A5: Develop a script-based pipeline outside the GUI. For INCA, use its MATLAB API. For 13CFlux2, use its Python interface or command-line tools. Structure your pipeline as follows:
- Input Standardization: Convert all raw data (MIDs, uptake/secretion rates) into a consistent
.csvor.jsonformat using a script. - Batch Scripting: Write a master script that loops through your data files, generates the necessary model configuration file for each, and submits the simulation job to the software.
- Results Aggregation: Configure the software to output results to structured files (e.g.,
results_dataset_001.json). Write a second script to parse all result files and compile key metrics (flux values, goodness-of-fit) into a master table.
Table 1: Comparative Performance Metrics for 13C-MFA Software on a Standard Network (Central Metabolism)
| Software | Avg. Single-Fit Time (s)* | RAM Usage (GB)* | Parallelization Support | Large-Scale Model Support (>100 reactions) |
|---|---|---|---|---|
| INCA (v2.x) | 45 - 120 | 1.5 - 4.0 | Yes (MATLAB Parallel Toolbox) | Moderate (Can slow significantly) |
| 13CFlux2 | 10 - 30 | 0.5 - 2.0 | Limited (Job-level batching) | Good (Efficient memory management) |
| Metran | 180 - 600+ | 3.0 - 8.0+ | Yes (Monte Carlo runs) | Challenging (High memory demand) |
*Values are estimates based on a model with ~50 reactions, ~10 free fluxes, and simulated MIDs. Performance heavily depends on model complexity, data points, and hardware.
Table 2: Data Management Strategies for Large-Scale 13C-MFA Studies
| Challenge | Recommended Strategy | Tools / Implementation |
|---|---|---|
| Many Experimental Conditions | Hierarchical data organization (Project/Condition/DataType) | Use a structured directory tree. Tag files with metadata in the filename (e.g., ConditionA_24hr_MID.csv). |
| High-Resolution Time-Course Data | Data down-sampling & intelligent averaging | For fitting, average adjacent time points in stationary phases. Use all points only for final validation. |
| Ensemble Modeling (Many variants) | Results database | Store fit parameters, fluxes, and residuals in an SQLite or HDF5 database for efficient querying and comparison. |
Experimental Protocols
Protocol: Benchmarking Computational Performance for 13C-MFA Software Objective: To systematically compare the computation time and memory footprint of INCA, Metran, and 13CFlux2 on a standardized metabolic model.
- Model & Data: Prepare a consensus core metabolic network (e.g., glycolysis, TCA, pentose phosphate) in the native format for each software. Generate simulated, noise-added MIDs for a mammalian cell culture experiment (e.g., [U-13C]glucose) to ensure identical fitting problems.
- Hardware Standardization: Perform all runs on a dedicated machine with known specifications (e.g., 8-core CPU, 32GB RAM, SSD). Close all non-essential applications.
- Performance Profiling:
- For each software, start a system resource monitor (e.g.,
topon Linux, Task Manager on Windows). - Initiate the flux estimation procedure.
- Record: (a) Total wall-clock time until completion, (b) Peak RAM usage, and (c) Average CPU utilization.
- For each software, start a system resource monitor (e.g.,
- Scalability Test: Repeat step 3 after systematically increasing the model size (e.g., adding detailed lipid biosynthesis pathways) and the number of fitted data points (e.g., more time points or tracer experiments).
- Data Recording: Execute each test configuration 5 times, discard the highest and lowest times, and average the remaining three. Record results in a table format as shown in Table 1.
Protocol: Automated Batch Processing of Drug Perturbation Data with 13CFlux2 Objective: To automate the flux analysis of 50+ datasets generated from a drug dose-response experiment.
- Template Creation: Manually configure and successfully run one representative dataset in 13CFlux2. Export the project configuration file (
config.xmlor similar). - Script Development: Write a Python script that:
- Reads a master spreadsheet (
conditions.csv) listing all datasets, their corresponding data files, and experimental parameters (drug, dose, time). - For each row in the spreadsheet, creates a new directory, copies the template configuration file, and modifies the specific tags within it to point to the correct data file and output path using an XML parser (e.g.,
xml.etree.ElementTree). - Executes the 13Flux2 command-line tool (
13cflux2_cli) for each configured directory, logging the progress and any errors. - Upon completion, parses the output flux vector file from each run and compiles the key net and exchange fluxes into a single summary
results_compiled.csvfile.
- Reads a master spreadsheet (
- Execution & Validation: Run the script on a subset (e.g., 5 conditions) first to verify correctness. Then execute the full batch. Monitor for failed runs and implement a retry logic for those that fail due to transient issues.
Diagrams
Automated 13C-MFA Data Processing Pipeline
Performance Issue Diagnosis Tree
The Scientist's Toolkit: Research Reagent & Computational Solutions
Table 3: Essential Tools for Computational 13C-MFA Research
| Item/Reagent | Function in Computational Performance & Data Management |
|---|---|
| High-Performance Workstation | Local compute node for model development, debugging, and moderate-scale batch processing. Requires multi-core CPU, ample RAM (≥32GB), and fast NVMe SSDs. |
| High-Throughput Computing (HTC) Cluster/SLIURM | For massive parameter sweeps, ensemble modeling, and large-scale Monte Carlo analyses. Enables running hundreds of fitting jobs in parallel. |
| Structured Data Formats (HDF5, SQLite) | For storing large, complex experimental data (MIDs, fluxes) and results in a hierarchical, compressed, and easily queryable manner, superior to flat .csv files. |
| Version Control System (Git) | Tracks changes to metabolic model definitions, analysis scripts, and configuration files, ensuring reproducibility and collaboration. |
| Containerization (Docker/Singularity) | Packages the 13C-MFA software, its dependencies, and custom scripts into a single, portable image that runs consistently on any system (laptop, cluster, cloud). |
| MATLAB Parallel Computing Toolbox | (For INCA/Metran) Allows parallel execution of multiple fits or parameter estimations, leveraging multi-core CPUs to reduce total computation time. |
| Python Scientific Stack (NumPy, SciPy, pandas) | The foundation for custom pre/post-processing scripts, data automation pipelines, and interfacing with 13CFlux2 or other open-source tools. |
Technical Support Center: Troubleshooting Guides and FAQs
Frequently Asked Questions
Q1: I am designing a 13C-labeling experiment for a metabolic flux analysis (MFA) comparison study between INCA, Metran, and 13CFlux2. How do I choose a labeling scheme that is compatible with all three software packages?
A1: A universally compatible starting point is to use a single tracer like [1-13C]glucose or [U-13C]glucose. All three major software packages support these common tracers. For advanced designs, consult the software-specific input specifications. INCA and 13CFlux2 natively support a wide range of isotopic label inputs (e.g., # of label) and positional enrichment (PE) data. Metran often requires data pre-converted into Mass Isotopomer Distributions (MIDs). The table below summarizes key compatibility points.
Q2: My experimental sampling point plan involves frequent, time-course measurements. Which software best handles dynamic flux analysis, and what specific data format is required? A2: For dynamic or INST-MFA, 13CFlux2 is specifically designed for this purpose. INCA also has robust capabilities for instationary (INST) MFA. Metran is primarily intended for stationary MFA. For 13CFlux2, you must provide measured MIDs for each measured time point, substrate input rates, and biomass composition over time. Ensure your sampling protocol captures the early, non-stationary phase of label incorporation.
Q3: After running the same dataset through INCA, Metran, and 13CFlux2, I get different flux results. Is this expected, and how should I troubleshoot? A3: Yes, differences can arise due to algorithmic approaches, underlying network model definitions, and statistical frameworks. Troubleshoot systematically:
- Verify Network Consistency: Ensure the metabolic network model (reactions, stoichiometry, compartmentation) is identical across all software setups.
- Validate Data Format: Confirm that the label input data (e.g., MIDs vs. PE) are correctly translated for each software's requirements.
- Check Initial Estimates: Poor initial flux estimates can lead to convergence on different local minima. Use consistent, physiologically reasonable starting values.
- Review Fit Statistics: Compare the residual sum of squares (RSS) or χ² values. The software with the best fit may provide the most reliable estimate for that model.
Q4: What are the essential reagents and materials I need to prepare for a 13C-MFA experiment aimed at software comparison? A4: Table: Key Research Reagent Solutions for 13C-MFA Experiments
| Item | Function in Experiment |
|---|---|
| 13C-Labeled Substrate (e.g., [U-13C]Glucose) | Tracer for elucidating intracellular metabolic pathways. Purity (>99% 13C) is critical. |
| Custom Culture Media (C, N, P sources) | Chemically defined medium essential for precise metabolic modeling. |
| Quenching Solution (e.g., cold 60% methanol) | Rapidly halts metabolism to capture accurate intracellular metabolite levels. |
| Extraction Solvent (e.g., chloroform/methanol/water) | Extracts intracellular metabolites for subsequent MS analysis. |
| Derivatization Agent (e.g., MTBSTFA for GC-MS) | Chemically modifies polar metabolites for gas chromatography separation. |
| Internal Standards (13C-labeled amino acids, etc.) | Corrects for instrument variability and quantifies absolute concentrations. |
| Quality Control Sample (e.g., defined metabolite mix) | Monitors instrument performance and data reproducibility across runs. |
Experimental Protocols
Protocol 1: Standard Sampling for Stationary 13C-MFA
- Culture: Grow cells in biological triplicates in custom defined medium with natural abundance carbon sources until steady-state growth is achieved.
- Tracer Pulse: Rapidly switch medium to an identical formulation containing the chosen 13C-labeled substrate (e.g., 100% [1-13C]glucose). Maintain constant growth conditions (pH, DO, temperature).
- Harvest: After 3-5 residence times to achieve isotopic steady state, rapidly quench culture samples (1 mL) in -40°C 60% aqueous methanol (4 mL).
- Extraction: Perform a chloroform/methanol/water extraction. Centrifuge. Collect the polar (aqueous) phase for intracellular metabolite analysis.
- Derivatization: Dry polar extracts under nitrogen. Derivatize using 20 µL methoxyamine hydrochloride (20 mg/mL in pyridine) followed by 80 µL MTBSTFA.
- Analysis: Analyze by GC-MS. Acquire data in scan mode to collect full mass spectra for MID determination.
Protocol 2: Time-Course Sampling for INST-MFA
- Steps 1 & 2: As in Protocol 1.
- Rapid Time Points: Starting immediately after tracer pulse (e.g., at 0, 15, 30, 60, 120, 300, 600, 1200 seconds), quench small culture aliquots (0.5 mL) directly into pre-chilled quenching solution.
- Post-Steady State: Continue sampling until isotopic steady state is reached (as in Protocol 1).
- Biomass Monitoring: In parallel, track biomass concentration (OD600, cell count) and substrate/excreted metabolite concentrations over the entire time course for absolute flux estimation.
- Processing: Process all time-point samples as in Steps 4-6 of Protocol 1.
Data Presentation
Table: Comparison of Key Software Features for 13C-MFA
| Feature | INCA | Metran | 13CFlux2 |
|---|---|---|---|
| Primary Analysis Type | Stationary & Instationary MFA | Stationary MFA | Instationary MFA |
| Core Algorithm | Elementary Metabolite Units (EMU) | Global Optimization | EMU & Global Optimization |
| Key Data Input Format | MID, PE, Flux Constraints | MID | MID, PE |
| Statistical Framework | Comprehensive (χ², Monte Carlo) | Local sensitivity | Monte Carlo, Profile Likelihood |
| User Interface | MATLAB-based GUI | Web Interface | Command-line & Scripting |
| Best For | Detailed network modeling, flexibility | Robust parameter estimation | Dynamic flux analysis |
Mandatory Visualizations
Software Comparison Workflow for 13C MFA
Key Labeling from [1-13C]Glucose via PDH
Troubleshooting Guides & FAQs
Q1: INCA fails to converge on a solution during flux fitting. What are the primary causes and solutions? A: Common causes include incorrect specification of measured fragments or labeling patterns, poor initial flux estimates, and ill-conditioned stoichiometric matrices.
- Solution Checklist:
- Verify the
MDVandfragmentdata matrices in your input file for typos or mismatched carbon transitions. - Simplify the model by fixing well-known exchange fluxes or removing non-converging free fluxes as starting points.
- Use the
INCA"Sensitivities" tool to check for parameters with confidence intervals > 1e6, indicating poor identifiability. - Consult the INCA Best Practices guide for regularization techniques.
- Verify the
Q2: In 13CFLUX2, how do I resolve "Net flux calculation error: matrix singular or ill-conditioned"? A: This error indicates the stoichiometric matrix (S) is not of full rank, often due to a duplicated reaction or a missing constraint.
- Protocol for Debugging:
- Run the network topology check:
x = verifyNetworkTopology(net)in the MATLAB command window after loading your project. - Inspect the rank deficiency report to identify linearly dependent reaction vectors.
- Systematically comment out recent model additions to isolate the problematic reaction(s).
- Ensure all external metabolites (substrates, products, biomass) are correctly defined as
'xt'.
- Run the network topology check:
Q3: Metran reports high statistical disagreement (χ² test) between experimental and simulated MID data. What steps should I take? A: A high χ² value suggests the model cannot adequately explain the data. Follow this diagnostic workflow.
- Methodology:
- Visual Inspection: Use Metran's
plot_fitfunction to visually compare simulated vs. experimental MIDs for each metabolite. Identify the specific fragments with poor fits. - Parameter Confidence: Examine the confidence intervals for free fluxes. Intervals spanning zero may indicate non-identifiability.
- Model Pruning: If poor fit is localized, consider if an alternative reaction mechanism (e.g., different pentose phosphate pathway flux split) is needed in that subsystem.
- Data Validation: Re-check the curation of your experimental GC-MS data for natural isotope abundance correction errors.
- Visual Inspection: Use Metran's
Q4: What are the best practices for comparing flux results obtained from INCA, 13CFLUX2, and Metran on the same dataset? A: A direct quantitative comparison requires careful normalization and uncertainty analysis.
- Experimental Protocol for Cross-Platform Comparison:
- Standardized Input: Create a consistent metabolic network model (stoichiometry, atom transitions) for all three software tools.
- Flux Normalization: Express all net fluxes relative to a fixed uptake rate (e.g., glucose uptake = 100).
- Uncertainty Quantification: Record both the central flux estimate and its 95% confidence interval from each software's statistical routine.
- Comparison Table: Create a summary table (see Table 1) highlighting key flux nodes and software-reported values with uncertainties.
Table 1: Example Flux Comparison Across 13C MFA Platforms (Flux ± 95% CI, normalized to Glc Uptake = 100)
| Flux Reaction | INCA | 13CFLUX2 | Metran |
|---|---|---|---|
| Glycolysis (G6P → PYR) | 89.5 ± 4.2 | 91.1 ± 5.0 | 88.7 ± 6.1 |
| Pentose Phosphate Pathway (G6P Dehydrogenase) | 10.5 ± 4.2 | 8.9 ± 5.0 | 11.3 ± 6.1 |
| Anaplerotic Flux (PYR → OAA) | 12.3 ± 1.8 | 11.8 ± 2.1 | 13.0 ± 2.5 |
| TCA Cycle (Citrate Synthase) | 105.2 ± 6.5 | 103.9 ± 7.2 | 107.1 ± 8.0 |
Research Reagent Solutions
| Item | Function in 13C MFA Research |
|---|---|
| [1-13C] Glucose | Tracer substrate; labels specific carbon positions to illuminate pathway activities (e.g., PPP vs. glycolysis). |
| [U-13C] Glutamine | Uniformly labeled tracer; essential for analyzing TCA cycle metabolism and glutaminolysis in cancer cells. |
| Isotopic Internal Standard Mix | A mix of fully labeled 13C compounds added post-cultivation for absolute quantification and recovery correction in LC/GC-MS. |
| Derivatization Agent (e.g., MSTFA, TBDMS) | Modifies polar metabolites (amino acids, organic acids) for volatile, detectable GC-MS analysis. |
| Quenching Solution (Cold Saline/Methanol) | Rapidly halts cellular metabolism at the precise experimental timepoint to capture metabolic state. |
Visualizations
Title: Core 13C MFA Computational Workflow
Title: Central Carbon Pathways in 13C Tracer Studies
Head-to-Head Comparison: Validating Results and Choosing the Right Software for Your Project
| Software Tool | Licensing Cost | User Interface | Learning Curve | Primary Strengths |
|---|---|---|---|---|
| INCA | Commercial; Requires a paid license. Academic discounts may be available. Cost is often per module/user. | Windows-based graphical user interface (GUI). Provides visual workflow construction and data grids. | Moderate. GUI is intuitive, but mastering metabolic model construction and flux calculation requires biochemical expertise. | Industry standard. Robust, comprehensive, and highly validated. Excellent for detailed, high-resolution metabolic network analysis. |
| Metran | Open-source (MATLAB-based). Free to use, but requires a licensed MATLAB installation. | MATLAB command-line driven. Limited GUI; primarily script-based interaction. | Steep. Requires proficiency in MATLAB and command-line operations. Less accessible for non-programmers. | Powerful isotopomer network modeling. Flexibility for custom model development and advanced research scenarios. |
| 13CFLUX2 | Open-source (Python-based). Freely available without commercial licensing fees. | Web-based interface (FLUXviz) and Python API. Offers both GUI and programmatic access. | Moderate to Steep. GUI lowers barrier to entry; Python API offers power for custom analyses but requires coding skills. | Modern, actively developed. Handles large-scale networks efficiently. Strong support for parallel computing and comprehensive statistical analysis. |
Technical Support Center
Troubleshooting Guides & FAQs
Q1: My INCA model simulation fails with "No feasible solution found." What are the primary causes? A: This is typically a model formulation or data issue.
- Check Reaction Balance: Ensure all metabolic reactions in your network are mass- and charge-balanced.
- Verify Input Constraints: Review all input fluxes (e.g., substrate uptake) and exchange flux constraints for contradictions (e.g., imposing both upper and lower bounds that prevent flux).
- Inspect Measured Labeling Data: Confirm the format and units of your experimental MS data (MDV or EMU) match the model expectations. Outliers or incorrect measurements can make the system infeasible.
- Simplify the Model: Temporarily remove non-essential reactions or constraints to isolate the problematic section.
Q2: When running 13CFLUX2 via the web interface, the optimization gets stuck or runs extremely slowly. How can I improve performance? A: Large-scale models require significant computational resources.
- Reduce Parallel Processes: In the
config.ymlfile, decrease themax_workersparameter to avoid overwhelming your CPU/RAM. - Simplify the Network: Consider if all reactions are essential for your hypothesis. Reduce the network scope for a preliminary fit.
- Check Starting Points: Poor initial parameter guesses can lead to long convergence times. Use the
start_fluxes_from_csvoption to provide sensible starting points from a previous, smaller run or literature. - Use the CLI: For very large models, consider using the 13CFLUX2 Python API directly on a high-performance computing (HPC) cluster.
Q3: I receive MATLAB errors about "Undefined function" when trying to run Metran. What's wrong? A: This indicates a path or dependency issue.
- Verify Toolbox Installation: Ensure all required MATLAB toolboxes (e.g., Optimization, Statistics) are installed and licensed.
- Set the Path Correctly: Use the MATLAB
addpathcommand to add the main Metran folder and all its subdirectories to the MATLAB search path. - Check for Legacy Code: Some Metran functions may rely on older MATLAB functions. Consult the documentation for version-specific notes.
Detailed Methodology: Parallel Labeling Experiment & Data Integration
Protocol Title: Steady-State 13C Metabolic Flux Analysis using [1,2-13C]Glucose and U-13C Glutamine.
Objective: To elucidate central carbon metabolism fluxes in cultured mammalian cells, particularly glycolysis, TCA cycle, and glutamine anaplerosis.
Experimental Workflow:
- Cell Culture: Seed cells in biological replicates in standard growth medium. Grow to ~60% confluence.
- Tracer Medium Preparation: Prepare two labeling media:
- Condition A: DMEM base with 10 mM [1,2-13C]Glucose (as sole glucose source) and 4 mM unlabeled Glutamine.
- Condition B: DMEM base with 10 mM unlabeled Glucose and 4 mM [U-13C]Glutamine (as sole glutamine source).
- Labeling Phase: Aspirate standard medium. Wash cells twice with PBS. Add respective tracer media. Incubate for a time sufficient to reach isotopic steady-state (typically 24-48 hours for mammalian cells).
- Metabolite Quenching & Extraction: At harvest, rapidly aspirate medium and quench metabolism with cold 80% methanol (pre-chilled to -80°C). Scrape cells on dry ice. Perform a biphasic chloroform/methanol/water extraction to separate polar and non-polar metabolites.
- Derivatization & Analysis: Dry the polar phase (aqueous layer). Derivatize to form TBDMS or MOX derivatives. Analyze via Gas Chromatography-Mass Spectrometry (GC-MS).
- Data Processing: Integrate chromatograms to obtain mass isotopomer distributions (MIDs) for key metabolites (e.g., alanine, lactate, glutamate, aspartate, succinate).
- Modeling: Input the combined MIDs from both labeling experiments into your chosen software (INCA, 13CFLUX2, Metran) to fit a unified metabolic network model and estimate intracellular flux rates.
Experimental Workflow Diagram
Diagram Title: 13C-MFA Parallel Tracer Experiment Workflow
Research Reagent Solutions
| Item | Function in 13C-MFA |
|---|---|
| [1,2-13C]Glucose | Tracer to elucidate glycolysis and pentose phosphate pathway (PPP) fluxes via labeling patterns in lactate, alanine, and TCA cycle derivatives. |
| [U-13C]Glutamine | Tracer to probe glutaminolysis, TCA cycle anaplerosis, and reductive carboxylation fluxes. Labels glutamate, aspartate, and citrate. |
| Ice-cold 80% Methanol | Quenching agent to rapidly halt cellular metabolism, preserving the in vivo metabolite labeling state for accurate measurement. |
| Chloroform (LC-MS Grade) | Used in the biphasic extraction to separate lipid-soluble metabolites from the aqueous, polar metabolite fraction. |
| N-methyl-N-(tert-butyldimethylsilyl)trifluoroacetamide (MTBSTFA) | Derivatization agent for GC-MS; adds TBDMS groups to polar metabolites, increasing their volatility and stability for analysis. |
| Methoxyamine hydrochloride (MOX reagent) | Often used prior to TBDMS derivatization to protect carbonyl groups, stabilizing sugars and TCA cycle intermediates. |
FAQs & Troubleshooting Guide
Q1: After running the same dataset on INCA, Metran, and 13CFlux2, I get divergent central carbon metabolism flux values. Which result should I trust?
A1: Discrepancies are common due to different mathematical solvers and statistical assumptions. First, verify your input (i.e., labeling pattern data, network model stoichiometry) is identical across platforms. INCA uses the EMU framework and a hybrid optimization approach, while 13CFlux2 employs elementary metabolite units (EMUs) with a different algorithm. Metran uses Bayesian statistics for confidence intervals. Check the fit to experimental data (e.g., residual sum of squares) in each tool. The platform with the best statistical fit (and biologically plausible fluxes) for a validated standard dataset (like E. coli or yeast) is likely configured correctly for your analysis.
Q2: When using 13CFlux2, I encounter "integration failure" or "solver did not converge" errors. How can I resolve this?
A2: These errors often stem from poor initial flux estimates or an ill-posed network. 1) Use the provided standard network models as a template. 2) Run the "parsimonious FBA" step first to generate feasible initial values. 3) Check for carbon-balanced reactions and ensure all metabolites in your model are measurable or have defined constraints. 4) Reduce the complexity of your model by collapsing parallel pathways and rerun.
Q3: In Metran, the Markov Chain Monte Carlo (MCMC) sampling takes an extremely long time and does not complete. What steps can I take?
A3: Extensive run times indicate high parameter dimensionality or poor chain mixing. 1) Reduce variables: Fix well-known exchange fluxes based on uptake/secretion rates. 2) Adjust MCMC settings: Increase the adaptation phase (burn-in), thin the chain more aggressively, and ensure your proposal distributions are scaled appropriately. 3) Use a simpler model: Start with a core metabolism model to validate your data and settings before scaling up. 4) Verify you are using compiled C code (model$genmcmc()) rather than the slower R-based simulator.
Q4: INCA returns fluxes but with unusually large confidence intervals. What does this imply and how can I improve precision?
A4: Large confidence intervals suggest your isotopic labeling data is insufficient to constrain the model. 1) Review your measurement data: Ensure you have high-quality MS or NMR data for a sufficient number of mass isotopomers. Adding additional tracer experiments (e.g., [1,2-¹³C]glucose) can help. 2) Check reaction net fluxes: Some fluxes may be inherently non-identifiable; consider applying additional physiological constraints (e.g., ATP maintenance, growth-associated energy requirements). 3) In INCA, use the parameter identifiability analysis tool (incaParIdent) to pinpoint unconstrained fluxes.
Q5: How do I ensure a fair comparison when benchmarking these software tools on a standard dataset?
A5: Follow this protocol: 1) Standardize Inputs: Use a publicly available standard dataset (e.g., N†zzwicker et al. 2013 *E. coli dataset). Create a consistent, carbon-balanced metabolic network model in SBML or a compatible format. 2) Define Common Constraints: Apply identical upper/lower bounds for all exchange and internal fluxes. 3) Match Statistical Criteria: Use the same convergence tolerance and goodness-of-fit metric (e.g., χ² test). 4) Report Comprehensively: Document solver settings, algorithm choices (e.g., MCMC iterations), and all input files. The comparison is valid only if the underlying problem is the same.
Table 1: Comparison of Core Software Features
| Feature | INCA (v2.x) | Metran (v1.x) | 13CFlux2 (v2.2.x) |
|---|---|---|---|
| Mathematical Framework | Elementary Metabolite Units (EMU) | Kinetic Monte Carlo / Bayesian | Elementary Metabolite Units (EMU) |
| Statistical Approach | Least-Squares / Monte Carlo | Bayesian MCMC | Weighted Least-Squares |
| Primary Output | Flux values with confidence intervals | Probability distributions of fluxes | Flux values with confidence intervals |
| Key Strength | User-friendly GUI, comprehensive analysis | Robust uncertainty quantification | High computational speed, command-line efficiency |
| Standard Dataset Test | E. coli (N†z*zwicker 2013) | S. cerevisiae (Shao 2013) | E. coli (Crown 2015) |
Table 2: Example Flux Results on E. coli Core Model (µmol/gDW/h)
| Flux Reaction | INCA Result (95% CI) | 13CFlux2 Result (95% CI) | Literature Reference Range |
|---|---|---|---|
| Glucose Uptake | 1000 (Fixed) | 1000 (Fixed) | 1000 |
| Pentose Phosphate Pathway | 185 (175-195) | 192 (182-201) | 180-200 |
| Pyruvate Kinase | 610 (590-635) | 595 (570-620) | 600-625 |
| TCA Cycle (Oxidative) | 85 (75-95) | 78 (68-88) | 80-90 |
Experimental Protocol for Benchmarking
Title: Protocol for Comparative 13C-MFA Software Validation
1. Data Preparation:
- Acquire a standard published dataset (e.g., LC-MS/MS mass isotopomer distributions for E. coli grown on [U-¹³C]glucose).
- Construct an SBML-formatted metabolic network model containing all relevant reactions for central carbon metabolism (Glycolysis, PPP, TCA, etc.).
- Define identical constraints for all tools: Set glucose uptake and growth rate as fixed constraints. Define realistic bounds for all other exchange fluxes.
2. Software Execution:
- INCA: Import model and data. Use the default hybrid solver (simplex + Monte Carlo). Run flux estimation with 1000 Monte Carlo iterations to generate confidence intervals.
- 13CFlux2: Convert SBML to 13CFlux2 model format. Execute the parsimonious FVA, then the 13C integration and fitting routine using the command-line interface. Generate confidence intervals via the built-in statistical analysis.
- Metran: Prepare the model in R using the
metranpackage. Specify prior distributions for fluxes. Run MCMC sampling with 1,000,000 steps, a 20% burn-in, and thinning of 500. Check chain convergence (Gelman-Rubin statistic <1.05).
3. Analysis & Comparison:
- Extract net fluxes for key junction points (e.g., G6P branch, PEP node, acetyl-CoA node).
- Compare point estimates and the range of confidence/credible intervals.
- Calculate goodness-of-fit metrics (SSR, χ²) provided by each platform.
- Assess computational time and resource usage.
Visualization
Diagram Title: Benchmarking Workflow for 13C-MFA Software
Diagram Title: Core Carbon Pathways in 13C-MFA
The Scientist's Toolkit: Research Reagent Solutions
Table 3: Essential Materials for 13C-MFA Benchmarking Experiments
| Item | Function in Experiment | Example/Note |
|---|---|---|
| U-¹³C Labeled Substrate | Provides the isotopic tracer for metabolic flux analysis. | [U-¹³C]Glucose (>99% atom purity); essential for generating standard dataset. |
| Defined Chemical Media | Enables precise control of nutrient availability and flux constraints. | M9 minimal media for E. coli; ensures all carbon is from the labeled source. |
| Quenching Solution | Rapidly halts metabolism at the time of sampling. | 60% Methanol/H₂O at -40°C; critical for accurate intracellular metabolite snapshots. |
| LC-MS/MS System | Measures mass isotopomer distributions (MIDs) of intracellular metabolites. | High-resolution mass spectrometer (e.g., Q-Exactive); data source for all software. |
| SBML Model Editor | Creates and edits the standardized metabolic network model. | CellDesigner or online SabioRK; ensures model consistency across platforms. |
| Computational Environment | Runs the resource-intensive flux estimation software. | High-performance workstation (≥16 GB RAM, multi-core CPU) or computing cluster. |
Troubleshooting Guides & FAQs
Q1: INCA is returning a "Poorly Conditioned Matrix" error during flux estimation. What does this mean and how can I resolve it? A: This error indicates an ill-posed optimization problem, often due to insufficient or low-quality isotopic labeling data relative to model complexity.
- Solution: Simplify your network model by removing non-observable or parallel fluxes. Check the stoichiometric matrix for linear dependencies. Ensure your tracer input ([1-13C] vs [U-13C] glucose) is correctly specified. Increase the number of measured mass isotopomer (MIDs) for key metabolites.
Q2: In 13CFlux2, the confidence intervals for central carbon metabolism fluxes are extremely wide. How can I improve precision? A: Wide confidence intervals suggest poor parameter identifiability.
- Solution: (1) Incorporate additional experimental constraints, such as extracellular flux rates (uptake/secretion). (2) Design a parallel labeling experiment with a complementary tracer (e.g., combine [U-13C] glucose with [1,2-13C] acetate). (3) Verify the accuracy of your measured biomass composition, as errors here propagate to flux uncertainty.
Q3: Metran reports a high "Goodness-of-Fit" (χ²) p-value > 0.05, but the simulated MIDs visually deviate from the data. Is the fit acceptable? A: A high p-value suggests the model is statistically consistent with the data, but it may mask systematic errors.
- Cross-Check: Visually inspect residual plots for specific metabolite fragments. A consistent bias in residuals indicates a model deficiency (e.g., missing reaction, incorrect atom transition). Perform a statistical test on the residuals (e.g., Shapiro-Wilk for normality). Consider if the assumed measurement error variance is overestimated.
Q4: When comparing INCA vs. 13CFlux2 results for the same dataset, the absolute flux values differ. Which result is correct? A: Differences can arise from algorithmic and statistical assumptions.
- Diagnostic Steps:
- Verify Input Parity: Ensure identical network stoichiometry, measured fragments, and tracer enrichment are used in both software.
- Check Optimization Settings: Compare the objective function (Weighted Residual Sum of Squares in INCA vs. 13CFlux2's implementation).
- Analyze Uncertainty: Overlap in the 95% confidence intervals from both tools often indicates statistical agreement, even if point estimates differ.
Table 1: Key Statistical Metrics for 13C-MFA Flux Validation
| Metric | Software Implementation | Ideal Value | Indicates |
|---|---|---|---|
| χ² Goodness-of-Fit | INCA, 13CFlux2, Metran | 0.05 < p-value < 0.95 | Model is statistically consistent with data. |
| Parameter Confidence Intervals | INCA (Monte Carlo), 13CFlux2 (Sensitivity-based) | Narrow relative to flux net value | High precision, identifiable flux. |
| Collinearity Index | 13CFlux2, INCA (via diagn.) | < 20 for key fluxes | Flux is uniquely identifiable. |
| Correlation Matrix | All major packages | Off-diagonal elements | Reveals coupled/parallel fluxes. |
| Monte Carlo Residual Analysis | Metran, INCA | Normally distributed, mean ~0 | No systematic measurement bias. |
Table 2: Experimental Cross-Checks for Flux Solution Validation
| Cross-Check Type | Protocol Description | Expected Outcome for Validated Fluxes |
|---|---|---|
| Tracer Swap | Repeat experiment with complementary tracer (e.g., [U-13C] Glutamine instead of Glucose). | Central metabolic flux distribution remains consistent. |
| Flux Ripple | Perturb a known parameter (e.g., growth rate) and re-estimate fluxes. | Flux changes align with biochemical expectations (e.g., higher growth → higher TCA). |
| Consistency w/ Extracellular Rates | Compare estimated substrate uptake from MFA to measured bioreactor rates. | Difference < 10-15%. |
| Metabolite Pool Size | Integrate quantitative metabolomics data (if available). | Estimated flux direction aligns with pool size changes under perturbation. |
Detailed Experimental Protocols
Protocol 1: Parallel Labeling Experiment for Improved Identifiability
- Cell Culture: Run two parallel bioreactors or culture flasks under identical physiological conditions.
- Tracer Administration: Supply Tracer A ([1,2-13C] Glucose) to culture A and Tracer B ([U-13C] Glutamine) to culture B. Ensure isotopic steady-state is reached.
- Sampling & Quenching: Rapidly sample and quench metabolism (e.g., cold methanol buffer) at the same metabolic steady-state time point.
- Metabolite Extraction & MS Analysis: Perform GC-MS analysis for proteinogenic amino acids and intracellular metabolites.
- Data Integration: Combine the Mass Isotopomer Distribution (MID) datasets from both tracer experiments into a single composite dataset for flux fitting in INCA or 13CFlux2.
Protocol 2: Monte Carlo Simulation for Residual Diagnostics (Metran Workflow)
- After obtaining the best-fit flux solution, fix the model parameters (fluxes) at their optimal values.
- Use the software's Monte Carlo module to generate 500-1000 synthetic MID datasets, adding random noise based on your predefined measurement error model.
- Fit each synthetic dataset to obtain a distribution of residuals (difference between simulated and "measured" synthetic data).
- Compare the distribution of residuals from the synthetic data to the residuals from your actual experimental data using a Q-Q plot or the Kolmogorov-Smirnov test.
- Systematic deviation indicates a model-data mismatch not explained by measurement noise alone.
Visualization of Workflows & Relationships
Flux Validation Core Workflow
Flux Solution Validation Decision Tree
The Scientist's Toolkit: Research Reagent Solutions
Table 3: Essential Reagents for 13C-MFA Validation Experiments
| Item | Function in Validation Protocols |
|---|---|
| [1,2-13C] Glucose | Complementary tracer for parallel labeling experiments; helps decouple parallel pathways like PPP vs. glycolysis. |
| [U-13C] Glutamine | Tracer for analyzing TCA cycle anaplerosis, glutaminolysis, and nucleotide biosynthesis fluxes. |
| Cold Methanol Quenching Buffer (-40°C) | Rapidly halts metabolism to preserve in vivo isotopic labeling patterns for accurate MID measurement. |
| Derivatization Agent (e.g., MTBSTFA, Methoxyamine) | Prepares polar metabolites for GC-MS analysis by increasing volatility and stability. |
| Internal Standard Mix (13C/15N labeled cell extract) | Added during extraction to correct for sample loss and matrix effects in LC/GC-MS quantification. |
| Silicon Antifoom Agent | Critical for maintaining controlled conditions and accurate gas transfer rates in bioreactor cultures. |
| Certified GC-MS Calibration Mix | Contains known concentrations of target metabolites for establishing quantitative response curves. |
Technical Support Center
Troubleshooting Guides & FAQs
Q1: INCA fails to converge during parameter estimation for my large-scale parallel labeling dataset. What are the primary causes? A: This is common in high-throughput studies with complex models. Primary causes are:
- Incorrect or inconsistent input data format: Ensure all labeling measurements and tracer information are correctly formatted in the Excel input sheet. Use the template validator.
- Poorly defined model constraints (flux bounds): Overly restrictive bounds can make the solution space infeasible. Widen physiologically reasonable flux bounds and re-test.
- Numerical instability in large models: Use the
Advanced -> Solver Settingsto switch from the default 'fmincon' to 'SNOPT' for better performance with >50 free fluxes. - Protocol: To diagnose, simplify your model: fix exchange fluxes at known values from extracellular rates, reduce the number of fitted parameters, and attempt to fit subsets of your data sequentially.
Q2: Metran produces unexpectedly high confidence intervals for all fluxes in my detailed single-condition analysis. How can I reduce uncertainty? A: High confidence intervals indicate insufficient experimental data to constrain the model.
- Increase measurement information: Add more mass isotopomer data (e.g., GC-MS fragments) for key metabolites in the pathway of interest.
- Refine tracer design: Use multiple, complementary tracers (e.g., [1,2-¹³C]glucose + [U-¹³C]glutamine) to provide orthogonal labeling constraints.
- Protocol: Implement a model-based tracer design experiment in silico before wet-lab work. Use Metran's simulation mode to predict confidence intervals for different tracer mixtures and select the design that minimizes overall flux uncertainty for your target pathways.
Q3: 13CFlux2 runs extremely slowly when scaling to analyze dozens of conditions. How can I optimize runtime for high-throughput? A: Performance scales with model size and number of parallel conditions.
- Enable parallel computing: In the
config.ymlfile, setparallel_processing: trueand specify the number of cores (worker_count: 8). This distributes condition analyses. - Reduce convergence criteria for screening: For initial high-throughput screening, increase the
step_toleranceandfunction_tolerancevalues (e.g., from 1e-10 to 1e-6) in the configuration to allow faster, less precise solutions. Use strict tolerances only for final selected conditions. - Use the command-line interface (CLI): Bypass the GUI for batch processing. Script your analysis using the CLI tools for efficient resource management on servers.
Q4: How do I choose between "Composite" and "Individual" fitting modes in INCA for a time-course study? A: This is a key flexibility feature for detailed dynamics.
- Choose "Composite" fit if you have a single, unified model of metabolism and want to estimate one set of fluxes that best explains all time points simultaneously. This assumes quasi-steady-state across the entire period.
- Choose "Individual" fit if you suspect metabolic fluxes shift significantly over time. This mode fits each time point independently, generating a set of fluxes for each harvest. It is more data-intensive but captures dynamics.
- Protocol: Start with "Individual" fits. If the flux solutions across time are statistically similar, a "Composite" fit is justified and will provide more precise estimates. Use the statistical comparison tool provided in INCA's output.
Table 1: Software Scalability Benchmarks (Simulated Data)
| Software | Model Size (Reactions) | Conditions Analyzed | Avg. Runtime per Condition | Recommended Use Case |
|---|---|---|---|---|
| INCA 2.2 | 100 | 1 | 45 min | Detailed single-condition with complex isotopomer networks |
| INCA 2.2 | 100 | 20 | ~18 hrs | Medium-scale (5-30 conditions) |
| 13CFlux2 v2.0 | 50 | 1 | 15 min | Fast single-condition or high-throughput screening |
| 13CFlux2 v0.3 | 50 | 100 | ~4 hrs | High-throughput (50+ conditions) |
| Metran 1.8 | N/A (Statistical) | 1 (Time-Course) | 60+ min | Detailed kinetic flux analysis from time-series data |
Table 2: Input Data Flexibility Comparison
| Feature | INCA | Metran | 13CFlux2 |
|---|---|---|---|
| Tracer Types Supported | ¹³C, ¹⁴C, ²H, ¹⁵N, ¹⁸O | Primarily ¹³C | ¹³C |
| Data Input Format | Proprietary Excel | Text/CSV | YAML/CSV |
| Parallel Labeling | Yes | Limited | Yes |
| Time-Course Data | Yes (Individual/Composite) | Yes (Specialized) | No |
| Inst. Meas. (MID) Support | Yes | Yes | Yes |
| Command-Line Interface | Limited (MATLAB) | No | Yes (Fully featured) |
Experimental Protocols
Protocol 1: High-Throughput Screening of Microbial Mutants using 13CFlux2
- Culture: Grow wild-type and mutant strains in biological triplicate in 48-well deep-well plates using [U-¹³C]glucose as sole carbon source.
- Quenching & Extraction: At mid-exponential phase, rapidly quench metabolism using 60% cold methanol (-40°C). Perform metabolite extraction via freeze-thaw cycles.
- Derivatization & GC-MS: Derivatize proteinogenic amino acids via tert-butyldimethylsilyl (TBDMS) method. Analyze fragments via GC-MS using electron impact ionization.
- Data Processing: Correct raw mass spectra for natural isotopes using the built-in tool. Export Mass Isotopomer Distributions (MIDs) for key fragments (e.g., Ala[57-159], Ser[73-147]).
- Batch Analysis: Configure a single
config.ymlfile pointing to the MIDS and uptake/excretion rates for all strains. Execute 13CFlux2 via CLI command13cflux2 batch config.yml --output ./results/.
Protocol 2: Detailed Kinetic Flux Analysis of Cancer Cell Metabolism using Metran
- Time-Course Experiment: Culture cells with [1,2-¹³C]glucose. Harvest cells at 5-8 time points (e.g., 0, 15, 30, 60, 120, 240 min post-tracer introduction).
- Sample Processing: At each time point, rapidly wash cells, quench, and extract intracellular metabolites for LC-MS analysis of labeling kinetics in metabolites like lactate, alanine, citrate, and aspartate.
- Model Configuration: Define a metabolic network model. In Metran, specify which metabolite labeling patterns are measured and which fluxes are assumed to be constant or variable over time.
- Statistical Fitting: Use Metran's Bayesian Markov Chain Monte Carlo (MCMC) sampler to estimate the posterior distributions of fluxes at each time point and their confidence intervals, accounting for measurement noise.
Visualizations
Software Workflow Selection Logic
The Scientist's Toolkit: Key Research Reagent Solutions
| Item | Function in 13C MFA | Example/Note |
|---|---|---|
| [U-¹³C] Glucose | Universal tracer for mapping overall carbon fate through central metabolism. | >99% atom ¹³C; essential for initial network validation. |
| [1,2-¹³C] Glucose | Specific tracer for resolving glycolysis, PPP, and anaplerotic fluxes (e.g., pyruvate cycling). | Allows differentiation of key parallel pathways. |
| Cold Methanol (-40°C) | Standard quenching agent to instantly halt metabolic activity for accurate snapshot of labeling. | Must be pre-chilled; volume ratio critical. |
| N-Methyl-N-(tert-butyldimethylsilyl) trifluoroacetamide (MTBSTFA) | Derivatization reagent for GC-MS analysis of amino acids. Increases volatility and provides characteristic fragments. | Must be handled under anhydrous conditions. |
| Internal Standard Mix (¹³C/¹⁵N) | For LC-MS quantification and correction; e.g., U-¹³C,¹⁵N-labeled cell extract or defined metabolite mix. | Critical for accurate absolute quantitation in flux analysis. |
| Sodium Pyruvate (¹³C-labeled) | Common tracer for analyzing TCA cycle entry and mitochondrial metabolism. | Available in various labeling patterns (e.g., [3-¹³C]). |
Technical Support Center
Troubleshooting Guides & FAQs
Q1: After exporting a flux map from INCA, I cannot import it into a custom Python script for further analysis. The error states "unrecognized matrix format." What is wrong?
A: INCA's default export for flux maps is a proprietary .mat file (MATLAB format). To ensure interoperability with Python/R, you must use the explicit export function for a "Comma-Separated Values (CSV) Matrix."
- Action: In INCA, after completing the flux estimation, go to
File > Export > Flux Results. In the dialog box, select "Export to CSV (for external analysis)". This creates two files: one for the flux values and one for the confidence intervals, which can be read usingpandas.read_csv()in Python.
Q2: My mass isotopomer distribution (MID) data from 13CFlux2 is not aligning with the input requirements for the Metran Bayesian smoothing tool. How do I format it correctly?
A: This is a common interoperability issue. 13CFlux2 exports MIDs in a long-format table. Metran requires a specific wide-format matrix with compound names and time points.
- Protocol:
- Export the "Corrected MID" table from 13CFlux2.
- Use the provided
metran_data_formatter.Rscript (available on the Metran GitHub wiki). This script requires thetidyranddplyrpackages. - The key command is:
pivot_wider(data, names_from = "Time_point", values_from = "Fraction")to reshape your data. - Save the output as a
.txttab-delimited file.
Q3: I want to apply a new machine learning-based outlier detection method to my historical 13C-MFA datasets from various projects. What is the most future-proof export format to consolidate this data?
A: For adaptation to novel analytical techniques, a rich, self-describing format is essential. We recommend exporting and archiving data in the Hierarchical Data Format (HDF5) or a structured JSON schema.
- Methodology: Develop a standardized export pipeline that bundles the following into one HDF5 group:
- Raw MID data (as a
/raw/middataset) - Network model (as an
/model/SBMLattribute or XML string) - Estimated fluxes and confidence intervals (as
/results/fluxesdataset) - Key experimental metadata (as group attributes, e.g.,
organism,carbon_source,growth_rate).
- Raw MID data (as a
- Tools: Use
h5py(Python) orrhdf5(R) to create these files. This structure ensures all contextual data travels with the numerical results.
Q4: When comparing flux results between INCA and 13CFlux2 for the same dataset, I notice systematic offsets. Could this be due to default parameter differences, and how can I isolate the cause?
A: Yes. The core numerical algorithms and default parameter tolerances differ. To perform a rigorous comparison, you must align the experimental and computational protocols.
- Troubleshooting Protocol:
- Export the Inputs: From your first software, export the exact simulated MIDs and net flux values before fitting.
- Standardize the Objective Function: Ensure both tools use the same weighting (e.g., instrument error-based vs. uniform). Manually set the same covariance matrix for the residual sum of squares (RSS) calculation.
- Fix Parameters: Constrain the same set of fluxes (e.g., substrate uptake, growth rate) to identical values in both software setups.
- Re-run and Compare: Use the standardized inputs to run the analysis in the second software. Compare the final RSS values and flux confidence intervals (see Table 1).
Table 1: Default Configuration Differences in 13C-MFA Software
| Parameter / Feature | INCA (v2.21) | 13CFlux2 (v2.0.2) | Metran (v1.8) |
|---|---|---|---|
| Core Algorithm | Elementary Metabolite Units (EMU) | Decoupled EMU | Bayesian Smoothing |
| Default Solver | MATLAB lsqnonlin |
Custom C++ "FluxSolve" | Gibbs Sampler (Stan) |
| Default RSS Weighting | Instrument Error Variance | Uniform (by default) | Not Applicable (Probabilistic) |
| Confidence Interval (CI) Method | Parameter Bootstrap | Monte Carlo / Sensitivity Matrix | Posterior Distribution Credible Intervals |
| Primary Export Format | MATLAB (.mat) | Text files (.txt, .csv) | RData (.rda) / CSV |
| Key Interoperability Script | inca2csv.m (provided) |
python_parser.py (community) |
run_metran.R (provided) |
Experimental Protocols
Protocol: Cross-Software Flux Comparison Validation
- Data Generation: Generate a simulated 'ground truth' dataset using a network model and known flux map in INCA's simulation mode. Add 0.2% relative Gaussian noise to mimic instrument error.
- Export for Interoperability: Export three items: (i) The noisy MID data as CSV, (ii) the network model in SBML L3V2 format, (iii) the list of fixed/flux ratios.
- Software-Specific Analysis:
- INCA: Import SBML and CSV data. Set RSS weighting to "instrument error" using the 0.2% noise parameter. Run flux estimation. Export results via
inca2csv.m. - 13CFlux2: Convert the SBML model using the
importSBMLfunction. Load the CSV MID data. Set the measurement standard deviation to 0.002. Run the decoupled EMU algorithm. Export fluxes via the GUI table export.
- INCA: Import SBML and CSV data. Set RSS weighting to "instrument error" using the 0.2% noise parameter. Run flux estimation. Export results via
- Consolidation & Analysis: Import both result sets into a Jupyter Notebook (Python) using
pandas. Calculate the Euclidean distance between the estimated flux vectors and the known "ground truth" vector. Plot results for visual comparison.
Visualizations
Data Flow Between 13C-MFA Tools
Future-Proofing Workflow for New Analytics
The Scientist's Toolkit: Research Reagent Solutions
Table 2: Essential Resources for 13C-MFA Interoperability Projects
| Item/Resource | Function & Purpose |
|---|---|
| SBML (Systems Biology Markup Language) | An open, XML-based format for representing biochemical network models. Critical for transferring models between INCA, 13CFlux2, and other platforms like COBRApy. |
HDF5 Library (h5py / rhdf5) |
Software libraries for creating and reading HDF5 files. Enables bundling of numerical data, models, and metadata into a single, future-proof archive. |
| Conda / Renv Environment Files | Files that specify exact versions of Python/R packages (e.g., pandas, numpy, rstan). Ensures computational reproducibility when sharing analysis scripts. |
| Jupyter Notebook / RMarkdown | Interactive document formats for weaving code, data visualization, and narrative. The ideal medium for sharing reproducible analysis pipelines that link exported data to new techniques. |
| Git Repository (e.g., GitHub, GitLab) | Version control system essential for managing and sharing conversion scripts, standardized workflows, and analysis code, facilitating collaboration and method adaptation. |
Troubleshooting Guides & FAQs
Q1: My INCA model simulation fails with "Matrix is singular to working precision." What does this mean and how do I fix it? A: This error indicates an underdetermined system, often due to insufficient measurement data or redundant fluxes. First, verify that all measured MID (Mass Isotopomer Distribution) data is correctly entered. Ensure your reaction network is stoichiometrically consistent and that you have at least one measurement for each extracellular metabolite. Use the model debugger to check for reactions that do not carry flux. Simplifying the model by removing cyclic or parallel pathways that cannot be resolved with your current dataset may be necessary.
Q2: In 13CFlux2, the confidence intervals for my flux estimates are extremely wide. How can I improve the precision? A: Wide confidence intervals suggest poor identifiability. Improve your experimental design: 1) Use multiple, complementary tracers (e.g., [1,2-13C]glucose and [U-13C]glutamine). 2) Increase the number of measured mass isotopomers, particularly from fragments like Ala, Ser, Gly, and Asp that provide overlapping constraints. 3) Check the goodness-of-fit; a poor fit may indicate an incorrect metabolic network model. Revisit your network topology for missing or incorrect reactions.
Q3: Metran runs but produces biologically implausible flux values (e.g., extremely high reverse flux). What should I check?
A: This is typically a prior constraint issue. Metran uses Bayesian estimation, and weak priors can lead to unrealistic fluxes. 1) Examine and tighten the prior distributions (mu and sigma) for the problematic fluxes in your model definition file. Incorporate literature values or thermodynamic constraints. 2) Check the measurementSigma values; if they are too large, the data cannot effectively constrain the priors. 3) Validate that your network's atom transitions are correctly mapped for the tracer used.
Q4: I'm getting a "Labeling pattern not found" error in 13CFlux2. What causes this?
A: This error occurs when the software cannot match the input tracer specification to the defined atom transitions in your model. Carefully verify: 1) The tracer compound name matches the model's metabolite ID exactly. 2) The position of labeled atoms (e.g., 1,2,3 for [1,2,3-13C]glucose) is correctly specified in the experimental protocol file. 3) The atom mapping in your network model (net.xml) correctly accounts for the carbon transitions from the tracer metabolite through its reaction pathways.
Software Comparison & Decision Matrix
Table 1: Core Software Characteristics & Requirements
| Criterion | INCA | Metran | 13CFlux2 |
|---|---|---|---|
| Primary Approach | Elementary Metabolic Unit (EMU) framework, non-linear least squares optimization. | Bayesian probabilistic framework, Markov Chain Monte Carlo (MCMC) sampling. | EMU framework, least squares estimation with statistical analysis. |
| User Interface | MATLAB-based GUI and scripts. | MATLAB-based, primarily script-driven. | Standalone Java application with GUI. |
| Cost | Commercial (paid license). | Free, open-source. | Free, open-source. |
| Coding Expertise Required | Medium (MATLAB scripting beneficial). | High (requires editing MATLAB scripts for models/experiments). | Low to Medium (GUI-driven, XML editing for models). |
| Key Output | Flux map, goodness-of-fit measures, sensitivity analysis. | Probability distributions of fluxes, confidence intervals, covariance analysis. | Flux map, comprehensive statistical analysis (confidence intervals, Monte Carlo simulation). |
| Best For | Detailed metabolic engineering studies, precise flux elucidation in complex networks. | Quantifying flux uncertainty, integrating heterogeneous data, systems biology. | Accessible, robust flux analysis with strong statistical validation. |
Table 2: Recommended Software Based on Project Parameters
| Research Goal | Recommended Budget | Recommended Tool | Rationale |
|---|---|---|---|
| High-precision flux mapping for pathway engineering. | High (License available). | INCA | Industry standard with robust algorithms and support for advanced modeling (e.g., parallel labeling). |
| Quantifying flux uncertainty & probabilistic integration of omics data. | Low / Open-source. | Metran | Unique Bayesian approach provides full posterior distributions, ideal for uncertainty quantification. |
| Standard 13C-MFA with rigorous statistics for academic publication. | Low / Open-source. | 13CFlux2 | User-friendly yet powerful, with excellent built-in statistical tools and an active user community. |
| Getting started with 13C-MFA, learning core concepts. | Low / Open-source. | 13CFlux2 | Gentler learning curve due to GUI and detailed documentation. |
Experimental Protocol: A Standard 13C-MFA Workflow
Title: Steady-State 13C Tracer Experiment for Central Carbon Metabolism Flux Analysis.
1. Cell Culture & Tracer Experiment:
- Seed cells at appropriate density in 6-well or T25 culture plates.
- Grow cells in standard medium until ~60% confluency.
- Wash: Aspirate medium and wash cells twice with warm, tracer-free base medium (e.g., DMEM without glucose/glutamine).
- Labeling: Add fresh labeling medium containing the chosen 13C-tracer (e.g., 10 mM [U-13C]glucose) and unlabeled, necessary nutrients (e.g., 4 mM glutamine). Use a consistent volume across replicates.
- Incubate: Culture cells for a duration sufficient to reach isotopic steady-state in intracellular metabolites (typically 24-48 hours for mammalian cells, verified by time-course pilot experiments).
2. Quenching & Metabolite Extraction:
- Place culture plates on an ice-cold metal plate.
- Quickly aspirate the labeling medium and immediately add pre-chilled (-20°C) 80% methanol/water solution.
- Scrape cells and transfer the extract to a pre-cooled microcentrifuge tube.
- Vortex and incubate at -20°C for 1 hour.
- Centrifuge at 16,000 x g, 20 minutes, 4°C.
- Collect supernatant (polar metabolite fraction) into a new tube. Dry completely using a vacuum concentrator.
3. Derivatization for GC-MS:
- Derivatize dried polar extracts with 20 µL of 2% Methoxyamine hydrochloride in pyridine at 37°C for 90 minutes.
- Add 80 µL of N-tert-Butyldimethylsilyl-N-methyltrifluoroacetamide (MTBSTFA) and incubate at 60°C for 60 minutes.
- Centrifuge and transfer derivative to a GC-MS vial.
4. GC-MS Data Acquisition & Processing:
- Inject sample using a standard non-polar GC column (e.g., DB-5MS).
- Use electron impact ionization (EI) and operate in selected ion monitoring (SIM) mode for optimal sensitivity.
- Collect data for key metabolite fragments (e.g., pyruvate 3TBDs, alanine 3TBDs, serine 3TBDs, glutamate 5TBDs).
- Process chromatograms to integrate peak areas for the parent (M0) and all relevant mass isotopomers (M1, M2, ...).
- Correct mass isotopomer distributions (MIDs) for natural isotope abundance using software like IsoCor or AccuCor.
Visualizations
Title: 13C Metabolic Flux Analysis Decision Workflow
Title: Tool Selection Based on Project Criteria
The Scientist's Toolkit: Essential Reagents & Materials for 13C-MFA
| Item | Function & Specification |
|---|---|
| 13C-Labeled Substrate | Tracer molecule (e.g., [U-13C]Glucose, [1,2-13C]Glucose). Purity > 99% atom 13C. Core of the experiment. |
| Labeling Medium | Custom medium (e.g., DMEM base without glucose/glutamine) to prepare the exact tracer cocktail. Ensures controlled labeling. |
| Methanol (LC-MS Grade) | Used in pre-chilled quenching/extraction solution (80% methanol/water). Rapidly halts metabolism. |
| Methoxyamine Hydrochloride | Derivatization agent. Protects carbonyl groups, forming methoxime derivatives for GC-MS analysis. |
| MTBSTFA | Derivatization agent. Adds tBDMS group to -OH, -COOH, -NH2, enabling volatilization and detection by GC-MS. |
| GC-MS with DB-5MS Column | Analytical instrument. Separates and detects derivatized metabolites. SIM mode is critical for sensitivity. |
| Isotope Correction Software (IsoCor/AccuCor) | Essential data processing tool. Corrects raw MIDs for natural abundance 13C, 2H, 29Si, 30Si, etc. |
Conclusion
The choice between INCA, Metran, and 13CFlux2 is not about finding a universally 'best' tool, but rather the most appropriate instrument for your specific research question. INCA excels in detailed, compartmentalized modeling of complex eukaryotic systems, making it a staple in pharmaceutical development. Metran's unique kinetic approach is indispensable for capturing dynamic metabolic responses to perturbations. 13CFlux2 offers unparalleled transparency, customization, and throughput for well-defined microbial or core metabolic networks, especially under budget constraints. As 13C-MFA becomes more integrated with multi-omics and machine learning, the future lies in hybrid approaches and improved data exchange standards. By understanding the foundational logic, practical workflows, and comparative strengths outlined here, researchers can confidently deploy these powerful software suites to generate robust, actionable metabolic insights that drive innovation in biomedicine and therapy development.