Decoding Flavor & Quality: A Comprehensive Guide to GC-MS Analysis of Fermentation Volatiles in Food and Beverages
This comprehensive article provides an in-depth examination of Gas Chromatography-Mass Spectrometry (GC-MS) for analyzing volatile organic compounds (VOCs) in fermented food and beverage products.
Decoding Flavor & Quality: A Comprehensive Guide to GC-MS Analysis of Fermentation Volatiles in Food and Beverages
Abstract
This comprehensive article provides an in-depth examination of Gas Chromatography-Mass Spectrometry (GC-MS) for analyzing volatile organic compounds (VOCs) in fermented food and beverage products. Aimed at researchers, scientists, and development professionals, the guide explores the foundational principles linking microbial metabolism to flavor and aroma chemistry. It details current methodological approaches, from sample preparation techniques like SPME and SBSE to advanced data analysis workflows. The article further addresses common troubleshooting scenarios, optimization strategies for complex matrices, and critical validation protocols. Finally, it evaluates GC-MS against alternative analytical platforms, establishing its pivotal role in ensuring product quality, authenticity, and driving innovation in fermentation science.
The Volatile Fingerprint: Understanding the Chemistry Behind Fermented Food & Beverage Aromas
Volatile metabolites represent a critical class of low-molecular-weight organic compounds that directly define the sensory characteristics, quality, and safety of fermented foods and beverages. Within the context of food and beverages research, these compounds serve as definitive chemical fingerprints of raw materials, microbial metabolism, and processing techniques. This whitepaper provides an in-depth technical guide to the role of volatile metabolites, with a focused thesis on their analysis via Gas Chromatography-Mass Spectrometry (GC-MS). The document details core metabolic pathways, quantitative profiles, experimental protocols, and advanced research tools essential for researchers and scientists engaged in flavor chemistry, fermentation science, and related fields.
Chemical Classification and Sensory Impact
Volatile metabolites in fermentation are primarily comprised of esters, higher alcohols, carbonyls (aldehydes, ketones), organic acids, sulfur compounds, and terpenoids. Each class imparts distinct sensory notes.
Table 1: Key Volatile Metabolite Classes and Their Sensory Attributes in Fermented Beverages
| Compound Class | Exemplary Compounds | Sensory Descriptor | Typical Concentration Range (mg/L) | Common Source |
|---|---|---|---|---|
| Esters | Ethyl acetate, Isoamyl acetate | Fruity, solvent, banana | 10 - 200 (Beer) | Yeast esterification (AATase enzymes) |
| Higher Alcohols | Isoamyl alcohol, Phenylethanol | Alcoholic, floral, fusel | 50 - 180 (Wine) | Ehrlich pathway from amino acids |
| Carbonyls | Acetaldehyde, Diacetyl | Green apple, buttery | 1 - 100 (Yogurt) | Pyruvate metabolism, bacterial action |
| Organic Acids | Acetic acid, Lactic acid | Sour, vinegar, sharp | 100 - 5000 (Vinegar) | Microbial oxidation (AAB, LAB) |
| Sulfur Compounds | H₂S, 3-Mercaptohexan-1-ol | Rotten egg, grapefruit | µg/L to mg/L (Wine) | Yeast sulfate reduction, precursor degradation |
Core Metabolic Pathways in Fermentation
Volatile production is tightly regulated by microbial enzymatic pathways. Key pathways include the Ehrlich pathway for fusel alcohols, fatty acid synthesis for esters, and glycolysis for organic acids.
Diagram Title: Ehrlich Pathway for Fusel Alcohol and Ester Biosynthesis
GC-MS Analysis: Methodological Framework
Gas Chromatography-Mass Spectrometry is the cornerstone analytical technique for volatile metabolomics. The workflow encompasses sample preparation, chromatographic separation, mass spectrometric detection, and complex data analysis.
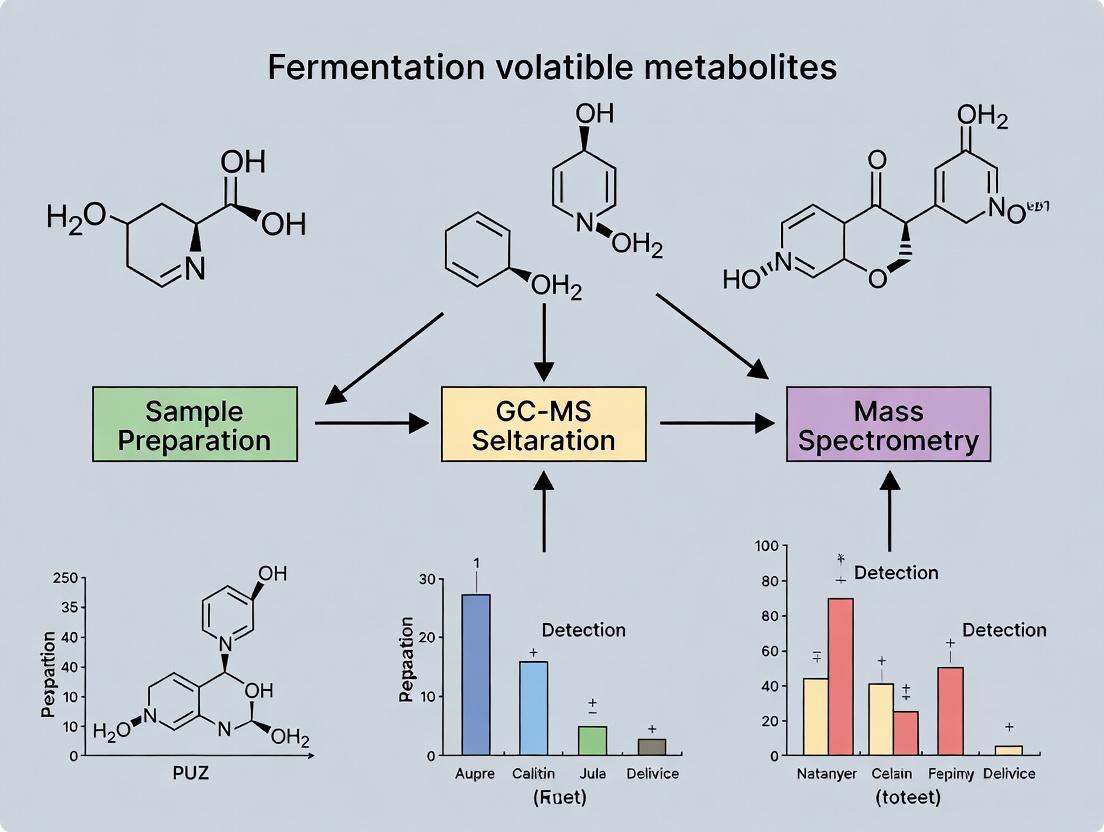
Diagram Title: GC-MS Workflow for Volatile Metabolite Analysis
Detailed Experimental Protocol: HS-SPME/GC-MS for Fermented Beverages
Objective: To profile volatile organic compounds in a fermented beverage (e.g., beer, wine). Materials: See "The Scientist's Toolkit" below. Procedure:
- Sample Preparation: Pipette 5.0 mL of degassed sample into a 20 mL amber glass headspace vial. Add 1.5 g of NaCl to increase volatility (salting-out effect). Spike with 10 µL of internal standard solution (e.g., 2-Octanol at 10 mg/L in ethanol).
- Equilibration: Cap vial with PTFE/silicone septum. Place in a controlled-temperature agitator at 40°C for 10 minutes with 250 rpm agitation.
- Extraction: Insert the SPME fiber assembly (e.g., 50/30 µm DVB/CAR/PDMS) through the septum. Expose the fiber to the sample headspace for 30 minutes at 40°C with continuous agitation.
- Desorption: Retract the fiber and immediately insert it into the GC injection port, pre-set to 250°C in splitless mode. Desorb for 5 minutes.
- GC-MS Conditions:
- Column: 60 m x 0.25 mm ID, 0.25 µm film thickness, low-polarity stationary phase (e.g., 5% phenyl / 95% dimethyl polysiloxane).
- Oven Program: 35°C (hold 5 min), ramp at 4°C/min to 240°C (hold 10 min). Carrier Gas (He) flow: 1.2 mL/min constant.
- MS: Electron Impact (EI) ionization at 70 eV. Ion source temperature: 230°C. Quadrupole temperature: 150°C. Scan range: m/z 35-350.
- Data Analysis: Process raw data using vendor software (e.g., MS-DIAL, AMDIS). Identify compounds by matching mass spectra against reference libraries (NIST, Wiley) and confirming with Linear Retention Index (LRI) values from a co-injected alkane series (C7-C30). Quantify using internal standard calibration curves.
The Scientist's Toolkit: Essential Research Reagents & Materials
Table 2: Key Research Reagent Solutions for Volatile Metabolite Analysis
| Item / Reagent | Function / Purpose | Technical Notes |
|---|---|---|
| Solid Phase Microextraction (SPME) Fiber | Adsorbs and concentrates volatile analytes from headspace. | Choice of coating (e.g., DVB/CAR/PDMS) is critical for compound selectivity. Must be conditioned and stored per manufacturer specs. |
| Internal Standard Mix | Corrects for variability in sample prep, injection, and instrument response. | Stable isotope-labeled analogs of target analytes (e.g., d5-Ethyl acetate) are ideal. Otherwise, use chemically similar compounds not found in the sample. |
| Alkane Standard Solution (C7-C30) | Allows calculation of Linear Retention Index (LRI) for compound identification. | Co-injected with sample; provides a temperature-programmed retention scale independent of column dimensions. |
| Reference Mass Spectral Libraries | Enables tentative identification of unknowns by spectral matching. | NIST and Wiley libraries are standard. Custom libraries built from pure standards improve accuracy. |
| Specialized Chromatography Columns | Separates complex volatile mixtures. | Low-polarity, high-resolution columns (e.g., Wax columns for polar volatiles) are standard. Column selection dictates separation efficiency. |
Quantitative Data and Quality Indicators
Volatile metabolite concentrations serve as definitive quality markers. Regulatory guidelines and industry benchmarks exist for key compounds.
Table 3: Benchmark Concentrations of Key Volatiles in Select Fermented Products
| Product | Target Compound | Typical Target Range | Off-Flavor Threshold | Primary Source / Control Parameter |
|---|---|---|---|---|
| Lager Beer | Acetaldehyde | 2 - 10 mg/L | 10 - 25 mg/L | Yeast health, green beer maturation |
| Sauvignon Blanc Wine | 3-Mercaptohexyl acetate (3MHA) | 1 - 50 ng/L | N/A (positive impact) | Yeast strain, glutathione levels, juice settling |
| Yogurt | Diacetyl | 0.5 - 2.0 mg/L | > 5 mg/L | Lactococcus strain, fermentation temperature |
| Sourdough Bread | Acetic Acid | 100 - 900 mg/kg | > 1000 mg/kg (excessive sourness) | Acetobacter spp., fermentation time, temperature |
| Soy Sauce | 4-Ethylguaiacol | 1 - 10 mg/L | N/A (key aroma) | Zygosaccharomyces rouxii, aging process |
This technical guide examines the biochemical pathways through which yeasts, bacteria, and molds generate characteristic volatile organic compounds (VOCs) during fermentation. Framed within a broader thesis on Gas Chromatography-Mass Spectrometry (GC-MS) analysis of fermentation volatile metabolites, this document provides a foundational resource for researchers in food, beverage, and related life science sectors. The production of these volatiles is central to the flavor, aroma, and quality of fermented products and can serve as biomarkers for microbial activity and metabolic state.
Core Metabolic Pathways for Volatile Biosynthesis
Microorganisms produce VOCs via primary and secondary metabolic pathways. Key pathways include glycolysis, the Ehrlich pathway, fatty acid metabolism, and the shikimate pathway.
Yeasts (e.g.,Saccharomyces cerevisiae)
Yeasts are prolific producers of esters, higher alcohols, and carbonyls.
- Esters: Formed via alcohol acetyltransferases (AATases) from acetyl-CoA and higher alcohols. Key enzymes: Atf1p, Atf2p, Eht1p, Eeb1p.
- Higher Alcohols: Produced via the Ehrlich pathway from amino acid catabolism (deamination, decarboxylation, reduction) or anabolically from keto-acids.
- Diacetyl/Acetoin: By-products of valine synthesis and citrate metabolism.
Lactic Acid Bacteria (LAB) (e.g.,Lactobacillus,Leuconostoc)
LAB contribute to diacetyl, acetaldehyde, and various acids.
- Diacetyl: Primarily from citrate metabolism via α-acetolactate, a chemically oxidative decarboxylation step.
- Acetaldehyde: From pyruvate decarboxylation or threonine aldolase activity.
Molds (e.g.,Aspergillus,Penicillium)
Molds generate complex volatiles including sesquiterpenes, ketones, and sulfur compounds.
- Terpenes: Synthesized via the mevalonate (MVA) or methylerythritol phosphate (MEP) pathways.
- Geosmin: Earthy off-flavor produced by sesquiterpene synthase enzymes.
- 8-Carbon Compounds: From linoleic/linolenic acid via lipoxygenase and hydroperoxide lyase activity.
Diagram: Microbial Volatile Biosynthesis Pathways
Title: Core Pathways for Microbial Volatile Production
Quantitative Profile of Key Microbial Volatiles
The following table summarizes characteristic VOCs from different microbial classes, with typical concentration ranges found in fermentation systems.
Table 1: Characteristic Volatiles from Microbial Fermentation
| Microbial Class | Example Species | Key Volatile Compounds | Typical Concentration Range in Fermentation | Primary Metabolic Pathway |
|---|---|---|---|---|
| Yeast | Saccharomyces cerevisiae | Ethyl acetate (ester) | 10 - 150 mg/L | Ester Synthesis (Atf1/2) |
| Isoamyl alcohol (higher alcohol) | 50 - 300 mg/L | Ehrlich (Leucine catabolism) | ||
| Diacetyl (vicinal diketone) | 0.1 - 2 mg/L | Valine Synthesis/Citrate | ||
| Lactic Acid Bacteria | Lactococcus lactis | Diacetyl | 1 - 10 mg/L | Citrate Metabolism |
| Acetaldehyde | 1 - 50 mg/L | Pyruvate Decarboxylation | ||
| Acetic Acid | 100 - 2000 mg/L | Heterolactic Fermentation | ||
| Molds | Aspergillus niger | Geosmin (terpene) | Trace - 10 µg/L | Terpene Synthesis (Sesquiterpene) |
| Penicillium roqueforti | 2-Heptanone (ketone) | 20 - 200 mg/L | Fatty Acid β-Oxidation | |
| 2-Methylisoborneol | Trace - 5 µg/L | Terpene Synthesis |
Experimental GC-MS Protocol for Volatile Metabolite Analysis
This is a standard headspace solid-phase microextraction (HS-SPME) coupled with GC-MS protocol for profiling microbial volatiles.
Sample Preparation
- Fermentation Quenching: Transfer 1 mL of actively fermenting broth to a 20 mL HS vial containing 0.25 mL of saturated NaCl solution (to reduce polarity and increase VOC headspace partitioning). Immediately seal with a PTFE/silicone septum cap.
- Internal Standard Addition: Add 10 µL of a deuterated internal standard solution (e.g., d5-ethyl acetate, d7-isoamyl alcohol at 10 mg/L in ethanol) to correct for extraction variability.
HS-SPME Extraction
- Conditioning: Condition a Divinylbenzene/Carboxen/Polydimethylsiloxane (DVB/CAR/PDMS) 50/30 µm SPME fiber in the GC injector port at 270°C for 30 minutes prior to first use.
- Incubation: Place the sealed sample vial in a heated agitator block at 40°C. Agitate at 250 rpm for 5 minutes to reach equilibrium.
- Extraction: Insert the conditioned SPME fiber through the septum and expose it to the sample headspace for 30 minutes at 40°C with continued agitation.
GC-MS Analysis
- Desorption: Retract the fiber and immediately inject it into the GC injector port operating in splitless mode at 250°C for 5 minutes for thermal desorption.
- Chromatography:
- Column: Equity-1 or equivalent (60 m x 0.25 mm ID, 1.0 µm film thickness).
- Oven Program: 35°C hold 5 min, ramp at 4°C/min to 150°C, then at 15°C/min to 250°C, hold 5 min.
- Carrier Gas: Helium, constant flow at 1.2 mL/min.
- Mass Spectrometry:
- Transfer line: 280°C.
- Ion Source: Electron Impact (EI) at 70 eV, temperature 230°C.
- Scan Mode: Full scan, m/z range 35-350 at 4 scans/second.
Data Processing
- Use instrument software (e.g., ChemStation, MassHunter) to integrate peaks.
- Identify compounds by comparing mass spectra to the NIST library and confirming with authentic standards' retention indices.
- Quantify using internal standard calibration curves for target analytes.
Diagram: HS-SPME GC-MS Workflow for VOC Analysis
Title: HS-SPME GC-MS Volatile Analysis Workflow
The Scientist's Toolkit: Key Research Reagent Solutions
Table 2: Essential Materials for Microbial Volatile Analysis
| Item/Category | Specific Example/Type | Function & Rationale |
|---|---|---|
| SPME Fiber | DVB/CAR/PDMS (50/30 µm) | A tri-phase coating optimal for trapping a broad range of volatile compounds (polar to nonpolar) from headspace. |
| Internal Standards | Deuterated VOCs (e.g., d5-ethyl acetate, d7-isoamyl alcohol) | Correct for variability in sample matrix, extraction efficiency, and instrument response; essential for accurate quantification. |
| Chromatography Column | High-polarity wax column (e.g., DB-Wax) | Separates polar oxygenated volatiles (alcohols, esters, acids) effectively. Often used alongside non-polar columns for compound ID via retention index. |
| Mass Spectra Library | NIST/EPA/NIH Mass Spectral Library | Reference database for tentative identification of unknown volatile compounds based on mass spectral fragmentation patterns. |
| Authentic Standards | Pure chemical standards of target VOCs | Required for definitive identification by matching retention time and for constructing calibration curves for quantification. |
| Sample Vials | 20 mL Headspace Vial with PTFE/Silicone Septum | Provides a sealed, inert environment for volatile containment and SPME extraction, minimizing adsorption and loss. |
| Quenching Solution | Saturated Sodium Chloride (NaCl) | "Salting out" effect reduces solubility of VOCs in aqueous phase, enhancing their partitioning into the headspace for improved SPME sensitivity. |
Within the framework of GC-MS analysis for fermentation volatile metabolites in food and beverages research, understanding the core chemical classes is paramount. These volatile organic compounds (VOCs) are critical determinants of aroma, flavor, and quality, and serve as biomarkers for microbial activity and process control. This technical guide provides an in-depth examination of the six core classes: Esters, Alcohols, Acids, Aldehydes, Ketones, and Sulfur Compounds, detailing their biochemical origins, analytical challenges, and significance in research and development.
Biochemical Origins and Significance
Fermentation volatiles are secondary metabolites produced by yeast (e.g., Saccharomyces cerevisiae), bacteria (e.g., Lactobacillus, Acetobacter), and molds during primary and secondary metabolism. Their production is influenced by strain genetics, substrate composition (sugars, amino acids), and environmental parameters (pH, temperature, oxygen).
- Esters: Formed via enzymatic esterification (alcohol acyltransferases) between alcohol and acyl-CoA intermediates. Impart fruity, floral notes. Key in alcoholic beverages.
- Alcohols: Produced via Ehrlich pathway from amino acids or as by-products of sugar fermentation (e.g., ethanol). Higher alcohols contribute complex aromas.
- Acids: Formed through glycolysis (pyruvic acid) or lipid metabolism. Short-chain fatty acids (e.g., acetic, butyric) contribute sharp, sour, or cheesy notes and influence pH.
- Aldehydes & Ketones: Often intermediates in amino acid and fatty acid oxidation or degradation. Can contribute green, malty, or buttery flavors. Some (e.g., diacetyl) are critical quality markers.
- Sulfur Compounds: Derived from sulfur-containing amino acids (cysteine, methionine) via yeast metabolism. Extremely potent, with low odor thresholds, contributing roasted, garlic, or rotten egg notes.
Quantitative Profiles in Select Fermented Products
Quantitative data (typical concentration ranges) are summarized from recent studies. Values are highly matrix-dependent.
Table 1: Typical Concentration Ranges of Core Volatile Classes in Fermented Beverages
| Volatile Class | Example Compound | Beer (μg/L) | Wine (μg/L) | Sourdough (μg/kg) | Key Aroma Descriptor |
|---|---|---|---|---|---|
| Esters | Ethyl acetate | 8,000 - 60,000 | 50,000 - 200,000 | 200 - 2,000 | Fruity, solvent-like |
| Isoamyl acetate | 500 - 5,000 | 100 - 3,000 | < 100 | Banana, pear | |
| Alcohols | Ethanol | 30 - 50 g/L | 80 - 150 g/L | Traces | Alcoholic |
| Isoamyl alcohol | 20,000 - 80,000 | 100,000 - 300,000 | 500 - 5,000 | Malt, fusel | |
| Acids | Acetic acid | 50,000 - 200,000 | 200,000 - 900,000 | 1,000 - 15,000 | Vinegar, sour |
| Butyric acid | < 100 | < 500 | 50 - 1,000 | Rancid, cheese | |
| Aldehydes | Acetaldehyde | 2,000 - 20,000 | 10,000 - 75,000 | < 50 | Green apple, grass |
| Ketones | Diacetyl | 50 - 500 | 100 - 2,000 | < 10 | Buttery, butterscotch |
| Sulfur Compounds | Dimethyl sulfide (DMS) | 10 - 100 | < 20 | < 5 | Cooked corn, cabbage |
| Methanethiol | < 5 | < 1 | < 1 | Rotten cabbage, sulfurous |
Experimental Protocol for GC-MS Analysis of Fermentation Volatiles
A robust headspace solid-phase microextraction (HS-SPME) coupled with GC-MS protocol is detailed below.
Sample Preparation
- Homogenization: Precisely weigh 2.0 g of solid sample (e.g., fermented dough, cheese) or 2.0 mL of liquid (e.g., beer, wine) into a 20 mL HS vial.
- Internal Standard Addition: Add 10 μL of a deuterated internal standard solution (e.g., d5-Ethyl acetate, d3-Diethyl sulfide) at a known concentration (e.g., 10 mg/L) to correct for extraction and instrument variability.
- Salting Out: Add 0.5 g of NaCl to aqueous samples to increase ionic strength and improve volatile partitioning into the headspace.
- pH Adjustment: For acid-focused analysis, acidify with 10 μL of 50% H2SO4 to protonate organic acids and enhance extraction.
- Vial Sealing: Immediately cap the vial with a PTFE/silicone septum and crimp seal.
HS-SPME Extraction
- Conditioning: Condition a Divinylbenzene/Carboxen/Polydimethylsiloxane (DVB/CAR/PDMS) 50/30 μm fiber in the GC injector port at 270°C for 10 minutes prior to first use.
- Incubation: Place the sealed vial in an automated sample tray at 40°C. Incubate for 10 minutes with agitation (250 rpm) to reach equilibrium.
- Adsorption: Expose and insert the conditioned SPME fiber into the vial headspace. Adsorb volatiles for 30 minutes at 40°C under continuous agitation.
- Desorption: Retract the fiber and immediately insert it into the GC injector port for thermal desorption at 250°C for 5 minutes in splitless mode.
GC-MS Parameters
- GC: Use a mid-polarity column (e.g., DB-624, 60 m x 0.25 mm ID, 1.4 μm film).
- Oven Program: 35°C (hold 5 min), ramp at 5°C/min to 150°C, then at 15°C/min to 250°C (hold 5 min). Total run time: 35.67 min.
- Carrier Gas: Helium, constant flow at 1.2 mL/min.
- MS: Electron Impact (EI) ionization at 70 eV. Ion source temperature: 230°C. Quadrupole temperature: 150°C.
- Scan Mode: Full scan, m/z 35-350.
Data Analysis
- Peak Identification: Use NIST/AMDIS libraries. Confirm with authentic chemical standards.
- Quantification: Perform using internal standard calibration curves for each compound class.
Visualizing the Analytical and Biochemical Workflow
Title: HS-SPME-GC-MS Workflow for Fermentation Volatiles
Title: Biochemical Pathways to Core Fermentation Volatiles
The Scientist's Toolkit: Essential Research Reagents & Materials
Table 2: Key Reagents and Materials for VOC Analysis
| Item | Function / Application | Notes |
|---|---|---|
| DVB/CAR/PDMS SPME Fiber (50/30 μm) | Adsorbs a broad range of VOCs (C3-C20) from headspace. | Most common for general profiling. CAR enhances recovery of small molecules. |
| Deuterated Internal Standards (e.g., d5-Ethyl acetate, d3-Diethyl sulfide, d5-Ethanol) | Corrects for losses during sample prep, extraction, and instrument drift. | Choose compounds not naturally present or using stable isotope dilution. |
| Certified Volatile Standard Mixtures | Used for compound identification (retention index) and calibration curve generation. | Custom mixes for esters, acids, sulfur compounds recommended. |
| NaCl (Suprapur grade) | Salting-out agent to increase ionic strength, improving headspace partitioning of polar volatiles. | Must be baked (e.g., 400°C, 4h) to remove organic contaminants. |
| DB-624 or Equivalent GC Column | Mid-polarity stationary phase (6% cyanopropylphenyl, 94% dimethyl polysiloxane). Optimal for separating diverse volatile classes. | Standard for EPA 524.2; provides excellent separation of acids, alcohols, esters. |
| Tenax TA Sorbent Tubes | For dynamic headspace/trap sampling of very low-concentration or trace sulfur compounds. | Used with thermal desorption (TD) unit coupled to GC-MS. |
| Headspace Vials (20 mL) | Certified clear glass vials with PTFE/silicone septa for leak-free sampling. | Low VOC background is critical. |
| NIST/ Wiley Mass Spectral Libraries | Reference libraries for tentative identification of unknown chromatographic peaks. | Essential for non-targeted screening. |
This technical guide delineates the role of Gas Chromatography-Mass Spectrometry (GC-MS) as the definitive analytical platform for the identification and quantification of volatile organic compounds (VOCs) within the specific research context of fermentation volatile metabolite profiling in food and beverages. The synergistic coupling of high-resolution separation (GC) with sensitive, selective detection (MS) provides an unparalleled tool for elucidating complex aroma profiles, monitoring fermentation processes, and ensuring product quality and authenticity.
Fermentation processes in food and beverage production (e.g., wine, beer, cheese, sourdough) generate complex suites of VOCs—alcohols, esters, aldehydes, acids, and terpenes—that define sensory characteristics. GC-MS is the "gold standard" for analyzing these metabolites due to its ability to separate hundreds of compounds and provide definitive identification, even at trace concentrations (ppb to ppt levels).
Core Principles: Separation via Gas Chromatography (GC)
The GC component separates volatile, thermally stable analytes based on their differential partitioning between a mobile gas phase and a stationary phase within a capillary column.
- Sample Introduction: Liquid or headspace samples are vaporized in a heated inlet. Common techniques include:
- Split/Splitless Injection: For concentrated or dilute samples, respectively.
- Headspace (HS) or Solid-Phase Microextraction (SPME) Injection: Ideal for volatile food metabolites, offering minimal sample preparation.
- Chromatographic Separation: The carrier gas (e.g., Helium, Hydrogen) transports vaporized analytes through a capillary column (typically 10-60 m, 0.10-0.32 mm ID). Separation is governed by:
- Boiling Point: Higher temperatures elute higher boiling point compounds.
- Polarity: Analytes interact with the stationary phase (e.g., 5% diphenyl / 95% dimethyl polysiloxane). Similar polarity leads to longer retention.
- Optimization: Achieved via controlled temperature ramping (e.g., 40°C hold, then 10°C/min to 250°C).
Table 1: Common GC Capillary Columns for Fermentation Metabolite Analysis
| Column Phase | Polarity | Typical Dimensions (L x ID x df) | Key Analytes Targeted |
|---|---|---|---|
| 5% Diphenyl / 95% Dimethyl Polysiloxane | Low-Mid | 30m x 0.25mm x 0.25µm | Broad-range: esters, alcohols, fatty acids |
| Polyethylene Glycol (WAX) | High | 60m x 0.32mm x 0.5µm | Polar compounds: organic acids, fusel alcohols |
| 100% Dimethyl Polysiloxane | Non-polar | 30m x 0.25mm x 1.0µm | Hydrocarbons, terpenes |
Core Principles: Identification via Mass Spectrometry (MS)
The MS serves as a universal, sensitive detector, identifying eluted compounds by measuring the mass-to-charge ratio (m/z) of their ionized fragments.
- Ionization: Electron Ionization (EI) is standard. Analytes are bombarded with 70 eV electrons, producing a reproducible, characteristic pattern of positively charged molecular and fragment ions.
- Mass Analysis: Quadrupole mass filters are most common, selectively allowing specific m/z ions to pass to the detector based on applied RF/DC voltages.
- Detection: An electron multiplier amplifies the ion signal, producing a mass spectrum for each point in the chromatogram.
- Identification: By comparing the acquired mass spectrum against reference spectral libraries (e.g., NIST, Wiley) and matching Retention Indices (RI), a compound is identified with high confidence.
Detailed Experimental Protocol: SPME-GC-MS for Wine Volatile Profiling
This protocol is cited as a representative methodology for fermentation VOC analysis.
Aim: To profile the volatile metabolite composition of a finished wine sample.
Materials & Reagents: See "The Scientist's Toolkit" below.
Procedure:
- Sample Preparation: Pipette 10 mL of wine into a 20 mL headspace vial. Add 3 g of NaCl (to promote "salting-out" of volatile compounds) and a magnetic stir bar. Seal with a PTFE/silicone septum cap.
- SPME Extraction: Condition a 50/30 µm DVB/CAR/PDMS SPME fiber according to manufacturer instructions. Place the vial on a heated stir plate (40°C). Expose the conditioned fiber to the sample headspace for 30 min with constant agitation.
- GC-MS Analysis: Retract the fiber and immediately inject it into the GC inlet (splitless mode, 250°C) for 5 min thermal desorption.
- GC Program: Oven at 40°C (5 min), ramp at 4°C/min to 240°C, hold 5 min. Carrier gas: He, constant flow 1.2 mL/min. Column: mid-polarity (e.g., DB-624, 30 m x 0.25 mm x 1.4 µm).
- MS Conditions: Ion source: 230°C; Transfer line: 250°C; Scan range: m/z 35-350; Solvent delay: 3 min.
- Data Processing: Use instrument software to integrate peaks, deconvolute overlapping signals, and identify compounds by searching mass spectra against the NIST library with a match threshold >80% and confirming with published Retention Indices.
Diagram 1: SPME-GC-MS Workflow for Volatile Analysis
Key Data Interpretation & Quantitative Analysis
GC-MS provides both qualitative (identification) and quantitative data. For quantification, internal standards (e.g., deuterated compounds) are essential.
Table 2: Example Quantitative Data of Key Volatiles in Fermented Beverages (Typical Concentration Ranges)
| Compound Class | Example Metabolite | Typical Range in Wine (µg/L) | Typical Range in Beer (µg/L) | Sensory Impact |
|---|---|---|---|---|
| Esters | Ethyl acetate | 50,000 - 80,000 | 15,000 - 30,000 | Fruity, solvent |
| Esters | Isoamyl acetate | 1,000 - 6,000 | 1,000 - 3,000 | Banana, pear |
| Higher Alcohols | Isoamyl alcohol | 30,000 - 150,000 | 50,000 - 120,000 | Fusel, alcoholic |
| Carbonyls | Acetaldehyde | 10,000 - 300,000 | 5,000 - 50,000 | Green apple, nutty |
| Terpenes | Linalool | 15 - 100 | 1 - 20 | Floral, lavender |
The Scientist's Toolkit: Essential Reagents & Materials
Table 3: Key Research Reagent Solutions for GC-MS Analysis of Fermentation Volatiles
| Item | Function & Explanation |
|---|---|
| SPME Fiber Assembly (e.g., DVB/CAR/PDMS) | Adsorbs a wide range of VOCs from sample headspace; enables solvent-free, sensitive preconcentration. |
| Internal Standard Mix (e.g., d5-Ethyl acetate, d2-Toluene) | Added to sample prior to extraction; corrects for variability in extraction efficiency, injection, and ionization. |
| Alkanes Standard Mix (C8-C40 in hexane) | Injected under identical GC conditions to calculate experimental Retention Indices (RI) for compound identification. |
| NIST Mass Spectral Library | Commercial database containing >300,000 EI mass spectra; primary reference for spectral matching. |
| Stable Isotope Labeled Substrates (e.g., 13C-Glucose) | Used in metabolic flux studies to trace the biosynthetic pathways of volatile metabolites during fermentation. |
| Ultra-High Purity Carrier Gases (He, H₂, N₂) | Mobile phase for GC; high purity (≥99.9995%) is critical to maintain system sensitivity and prevent column damage. |
| Deactivated Liner & Septa | For GC inlet; minimizes analyte degradation and adsorption, and prevents septum bleed into the system. |
Advanced Applications & Pathway Elucidation
GC-MS is pivotal in mapping metabolic pathways by quantifying substrate consumption and product formation. Stable Isotope Ratio Monitoring (GC-IRMS) can further trace flavor compound origins.
Diagram 2: Simplified Pathway from Sugar to Key Aroma Esters in Yeast
GC-MS remains the unchallenged gold standard for volatile metabolite analysis in fermentation research due to its robust separation power, sensitive and selective detection, and powerful spectral identification capabilities. Its application—from routine quality control to advanced metabolic pathway studies—continues to be foundational in driving innovation and ensuring analytical rigor in food and beverage science.
Connecting Volatile Profiles to Sensory Attributes and Product Typicity
Within the broader thesis on the application of Gas Chromatography-Mass Spectrometry (GC-MS) in the analysis of fermentation-derived volatile metabolites, this whitepaper delves into the critical link between analytical chemistry and sensory science. For researchers and scientists in food, beverage, and drug development, understanding how specific volatile organic compounds (VOCs) translate to perceived aroma, flavor, and ultimately, product typicity, is paramount. This guide provides a technical framework for establishing these connections, moving from compound identification to sensory validation.
The Analytical Foundation: GC-MS Profiling of Volatiles
The core of connecting chemistry to perception is the accurate and sensitive profiling of the volatile metabolome. GC-MS remains the gold standard for this purpose.
Detailed Experimental Protocol: HS-SPME-GC-MS
Headspace Solid-Phase Microextraction (HS-SPME) coupled with GC-MS is a widely used non-destructive method.
Materials & Sample Prep:
- Homogenized product sample (e.g., 2g cheese, 5mL wine).
- Internal Standard (IS) solution: e.g., 4-methyl-2-pentanone or deuterated analogues (50 µL of 100 ppm solution).
- SPME fiber (e.g., 50/30 µm DVB/CAR/PDMS).
- 10-20 mL headspace vial with PTFE/silicone septum.
- Incubator/heating block with agitator.
- GC-MS system with appropriate column (e.g., DB-WAX or HP-5MS).
Procedure:
- Sample Preparation: Precisely weigh sample into headspace vial. Spike with a known concentration of Internal Standard (IS) for semi-quantification. Add a magnetic stirring bar. Seal vial immediately.
- Equilibration: Place vial in heating block set to optimized temperature (e.g., 40-60°C for beverages, 50-70°C for solids). Agitate at 250 rpm for 10-15 minutes to reach equilibrium between sample matrix and headspace.
- Extraction: Expose and insert the conditioned SPME fiber through the septum into the headspace. Extract for 20-40 minutes under continuous agitation at the same temperature.
- Desorption: Retract the fiber and immediately insert it into the GC injection port (e.g., 250°C) for 5-10 minutes in splitless mode for thermal desorption.
- GC-MS Analysis:
- GC: Oven program: 40°C (hold 3 min), ramp at 5-10°C/min to 240°C (hold 5-10 min). Carrier gas: Helium, constant flow (1.0 mL/min).
- MS: Ionization: Electron Impact (EI+) at 70 eV. Scan range: m/z 35-350. Source temperature: 230°C.
- Data Processing: Use instrument software (e.g., MSD ChemStation, Xcalibur) to deconvolute peaks, identify compounds by matching spectra to reference libraries (NIST, Wiley), and integrate peak areas relative to the IS.
Data Interpretation and Quantification
Identification is confirmed by comparing both retention index (RI) on a standard stationary phase and mass spectrum with authentic standards. Semi-quantitative data (µg/kg or µg/L equivalents) is derived from the IS response.
Table 1: Example Volatile Profile from a Hypothetical Fermented Beverage
| Compound Name | CAS# | Retention Index (DB-WAX) | Sensory Descriptor (from Literature) | Relative Concentration (Area IS%) | Odor Activity Value (OAV)* |
|---|---|---|---|---|---|
| Ethyl butanoate | 105-54-4 | 1045 | Fruity, Pineapple | 12.5 | 50 |
| Isoamyl acetate | 123-92-2 | 1125 | Banana, Sweet | 8.7 | 29 |
| β-Damascenone | 23726-93-4 | 1830 | Floral, Apple | 0.05 | 25 |
| Diacetyl | 431-03-8 | 990 | Buttery, Creamy | 15.2 | 0.8 |
| Acetic acid | 64-19-7 | 1465 | Vinegar, Sour | 245.0 | 0.5 |
| OAV = Concentration / Odor Threshold. OAV >1 indicates potential sensory impact. |
Bridging to Sensory Perception
Analytical data alone is insufficient. Linking VOCs to sensory attributes requires statistical and human sensory analysis.
Key Statistical Approaches
- Odor Activity Value (OAV): Calculated as the ratio of a compound's concentration to its orthonasal odor threshold in a relevant matrix. OAV >1 suggests a direct contribution to aroma.
- Multivariate Analysis: Techniques like Principal Component Analysis (PCA) and Partial Least Squares Regression (PLS-R) correlate the volatile profile matrix (X) with descriptive sensory analysis data (Y).
Experimental Protocol: Descriptive Sensory Analysis
Aim: To generate quantitative sensory profiles for statistical correlation with GC-MS data.
Procedure:
- Panel Training: Recruit 8-12 assessors with proven sensory acuity. Train them over 10-15 sessions using standard references to recognize and consistently score a defined lexicon of attributes (e.g., "fruity," "floral," "earthy").
- Sample Presentation: Present blinded, randomized samples (coded with 3-digit numbers) in controlled sensory booths under red light if color masking is needed. Use a balanced presentation order.
- Data Collection: Assessors rate the intensity of each attribute on a continuous line scale (e.g., 0-15). Data is collected electronically (e.g., Compusense, FIZZ).
- Data Analysis: Analyze panelist consistency (ANOVA). Calculate mean intensity scores for each attribute per sample. Use these scores as the Y-matrix in PLS-R with the GC-MS X-matrix.
Table 2: Example PLS-R Loadings Linking Volatiles to Sensory Attributes
| Volatile Compound | Sensory Attribute 1 (Fruity) | Sensory Attribute 2 (Floral) | Sensory Attribute 3 (Earthy) |
|---|---|---|---|
| Ethyl butanoate | 0.85 | 0.10 | -0.05 |
| β-Damascenone | 0.25 | 0.78 | 0.15 |
| Geosmin | 0.02 | 0.05 | 0.91 |
| Loadings > |0.7| indicate a strong positive correlation. |
Defining Product Typicity
Typicity is the combination of attributes that make a product recognizable as belonging to a specific category or origin. It is defined statistically by comparing the VOC/sensory profile of a target product to a validated reference set.
Methodology for Typicity Modeling
- Build a Reference Database: Collect GC-MS and sensory data from many samples representing the defined typicity (e.g., 50+ wines from a specific appellation).
- Model Development: Use discriminant analysis (e.g., PLS-DA) or machine learning to create a model that best separates the target class from others based on key marker compounds.
- Validation: Test the model with external sample sets to determine its predictive power (sensitivity, specificity).
- Marker Identification: The model highlights the volatile compounds most responsible for classification—these are typicity markers.
The Scientist's Toolkit: Essential Research Reagents & Materials
| Item | Function & Brief Explanation |
|---|---|
| SPME Fibers (DVB/CAR/PDMS) | Triphasic coating for broad-range extraction of polar and non-polar volatiles from headspace. |
| Internal Standards (e.g., 4-methyl-2-pentanone, d³-ethyl esters) | Added in known quantity before analysis to correct for losses during sample prep and instrument variability for semi-quantification. |
| Alkane Standard Mixture (C7-C30) | Injected under same GC conditions to calculate experimental Retention Indices (RI) for compound identification. |
| NIST/Wiley Mass Spectral Library | Reference database containing mass spectra of hundreds of thousands of compounds for tentative peak identification via spectral matching. |
| Certified Pure Reference Standards | Authentic chemical standards for confirming compound identity by matching RI and for generating calibration curves for absolute quantification. |
| Stable Isotope Dilution Assay (SIDA) Standards | Deuterated or ¹³C-labeled analogues of target analytes. The ultimate internal standard for quantification, correcting for matrix effects and extraction efficiency. |
| Descriptive Sensory Analysis Lexicon | A standardized set of sensory terms and physical reference samples to train panelists for reproducible human sensory data generation. |
Visualized Workflows & Relationships
Title: From Sample to Typicity: Integrated VOC & Sensory Analysis Workflow
Title: Physiological Pathway from Volatile Compound to Sensory Descriptor
From Sampling to Spectra: A Step-by-Step GC-MS Workflow for Fermentation Analysis
Within the framework of a thesis on GC-MS analysis of fermentation volatile metabolites in food and beverages, sample preparation is the critical first step dictating data quality. This guide provides an in-depth technical comparison of five core techniques, with a focus on their application in profiling complex volatile organic compounds (VOCs) from matrices like beer, wine, yogurt, and sourdough.
Core Strategies: Principles and Applications
Static Headspace (SHS)
A non-exhaustive equilibrium technique where a sample is sealed in a vial, heated, and the vapor phase is sampled. Ideal for simple, high-concentration volatiles (e.g., ethanol, acetaldehyde). Low sensitivity but minimal matrix interference.
Dynamic Headspace (DHS) / Purge and Trap
An exhaustive technique where an inert gas purges volatiles from the sample onto a trap, which is subsequently thermally desorbed. Superior for trace-level analytes and full profiling. Essential for capturing key fermentation markers like sulfur compounds and higher alcohols at low ppb levels.
Solid-Phase Microextraction (SPME)
A versatile, solvent-free equilibrium technique utilizing a fused silica fiber coated with a stationary phase. Combines extraction, concentration, and introduction. Fiber choice (e.g., PDMS for non-polar, CAR/PDMS for broad-range) is matrix- and analyte-dependent. Widely used for targeted and untargeted profiling of fermentation esters and terpenes.
Stir Bar Sorptive Extraction (SBSE)
Utilizes a magnetic stir bar coated with polydimethylsiloxane (PDMS). Offers higher phase volume and thus greater capacity and sensitivity than SPME. Ideal for capturing subtle aroma compounds in beverages like wine. Requires thermal desorption.
Solvent Extraction
Traditional exhaustive methods like Liquid-Liquid Extraction (LLE) and Solid-Phase Extraction (SPE). Provide a broad analyte range including semi-volatiles. Useful for less volatile metabolites or when derivatization is required. Can be complex and introduce solvent artifacts.
Quantitative Comparison of Key Parameters
Table 1: Technical comparison of sample preparation methods for fermentation VOC analysis.
| Parameter | Static Headspace | Dynamic Headspace | SPME | SBSE | Solvent Extraction (LLE) |
|---|---|---|---|---|---|
| Principle | Equilibrium | Exhaustive | Equilibrium | Equilibrium/Exhaustive | Exhaustive |
| Sensitivity | Low (ppm) | Very High (ppt-ppb) | High (ppb) | Very High (ppt-ppb) | High (ppb) |
| Reproducibility (Typical RSD%) | 1-5% | 3-8% | 3-10%* | 5-12%* | 5-15% |
| Analysis Time | Fast (10-30 min) | Moderate to Long (30-60 min purge) | Moderate (30-60 min) | Long (60-240 min) | Very Long (hours) |
| Automation | Excellent | Excellent | Good | Good | Moderate |
| Primary Use Case | Major volatiles | Trace volatiles, full profile | Targeted/Untargeted profiling | Trace/ultra-trace analysis | Non-volatile/Semi-volatile metabolites |
| Key Advantage | Simple, clean | High sensitivity | Solvent-free, versatile | Highest sorption capacity | Broadest analyte range |
| Key Limitation | Low sensitivity | Carryover risk | Fiber fragility, competition | Long extraction, dedicated TD | Solvent use, evaporation step |
*RSD heavily dependent on rigorous protocol control.
Detailed Experimental Protocols
Protocol 1: SPME for Beer VOC Profiling
- Sample Prep: Degas 5 mL of beer by sonication for 5 min. Place in a 20 mL headspace vial. Add 1.5 g NaCl and a magnetic stir bar.
- Internal Standard: Spike with 10 µL of a 100 ppm 4-methyl-2-pentanol (in water) solution.
- Equilibration: Secure vial in a heated agitator at 40°C. Agitate at 500 rpm for 10 min.
- Extraction: Expose a preconditioned 2 cm DVB/CAR/PDMS fiber to the headspace for 40 min at 40°C with agitation.
- Desorption: Retract fiber and immediately inject into GC-MS inlet. Desorb at 250°C for 5 min in splitless mode.
- GC-MS Conditions: Capillary column (e.g., DB-WAX, 60 m x 0.25 mm, 0.25 µm). Oven: 40°C (hold 5 min), ramp 5°C/min to 240°C (hold 10 min). MS scan range: m/z 35-350.
Protocol 2: Dynamic Headspace for Wine Trace Aroma Compounds
- Sample Prep: Pipette 10 mL of wine into a 50 mL purge vessel. Add 5 µL of 50 ppb d8-ethyl hexanoate as surrogate.
- Purge & Trap: Connect vessel to DHS system. Purge with helium at 40 mL/min for 40 min at 25°C. Volatiles are trapped on a Tenax TA/Carbograph trap held at 30°C.
- Dry Purge: Dry trap with helium for 10 min to remove residual water.
- Desorption: Thermally desorb trap at 250°C for 5 min onto the GC column via a cryofocusing unit (-150°C).
- GC-MS Analysis: Rapidly heat cryotrap to 250°C. Use a mid-polarity column (e.g., DB-624). Oven: 35°C (hold 3 min), ramp 8°C/min to 230°C. MS in SIM mode for target compounds (e.g., volatile phenols, norisoprenoids).
Protocol 3: SBSE for Dairy Fermentation Metabolites
- Sample Prep: Homogenize 10 g of yogurt with 10 mL of saturated NaCl solution. Adjust pH to ~7. Transfer to a 20 mL vial.
- Extraction: Add a preconditioned PDMS stir bar (10 mm length, 0.5 mm film thickness). Stir at 900 rpm for 3 hours at room temperature.
- Rinse & Dry: Remove stir bar with forceps, rinse briefly with Milli-Q water, and dry on a lint-free tissue.
- Thermal Desorption: Place bar into a glass thermal desorption tube. Load into TD unit coupled to GC-MS.
- Analysis: Desorb at 250°C for 5 min with a 50 mL/min He flow onto a cooled injection system (CIS). Transfer to a DB-5MS column. Oven: 40°C to 300°C at 10°C/min. Use MS in full scan mode.
Visualized Workflows
Decision Workflow for Fermentation VOC Analysis
SPME Protocol for Fermentation VOCs
The Scientist's Toolkit: Essential Research Reagents & Materials
Table 2: Key materials and reagents for fermentation VOC analysis.
| Item | Function & Technical Relevance |
|---|---|
| DVB/CAR/PDMS SPME Fiber | Tri-phase coating for broad-range extraction of C3-C20 volatiles (e.g., esters, alcohols, aldehydes). |
| Tenax TA/Carbograph Trap | Standard adsorbent for DHS; efficiently traps a wide boiling range of VOCs while allowing water pass-through. |
| PDMS-Coated Stir Bar (SBSE) | High-capacity extraction device for ultratrace analysis; critical for low-abundance aroma impact compounds. |
| Deuterated Internal Standards (e.g., d5-ethyl acetate, d8-ethyl hexanoate) | Corrects for analyte loss and matrix effects during sample prep and instrumental variance in GC-MS. |
| High-Purity Sodium Chloride (NaCl) | Salting-out agent to decrease VOC solubility in aqueous matrices (beer, wine), improving headspace yield. |
| Stable Isotope-Labeled Surrogates | Added at sample start to monitor and correct for recovery efficiency of the entire sample prep process. |
| Carbopack B/Carboxen SPE Cartridge | For solvent extraction workflows targeting specific compound classes (e.g., acids, phenols) via selective retention. |
| Inert GC Inlet Liners | Deactivated, low-volume liners for SPME/TD to prevent analyte degradation and ensure sharp peak shapes. |
The analysis of volatile metabolites from microbial fermentation is pivotal in food and beverage research, driving advancements in flavor profiling, quality control, and process optimization. Within the broader thesis on GC-MS analysis of these compounds, achieving optimal chromatographic resolution and sensitivity is non-negotiable. This guide provides an in-depth technical examination of three interdependent, foundational parameters: column selection, temperature programming, and carrier gas flow rate. Their precise optimization is critical for separating complex, often co-eluting, volatile organic compounds (VOCs) like esters, alcohols, aldehydes, and terpenes in matrices such as wine, beer, fermented dairy, and distilled spirits.
Column Selection for Volatile Metabolites
The GC column is the primary site of separation. For volatiles, selection criteria focus on stationary phase chemistry, column dimensions (length, inner diameter, film thickness), and inertness to prevent adsorption and tailing.
Key Considerations:
- Stationary Phase: Low-polarity phases (e.g., 5% phenyl / 95% dimethyl polysiloxane) are standard for general volatile profiling. Wax columns (polyethylene glycol) are superior for separating polar volatiles like fusel alcohols and organic acids.
- Dimensions: Narrow-bore columns (0.18-0.25 mm ID) offer high efficiency and faster analysis. Standard-bore (0.32 mm ID) provides a better capacity compromise. Shorter columns (20-30m) are used for simple profiles; longer columns (60m) for complex matrices.
- Film Thickness: A thicker film (1.0-3.0 µm) increases retention and capacity for very volatile compounds (C3-C6), improving separation. A thin film (0.25 µm) is used for less volatile, heavier compounds.
Research Reagent Solutions & Essential Materials:
| Item | Function |
|---|---|
| 5% Phenyl / 95% Dimethyl Polysiloxane Column | Workhorse phase for broad-range separation of common fermentation volatiles (esters, hydrocarbons). |
| Polyethylene Glycol (Wax) Column | Essential for resolving polar, oxygenated compounds (acids, diacetyl, acetaldehyde) with high selectivity. |
| Mid-polarity phase column (e.g., 35% phenyl) | Useful for complex samples containing diverse chemical functionalities. |
| Deactivated Silica Liner & Fritted Seals | Minimizes activity and adsorption of polar analytes, crucial for trace analysis. |
| On-column or PTV Inlet System | Preferred for thermally labile compounds, minimizes discrimination of high-boiling point volatiles. |
Temperature Programming Optimization
Temperature programming is the most powerful tool for managing the elution profile of a wide-boiling-point range of volatiles (from acetaldehyde to sesquiterpenes).
Protocol: Method Development for Fermentation Volatiles:
- Initial Hold: Start 5-10°C below the solvent (e.g., water/ethanol) boiling point. For SPME or headspace, a 35-40°C initial temperature is common to focus volatile bands.
- Initial Ramp Rate: A moderate ramp (3-8°C/min) effectively separates early-eluting, critical pairs (e.g., ethyl acetate vs. ethanol; diacetyl vs. 2,3-pentanedione).
- Final Temperature & Hold: The final temperature should be high enough to elute all compounds of interest (typically 220-250°C) and held for 2-5 minutes to ensure column bake-off.
- Final Optimization: Adjust rates and add intermediate holds or ramps to resolve specific problematic regions identified in initial runs.
Quantitative Data Summary: Table 1: Exemplary Temperature Programs for Different Fermentation Matrices
| Matrix / Target Analytes | Initial Temp. (°C) | Hold Time (min) | Ramp Rate (°C/min) | Final Temp. (°C) | Hold Time (min) | Total Run Time (approx.) |
|---|---|---|---|---|---|---|
| Beer Hop Aromatics (terpenes, sesquiterpenes) | 40 | 2 | 5 → 10* | 240 | 5 | ~35 min |
| Wine Fermentation Esters (C3-C8 esters, fusel alcohols) | 35 | 5 | 4 | 220 | 3 | ~55 min |
| Distilled Spirit Congeners | 40 | 1 | 8 | 230 | 5 | ~30 min |
| Complex Sourdough VOC Profile | 40 | 2 | 3 → 6 | 250 | 2 | ~65 min |
Ramp: 5°C/min to 100°C, then 10°C/min to final temp. *Ramp: 3°C/min to 80°C, then 6°C/min to final temp.
Carrier Gas Flow Rate and Velocity Optimization
The carrier gas (Helium, Hydrogen, or Nitrogen) linear velocity directly impacts efficiency (plate height) and analysis time. The Van Deemter curve describes the relationship.
Experimental Protocol: Determining Optimal Linear Velocity (u_opt):
- Set Constant Pressure/Flow Mode: Use electronic pressure control (EPC).
- Run a Test Mixture: Inject a standard containing 2-3 key representative volatiles (e.g., ethyl acetate, isoamyl alcohol, ethyl hexanoate) at a constant temperature (e.g., 60°C).
- Vary Flow Rate: Perform 5-7 runs, systematically adjusting the column flow rate from 0.8 to 3.0 mL/min (for 0.25mm ID).
- Measure Efficiency: For each peak, calculate the plate height (H) or number of theoretical plates (N).
- Plot & Determine Minimum: Plot H versus average linear velocity (u). The velocity at the minimum of the Van Deemter curve is u_opt for that column/temperature/compound.
Guidelines for Volatiles:
- Hydrogen: Allows higher optimal linear velocities (~40-60 cm/s) for faster analysis without significant efficiency loss due to its low viscosity and favorable diffusion properties.
- Helium: Traditional choice, with u_opt typically 25-35 cm/s. Supply constraints have driven a shift to Hydrogen.
- Practical Setting: For isothermal analysis, use u_opt. For temperature-programmed runs, use constant linear velocity mode (the system automatically increases inlet pressure to maintain velocity as column temperature rises), which is superior to constant pressure mode.
Integrated Method Development Workflow
Optimization requires an iterative, systematic approach where parameters are co-optimized.
GC Parameter Optimization Workflow
Advanced Considerations in Fermentation VOC Analysis
- Inlet Liner and Splitting: A deactivated, baffled liner is crucial. Splittless or pulsed-splittless injection is standard for trace SPME/headspace work, with a split purge activated at 0.75-1.0 min to clear solvent.
- Detector Temperature: MS transfer line should be 250-280°C. For FID, 250-300°C ensures no condensation.
- Method Translation: When switching carrier gases (He to H2), the optimal linear velocity increases. A starting point is to set the H2 flow to 1.5-1.8 times the original He flow and re-optimize.
- Standardization: Use internal standards (e.g., 4-methyl-2-pentanol for spirits, 2-octanol for beer) to correct for injection variability, critical for quantitative analysis in complex fermentation matrices.
This technical guide provides an in-depth examination of core mass spectrometry (MS) configurations, with a focus on Electron Impact (EI) ionization, full scan versus Selected Ion Monitoring (SIM) modes, and the application of spectral libraries (NIST, Wiley). The content is framed within a critical thesis on the Gas Chromatography-Mass Spectrometry (GC-MS) analysis of fermentation volatile metabolites in food and beverages research. This field is pivotal for understanding flavor and aroma development, process optimization, and quality control in products like wine, beer, fermented dairy, and sourdough. Accurate metabolite profiling demands a rigorous understanding of MS configuration to maximize sensitivity, selectivity, and identification confidence.
Electron Impact (EI) Ionization: Principles and Application to Volatile Metabolites
Electron Impact (EI) is the standard, hard ionization technique used in GC-MS for the analysis of volatile and semi-volatile compounds. In EI, gaseous analyte molecules eluting from the GC column are bombarded with high-energy electrons (typically 70 eV) emitted from a heated filament. This interaction results in the ejection of an electron from the analyte molecule, forming a positively charged molecular ion (M⁺•). The excess energy often causes this ion to fragment in a reproducible, characteristic manner, generating a fragmentation pattern or "fingerprint" spectrum.
For fermentation volatiles—such as esters (ethyl acetate), higher alcohols (isoamyl alcohol), carbonyls (diacetyl), and sulfur compounds (hydrogen sulfide)—EI offers key advantages:
- Reproducible Fragmentation: Under standardized 70 eV conditions, fragmentation is highly consistent, enabling reliable spectral library matching.
- Rich Structural Information: The fragmentation pattern provides clues about the molecular structure of unknown metabolites.
- Robustness and Sensitivity: The EI source is simple and robust, suitable for a wide concentration range encountered in complex food matrices.
Scan vs. SIM Modes: A Strategic Choice for Metabolite Analysis
The choice between Full Scan and Selected Ion Monitoring (SIM) is fundamental to experimental design, balancing the need for comprehensive data against demands for sensitivity and quantitative precision.
Full Scan Mode
In full scan mode, the mass analyzer (typically a quadrupole) cycles over a predefined range of m/z values (e.g., 35-350 amu for most volatiles), collecting all ions within that range to produce a complete mass spectrum for each chromatographic time point.
- Advantages: Enables untargeted analysis and discovery of unexpected metabolites. Essential for library searching (NIST, Wiley) to identify unknowns. Provides a full data archive for retrospective analysis.
- Disadvantages: Lower sensitivity because the instrument spends only a brief time measuring each ion.
Selected Ion Monitoring (SIM) Mode
In SIM mode, the mass analyzer is programmed to dwell only on a few specific m/z values characteristic of the target analytes. This is often done in multiple time-segmented windows to monitor different compounds as they elute.
- Advantages: Dramatically improved sensitivity (10-100x) and lower detection limits due to increased dwell time on each ion. Enhanced selectivity by reducing chemical noise from the matrix.
- Disadvantages: Targeted analysis only; no information on non-target compounds. Requires prior knowledge of analyte retention times and characteristic ions.
Table 1: Quantitative Comparison of Full Scan vs. SIM Modes for Fermentation Volatile Analysis
| Parameter | Full Scan Mode | SIM Mode | Implication for Fermentation Analysis |
|---|---|---|---|
| Sensitivity | Lower (ppm-ppb) | Higher (ppb-ppt) | SIM is crucial for trace-level potent aroma compounds (e.g., thiols in wine). |
| Selectivity | Lower | Higher | SIM reduces interference from complex food/beverage matrices. |
| Data Type | Comprehensive, full spectra | Targeted, limited ions | Scan is for profiling/untargeted studies; SIM is for quantitative targeted assays. |
| Identification | Library search possible | Confirmation only (via ion ratios) | Scan is mandatory for identifying unknown metabolites in fermentations. |
| Quantitation | Less precise, higher LOQ | More precise, lower LOQ | SIM preferred for accurate quantification of key flavor metabolites. |
| Dynamic Range | ~3 orders of magnitude | ~5 orders of magnitude | SIM better suited for analytes with large concentration ranges. |
Spectral Libraries: NIST and Wiley
Spectral libraries are the cornerstone of compound identification in EI-GC-MS. They contain hundreds of thousands of reference spectra acquired under standard 70 eV conditions.
- NIST Library: Developed by the National Institute of Standards and Technology, it is the most widely used. It includes retention index data for common stationary phases, which adds a critical orthogonal filter for identification in GC-MS.
- Wiley Registry: A large commercial library containing a vast number of spectra, including many exotic compounds.
The identification process involves comparing the acquired unknown spectrum against library entries. The match is scored (e.g., Match Factor, Probability). A good practice in food metabolomics is to require a match factor >800 (out of 1000) and, crucially, to confirm the identity by analyzing a pure standard under identical analytical conditions to compare both retention time and mass spectrum.
Detailed Experimental Protocols
Protocol: Untargeted Profiling of Fermentation Volatiles using Full Scan Mode
Objective: To comprehensively identify volatile metabolites in a fermented beverage sample (e.g., craft beer).
- Sample Preparation: Perform headspace solid-phase microextraction (HS-SPME). Add 3g of NaCl and a magnetic stir bar to 10 mL of degassed beer in a 20 mL vial. Seal with a PTFE/silicone septum.
- Extraction: Incubate at 40°C for 10 min with agitation. Expose a 50/30 μm DVB/CAR/PDMS SPME fiber to the headspace for 30 min at 40°C.
- GC-MS Analysis:
- GC: Inject thermally in splitless mode (250°C inlet, 1 min purge time). Use a mid-polarity column (e.g., DB-624, 60m x 0.25mm x 1.4μm). Oven program: 40°C (hold 5 min), ramp at 4°C/min to 240°C (hold 5 min). Helium carrier gas, constant flow 1.2 mL/min.
- MS (Full Scan): EI source at 230°C, 70 eV. Transfer line at 250°C. Quadrupole at 150°C. Acquire data in full scan mode from m/z 35 to 350. Solvent delay: 3 min.
- Data Processing: Use instrument software (e.g., AMDIS) to deconvolute overlapping peaks. Search deconvoluted spectra against the NIST library. Apply retention index filtering if available.
Protocol: Targeted Quantification of Key Aroma Compounds using SIM Mode
Objective: To precisely quantify trace-level esters and thiols in Sauvignon blanc wine.
- Calibration & Internal Standard: Prepare a calibration curve in model wine (12% ethanol, 4 g/L tartaric acid, pH 3.2) for target analytes (e.g., ethyl hexanoate, 3-mercaptohexan-1-ol). Add a deuterated internal standard (e.g., d5-ethyl hexanoate) to all samples and standards at a constant concentration.
- Sample Preparation: Perform liquid-liquid microextraction. Mix 5 mL of wine with 1 mL of dichloromethane containing the ISTD. Vortex for 2 min, centrifuge, and transfer the organic layer to a GC vial.
- GC-MS Analysis:
- GC: Similar conditions as Protocol 5.1, but optimize oven program for target compound separation.
- MS (SIM): Define SIM time windows based on elution order. For each window, monitor 2-3 characteristic ions per analyte (one quantifier, one or two qualifiers). Dwell time per ion: 50-100 ms.
- Example SIM Window (5.0 - 8.0 min):
- Ethyl hexanoate: Quantifier m/z 88, Qualifier m/z 99, 117.
- d5-Ethyl hexanoate: Quantifier m/z 93.
- Quantification: Use the ratio of the analyte's quantifier ion peak area to the ISTD's quantifier ion peak area to construct the calibration curve (linear regression). Use qualifier ion ratios for confirmation (must be within ±20-30% of standard ratio).
Diagrams
Diagram 1: GC-MS Workflow for Fermentation Volatiles
Diagram 2: Decision Logic: Scan vs. SIM Mode Selection
The Scientist's Toolkit: Key Research Reagents & Materials
Table 2: Essential Materials for GC-MS Analysis of Fermentation Volatiles
| Item | Function & Technical Relevance |
|---|---|
| Stable Isotope Labeled Internal Standards (e.g., d5-ethyl acetate, 13C-isoamyl alcohol) | Corrects for analyte loss during sample prep and matrix-induced ionization effects in the MS source. Critical for accurate quantification in SIM mode. |
| SPME Fibers (DVB/CAR/PDMS, PDMS) | Enables solventless extraction and preconcentration of volatile analytes from headspace (HS-SPME) or direct immersion (DI-SPME). Choice of coating dictates selectivity. |
| Retention Index Marker Mix (Alkane Series, C8-C40) | Allows calculation of Kovats Retention Indices (RI) for each analyte. RI provides a second, chromatography-based identification parameter to confirm library match. |
| Chemical Ionization (CI) Gas (e.g., Methane) | Used in softer CI mode as a complementary technique to EI to obtain molecular weight information ([M+H]+) for compounds where the molecular ion is weak or absent in EI. |
| Deuterated Solvents (e.g., CD3OD, D2O) | Used for preparing NMR samples of isolated metabolites for definitive structural elucidation, following up on GC-MS identifications. |
| Solid-Phase Extraction (SPE) Cartridges (C18, HLB, Silica) | For clean-up and fractionation of complex sample matrices (e.g., wine, bacterial broth) prior to GC-MS analysis to reduce interferences and protect the GC column. |
In food and beverage research, the analysis of volatile metabolites produced during fermentation is critical for characterizing flavor, aroma, safety, and process efficiency. Gas Chromatography-Mass Spectrometry (GC-MS) stands as the premier analytical technique for this purpose, separating complex mixtures and providing spectral data for identification. However, the raw data output is a convolution of overlapping signals, background noise, and co-eluting compounds. This whitepaper details the core computational and analytical workflows—Deconvolution, Peak Integration, and Library Matching—required to transform raw chromatographic data into a reliable list of identified metabolites. This process forms the essential bridge between data acquisition and biological interpretation in fermentation studies.
Foundational Workflow in GC-MS Data Processing
The following diagram outlines the standard sequential workflow from raw data to metabolite identification, highlighting the core topics of this guide.
Diagram Title: Core GC-MS Data Processing Workflow
Deconvolution: Resolving Co-Eluting Signals
Deconvolution algorithms separate the mass spectra of individual compounds from regions where chromatographic peaks overlap. This is paramount in fermentation analysis where complex matrices (e.g., beer, wine, fermented dairy) contain numerous structurally similar volatiles that may not be fully resolved by the GC column.
Key Algorithms & Quantitative Performance
The table below compares the most prevalent deconvolution algorithms used in modern software, with performance metrics derived from recent benchmarking studies.
Table 1: Comparison of Common GC-MS Deconvolution Algorithms
| Algorithm | Principle | Ideal Use Case | Reported Peak Detection Sensitivity* | Reported Deconvolution Accuracy* |
|---|---|---|---|---|
| AMDIS (Automated Mass Spectral Deconvolution & Identification Sys.) | Model-based, uses unique ions and component models. | Complex, noisy data; legacy system compatibility. | ~85-92% | ~80-88% |
| PARAFAC2 (Parallel Factor Analysis 2) | Multilinear model, decomposes 3D data array (Time x m/z x Intensity). | Severe peak overlap; trilinear data. | >95% | 90-96% |
| MVSA (Multivariate Curve Resolution) | Resolves spectra and elution profiles via iterative optimization. | Overlaps of 3+ components; non-trilinear data. | 90-95% | 85-94% |
| eRah (R-based) | Untargeted, uses spectral similarity and peak shape. | Exploratory analysis of unknown volatile profiles. | ~88-93% | ~82-90% |
Note: Sensitivity and Accuracy percentages are approximations from published validation studies using standardized metabolite mixtures. Performance is highly dependent on instrument resolution, sample complexity, and parameter tuning.
Detailed Protocol: Implementing PARAFAC2 Deconvolution
This protocol is adapted for use with the PARADISe software or Matlab PLS_Toolbox.
- Data Export: Export your GC-MS run in netCDF or AIA format (ANDI-MS).
- Region Selection: Define the chromatographic region for deconvolution (e.g., 15.0 to 22.5 min).
- Parameter Initialization:
- Set the number of components to estimate slightly higher than the expected number of peaks (can be automated via SVD).
- Define mass spectral range (e.g., m/z 45-450).
- Apply necessary constraints: Non-negativity for spectra and elution profiles.
- Model Iteration: Run the alternating least squares (ALS) optimization until convergence (e.g., change in fit < 0.01%).
- Component Validation: Inspect resolved elution profiles for unimodality and resolved spectra for chemical plausibility. Discard components representing noise.
Peak Integration: Quantifying Resolved Analytes
Integration Methodology Post-Deconvolution
Once peaks are resolved, their abundance must be quantified via integration of the extracted ion chromatogram (EIC) or deconvoluted component elution profile.
Key Parameters:
- Baseline: Correctly modeled (e.g., linear, exponential, or tophat) to separate peak area from background.
- Peak Start/End Points: Determined by slope threshold or return-to-baseline.
- Integration Mode: Peak height (for narrow, symmetric peaks) or peak area (more robust for slight retention time shifts).
Table 2: Impact of Integration Parameters on Quantitative Data
| Parameter | Setting Too Low | Setting Too High | Recommended Starting Point for Volatiles |
|---|---|---|---|
| Slope Threshold | False peak splits; noisy baseline integrated. | Peaks merged; loss of resolution. | 5-10% of max peak slope |
| Peak Width | Broad peaks incorrectly split. | Narrow peaks merged with neighbors. | 4-8 seconds (Capillary GC) |
| Baseline Smoothing | High-frequency noise integrated as signal. | Peak distortion and area loss. | 3-5 scans |
Protocol: Manual Review & Correction of Integration
Even with robust algorithms, manual verification is essential.
- Visual Inspection: Scroll through the entire chromatogram. Flag peaks where baseline or valley drop appears incorrect.
- Baseline Correction: For each flagged peak, manually set baseline anchor points before the peak start and after the peak end.
- Peak Splitting/Merging: For partially resolved peaks, set a perpendicular drop from the valley minimum to the baseline to split the integrated area.
- Threshold Adjustment: Re-integrate the entire dataset with adjusted slope/height thresholds if systematic errors are observed.
Library Matching for Metabolite Identification
The Matching Process & Confidence Metrics
Matching compares the unknown spectrum against reference spectra in a library, generating a similarity score.
Table 3: Common Spectral Similarity Metrics and Interpretation
| Metric | Calculation | Range | Confidence Threshold (Typical) |
|---|---|---|---|
| Dot Product (Cosine) | Σ(Unknowni × Referencei) / √(Σ(Unknowni²) × Σ(Referencei²)) | 0-999 (or 0-1.0) | >800 (Good), >900 (Excellent) |
| Reverse Match | Weighted by reference spectrum abundance. | 0-999 | >800 (Good), >900 (Excellent) |
| Probability | Based on fit of top ions and rarity of ions. | 0-100% | >70% (Tentative), >90% (Confident) |
| Retention Index (RI) Match | Difference between experimental RI and library RI. | ΔRI units | ≤20 (Strong Confirmation) |
Diagram Title: Spectral Library Matching and Filtering Process
Detailed Protocol: High-Confidence Identification with RI Confirmation
- Acquire Experimental Retention Index (RI): Analyze a homologous series of n-alkanes (e.g., C7-C30) under identical GC conditions.
- Calculate RI: For each target peak, compute its RI using the formula: RI = 100 × [n + (tR(unknown) - tR(n)) / (tR(n+1) - tR(n))], where n is the carbon number of the alkane eluting before the unknown.
- Spectral Search: Perform a library search using the deconvoluted spectrum.
- Two-Tier Filtering:
- Tier 1 (Spectral): Retain only hits with a similarity score (Reverse Match) > 850.
- Tier 2 (RI): From the filtered list, select the hit where the library RI (if available) differs from the experimental RI by ≤ 20 units.
- Report: Report matches passing both tiers as "Confidently Identified." Matches passing only Tier 1 are reported as "Tentatively Identified" and require further confirmation (e.g., with a pure standard).
The Scientist's Toolkit: Essential Research Reagent Solutions
Table 4: Key Reagents and Materials for GC-MS Analysis of Fermentation Volatiles
| Item | Function/Application in Research | Example Product/Note |
|---|---|---|
| SPME Fiber Assembly (e.g., DVB/CAR/PDMS) | Headspace micro-extraction of volatile organic compounds (VOCs) from liquid or solid fermentation samples. | Supelco 50/30 μm DVB/CAR/PDMS, stable for ~100 injections. |
| Internal Standard Mix | Corrects for analyte loss during sample prep and instrument variability. Critical for quantification. | Deuterated compounds (e.g., d8-Toluene, d5-2-Octanone) or odd-chain esters not found in samples. |
| n-Alkane Standard Solution (C7-C30) | Required for calculating Kovats Retention Index (RI) for metabolite identification. | Commercial mix in hexane or methanol; used for RI calibration runs. |
| Retention Index Calibration | To validate and tune the GC-MS system for consistent retention times. | Fatty Acid Methyl Ester (FAME) mix or other certified standards. |
| Deuterated Surrogate Standards | Monitors and corrects for matrix effects and extraction efficiency in complex food/beverage samples. | Added at the very beginning of sample preparation. |
| High-Purity Solvents (e.g., Methanol, Hexane) | Sample dilution, standard preparation, and instrument cleaning. | GC-MS grade, low in VOC background. |
| Silanized Glass Vials & Inserts | Prevents adsorption of polar metabolites onto glass surfaces, improving recovery. | Essential for low-abundance analytes. |
| Quality Control (QC) Pooled Sample | A homogeneous aliquot of all study samples; run repeatedly to monitor system stability and data quality. | Prepared from small aliquots of each actual sample. |
Gas Chromatography-Mass Spectrometry (GC-MS) stands as the cornerstone analytical technique for profiling volatile organic compounds (VOCs) generated during the fermentation and maturation of food and beverages. Within the broader thesis of advancing food metabolomics, GC-MS enables the precise identification and quantification of key aroma-active esters, alcohols, acids, carbonyls, and sulfur compounds. This technical guide details application-specific case studies, experimental protocols, and data from current research (2023-2024) to serve as a reference for researchers and industry professionals.
Core Quantitative Data from Recent Studies
Table 1: Key Volatile Metabolites Across Fermented Products (Typical Concentration Ranges)
| Product Category | Key Volatile Compound Classes | Representative Compounds (Exemplar Concentrations) | Impact on Product Profile |
|---|---|---|---|
| Beer (Ale) | Esters, Higher Alcohols, Hop Terpenes | Ethyl acetate (15-30 mg/L), Isoamyl acetate (1-5 mg/L), β-Myrcene (Varies by hop) | Fruity, Banana, Citrus, Resinous |
| Wine (Red) | Esters, Alcohols, Oak Lactones | Ethyl hexanoate (0.1-1 mg/L), β-Damascenone (1-10 µg/L), cis-Oak lactone (1-100 µg/L) | Red Berry, Floral, Coconut, Woody |
| Whisky (Malt) | Esters, Aldehydes, Phenols | Ethyl decanoate (~5 mg/L), Vanillin (from cask, ~2 mg/L), Guaiacol (0.1-1 mg/L) | Sweet, Vanilla, Smoky |
| Cheese (Cheddar) | Fatty Acids, Sulfur Compounds, Ketones | Butanoic acid (500-2000 mg/kg), Methional (0.1-1 mg/kg), 2-Heptanone (10-50 mg/kg) | Pungent, Buttery, Fruity, Nutty |
| Fermented Meat (Salami) | Acids, Alcohols, Carbonyls | Acetic acid (1000-4000 mg/kg), 3-Methylbutanal (1-10 mg/kg), Hexanal (0.5-5 mg/kg) | Sour, Malty, Green |
| Plant-Based Cheese (Fermented) | Acids, Esters (from cultures) | Lactic acid (Primary), Diacetyl (target ~0.5 mg/kg), Ethyl butyrate (target ~0.1 mg/kg) | Sharp, Buttery, Fruity (aiming to mimic dairy) |
Table 2: Recent GC-MS Method Parameters for Volatile Analysis (2023-2024 Studies)
| Application | Sample Prep (Primary) | GC Column | MS Ionization & Scan Range | Internal Standard(s) Used |
|---|---|---|---|---|
| Beer Aroma Profiling | HS-SPME (DVB/CAR/PDMS fiber) | Mid-polarity (e.g., DB-Wax, 60m x 0.25mm) | EI, 70 eV; m/z 35-350 | 2-Octanol, 4-Methyl-2-pentanol |
| Wine Terpenes & Norisoprenoids | Liquid-Liquid Micro-extraction | Low-polarity (e.g., DB-5ms, 30m x 0.25mm) | EI, 70 eV; m/z 40-300 | 1-Heptanol (for neutral fractions) |
| Cheese Volatile Fatty Acids | Dynamic Headspace (Purge & Trap) | Polar (e.g., HP-INNOWax, 60m x 0.32mm) | EI, 70 eV; m/z 29-250 | 2-Methylpentanoic acid |
| Meat Fermentation Markers | SPME Arrow (2 cm DVB/Carbon WR) | Mid-polarity (Stabilwax, 30m x 0.25mm) | EI, 70 eV; m/z 40-450 | 2-Methyl-3-heptanone |
Detailed Experimental Protocols
Protocol: HS-SPME-GC-MS for Beer Volatile Profiling
This protocol is adapted from current craft beer metabolomics research.
- Sample Preparation: Degas 5 mL of beer by ultrasonication for 5 min. Transfer to a 20 mL HS vial.
- Internal Standard Addition: Spike with 10 µL of a 100 mg/L 2-octanol in ethanol solution.
- Equilibration: Incubate vial at 40°C for 10 min with agitation (500 rpm).
- Extraction: Expose a preconditioned 50/30 µm DVB/CAR/PDMS SPME fiber to the headspace for 30 min at 40°C.
- Desorption: Desorb the fiber in the GC inlet for 5 min at 250°C in splitless mode.
- GC Conditions: Oven program: 40°C (hold 3 min), ramp at 5°C/min to 150°C, then at 10°C/min to 240°C (hold 5 min). Carrier gas: He, constant flow 1.2 mL/min.
- MS Conditions: Transfer line 250°C, ion source 230°C, electron energy 70 eV, scan range m/z 35-350.
- Data Analysis: Compound identification via NIST 2020 library and retention index matching using an alkane series (C7-C30). Quantification via internal standard calibration curves for target esters.
Protocol: Solvent-Assisted Flavor Evaporation (SAFE) Distillation for Cheese Volatiles
Used for comprehensive isolation of volatiles from complex matrices.
- Distillation Apparatus Setup: Assemble SAFE apparatus under high vacuum (<10^-3 Pa). Cool traps with liquid nitrogen.
- Sample Loading: Homogenize 100 g of cheese with 200 mL of dichloromethane (DCM) and 200 mL of diethyl ether. Add known quantity of internal standard (e.g., 2-methylpentanoic acid).
- Distillation: Slowly immerse the flask in a 50°C water bath. Distill for 2 hours under constant, gentle magnetic stirring.
- Extract Collection: Thaw the distillate in the receiving traps. Wash traps with fresh DCM. Dry the combined organic extract over anhydrous sodium sulfate.
- Concentration: Gently concentrate the extract to approximately 1 mL under a controlled nitrogen stream at 35°C.
- GC-MS Analysis: Inject 1 µL in splitless mode onto a polar GC column (e.g., HP-INNOWax). Follow similar MS conditions as in 3.1.
Visualizations of Workflows and Pathways
Title: GC-MS Workflow for Fermentation Volatile Analysis
Title: Key Metabolic Pathways for Aroma Volatiles
The Scientist's Toolkit: Essential Research Reagents & Materials
Table 3: Key Research Reagent Solutions for GC-MS Metabolomics
| Item Name / Solution | Function & Rationale |
|---|---|
| Internal Standard Mix (Deuterated & Non-deuterated) | Corrects for sample loss and instrumental variability during sample prep and analysis. Example: d5-Ethyl acetate, 2-Octanol. |
| Alkane Standard Solution (C7-C30) | Used to calculate Kovats Retention Index (RI) for each separated compound, providing a second identifier alongside mass spectra. |
| SPME Fibers (e.g., DVB/CAR/PDMS, PDMS/DVB) | Selective adsorption of volatile compounds from headspace. Fiber choice is critical for analyte polarity and molecular weight range. |
| SAFE (Solvent Assisted Flavor Evaporation) Apparatus | Enables gentle, high-vacuum distillation of volatiles from complex, fatty matrices (cheese, meat) without artifact formation. |
| NIST/ Wiley Mass Spectral Library with RI Database | Primary tool for tentative identification of unknowns by matching acquired mass spectra and RI to reference data. |
| Stable Isotope Labeled Substrates (e.g., 13C-Glucose) | Used in tracer studies to elucidate precise biochemical pathways of volatile formation during fermentation. |
| Solid Phase Extraction (SPE) Cartridges (e.g., C18, HLB) | For fractionation and cleanup of solvent extracts (e.g., from SAFE) to reduce matrix interference prior to GC-MS. |
| Tuning & Calibration Standard (e.g., PFTBA) | Perfluorotributylamine; used to calibrate and tune the MS detector to ensure optimal sensitivity and mass accuracy. |
Solving Analytical Challenges: Troubleshooting and Optimizing GC-MS for Complex Food Matrices
Gas Chromatography-Mass Spectrometry (GC-MS) is the cornerstone analytical technique for profiling volatile organic compounds (VOCs) in fermented foods and beverages (e.g., beer, wine, cheese, fermented meats). These complex matrices present unique challenges in achieving reproducible, high-fidelity data. This technical guide addresses four critical, inter-related pitfalls—carryover, column degradation, inactive inlets, and source contamination—that directly impact data quality in quantitative metabolomics studies, framed within a broader thesis on advancing fermentation science.
Core Pitfalls: Mechanisms and Impact on Data
Carryover
Carryover refers to the appearance of analyte peaks in a chromatogram from a previous sample injection. In fermentation VOC analysis, high-concentration samples (e.g., distilled spirits, flavor concentrates) can leave residues in the injection port, liner, or column head that contaminate subsequent runs, leading to false positives and skewed quantitative results for key metabolites like esters, higher alcohols, and organic acids.
Experimental Protocol for Diagnosis:
- Perform a sequence: Blank solvent (e.g., ethanol/water mix) → High-concentration standard mix (containing target analytes at 10x expected sample concentration) → Blank solvent (same as first).
- Use identical GC-MS parameters (injection volume, temperature program).
- Analyze the second blank chromatogram. Any peak area >0.1% of the corresponding peak in the high-concentration standard indicates significant carryover.
Column Degradation
Stationary phase degradation in GC columns is accelerated by the injection of non-volatile or acidic/basic components present in fermentation samples (e.g., succinic acid, residual sugars, peptides). This causes peak tailing, loss of resolution, shifts in retention time, and increased column bleed (elevated baseline), compromising the identification and quantification of co-eluting VOCs.
Experimental Protocol for Monitoring:
- Column Bleed Test: Run a temperature program (e.g., 50°C to 300°C at 10°C/min, 10 min hold) without injection. Monitor characteristic ions for column bleed (e.g., m/z 207, 281 for PDMS-based phases) in SIM mode. A significant increase in bleed profile over time indicates degradation.
- Performance Check Mix: Regularly analyze a test mix of n-alkanes and key acidic/neutral metabolites. Plot the retention index (RI) over time. A gradual shift in RI (>10 index units) for late-eluting compounds signals phase damage.
Inactive Inlets
An inactive or adsorptive inlet (liner, sealing ferrule) causes the decomposition or adsorption of polar, active metabolites. This is particularly detrimental for trace-level sulfur compounds (e.g., thiols in wine) or diacetyl in beer, leading to poor linearity, low recovery, and non-reproducible results.
Experimental Protocol for Testing Inlet Activity:
- Prepare a test solution containing a homologous series of fatty acid methyl esters (FAMEs, C8-C24) and a polar compound like 2-octanol.
- Inject 1 µL in split mode (e.g., 50:1).
- Calculate the activity index: (Peak Area of 2-Octanol / Peak Area of C16 FAME) * 100. An index <100 indicates inlet activity issues. Compare to the value from a new, deactivated liner.
Source Contamination
Ion source contamination occurs when non-volatile material from samples enters the MS, coating the source housing, ion volume, and lenses. This reduces ion generation and transmission efficiency, causing signal loss, increased background noise, and mass calibration drift. Fermentation samples rich in salts, lipids, or pigments are common culprits.
Experimental Protocol for Source Performance Check:
- Tuning Report: Monitor the required emission current (µA) for a stable 50,000 abundance on m/z 69 (from perfluorotributylamine, PFTBA). A steady increase indicates contamination.
- Signal Decay Test: Continuously inject a low-concentration standard (e.g., 1 ppm ethyl decanoate). A drop in peak area >20% over 10 consecutive injections suggests rapid source fouling.
Data Presentation: Quantitative Impact of Pitfalls
Table 1: Impact of Pitfalls on Key Fermentation Metabolite Quantitation
| Pitfall | Analyte Class (Example) | Typical Signal Change | Impact on Quantitation (RSD) | Diagnostic Threshold |
|---|---|---|---|---|
| Carryover | Esters (Ethyl acetate) | False positive peak in blank | RSD >15% for low-conc. samples | >0.1% area in post-sample blank |
| Column Degradation | Fatty Acids (Octanoic acid) | Peak tailing (Asymmetry >1.5) | RI shift >10 units, RSD >20% | Baseline rise >10% vs. new column |
| Inactive Inlet | Sulfur Compounds (3-Mercaptohexanol) | Signal loss (>50% recovery) | Poor linearity (R² <0.990) | Activity Index <100 |
| Source Contamination | Higher Alcohols (Isoamyl alcohol) | General signal attenuation (>30%) | Increased LOD (e.g., 2x higher) | Emission current increase >50 µA |
Table 2: Essential Maintenance Intervals for High-Throughput Fermentation VOC Analysis
| Component | Preventive Action | Recommended Frequency | Key Performance Metric to Monitor |
|---|---|---|---|
| Liner / Inlet | Replace with deactivated liner | Every 100-150 injections | Activity Index, Peak Tailing for early eluters |
| GC Column | Trim column front (0.5-1m) | Every 300-500 injections | Retention Index stability, peak asymmetry |
| Septum | Replace septum | Every 50-100 injections | Baseline spikes, pressure stability |
| Ion Source | Clean or polish | Every 500-1000 injections | Signal intensity for tuning ions, required emission current |
| Pump Oil | Change oil in rough pump | Quarterly or per manufacturer | Ultimate vacuum pressure |
Detailed Mitigation Protocols
Protocol to Eliminate Carryover
- Use a Guard Column: Install a 1-5m deactivated retention gap before the analytical column.
- Optimize Injection Port Purge: Ensure the split/splitless purge valve is activated 0.5-1 min post-injection to clear the liner.
- Implement Solvent Wash Sequences: Program autosampler wash cycles with strong solvent (e.g., dichloromethane) followed by sample solvent (e.g., ethanol) between every injection for fermentation samples.
- Regular Liner Change: Use a high-quality, deactivated, single-taper liner with glass wool for better vaporization and trapping of non-volatiles.
Protocol for Column Restoration & Care
- Conditioning After Trimming: After trimming the column front, condition by heating from 50°C to 10°C above the maximum operating temperature at 3°C/min, holding for 30-60 min under carrier gas flow.
- Sample Cleanup: Implement a solid-phase microextraction (SPME) or headspace (HS) injection method instead of liquid injection to minimize non-volatile introduction.
- Use of Retention Gaps: As above, a guard column is sacrificial and should be trimmed more frequently than the analytical column.
Protocol for Inlet Re-activation
- Liner Deactivation: Soak liner and glass wool in 5% dimethyldichlorosilane (DMDCS) in toluene for 1 hour. Rinse sequentially with toluene, methanol, and dichloromethane. Bake at 260°C under inert gas for 2 hours.
- Seal and Ferrule Replacement: Always use fresh graphite/vespel ferrules when reinstalling the column into the inlet/MSD.
Protocol for Source Cleaning
- Disassembly: Follow manufacturer guidelines to remove ion source assembly.
- Mechanical Cleaning: Gently polish all metal surfaces (ion volume, repeller, lenses) with fine aluminum oxide abrasive slurry or sandpaper (~600 grit).
- Solvent Bath: Sonicate components in HPLC-grade methanol for 15 minutes, then in distilled water for 15 minutes. Repeat if necessary.
- Drying and Reassembly: Bake components in an oven at 100°C for 1 hour. Reassemble and perform full MS tune and calibration.
Visualization: Workflow and Relationships
Title: GC-MS Pitfalls: Causes, Symptoms, and Mitigation Workflow
The Scientist's Toolkit: Research Reagent Solutions
Table 3: Essential Materials for Reliable Fermentation VOC GC-MS
| Item | Function & Specificity | Example Product/Chemical |
|---|---|---|
| Deactivated Inlet Liners | Provides inert surface for sample vaporization, minimizing adsorption and decomposition of active metabolites. | Single-taper, glass wool-packed liner, deactivated with silanization. |
| Guard/Retention Gap Column | Sacrificial column segment that traps non-volatile residues, protecting the expensive analytical column. | 1-5m of 0.53mm ID deactivated fused silica. |
| High-Purity Silylation Grade Solvents | For sample dilution and system washing; low residue minimizes background contamination. | Dichloromethane, Methanol, Hexane (≥99.9%, GC-MS grade). |
| Performance Test Mix | For monitoring column degradation, inlet activity, and system sensitivity over time. | Mix of n-Alkanes (C7-C30), 2-octanol, fatty acid methyl esters. |
| Mass Spectrometer Tuning Standard | For daily verification of MS sensitivity, mass calibration, and diagnosis of source contamination. | Perfluorotributylamine (PFTBA) or similar perfluorinated compound. |
| SPME Fibers | For headspace sampling; eliminates non-volatile transfer to the GC system, ideal for complex fermentation matrices. | Divinylbenzene/Carboxen/Polydimethylsiloxane (DVB/CAR/PDMS) 50/30 μm. |
| Deactivation Reagents | For restoring inertness to glassware, liners, and ferrules in the lab. | Dimethyldichlorosilane (DMDCS), 5% in toluene. |
| Abrasive Cleaning Kits | For manual polishing of ion source components to restore optimal ion generation. | Aluminum oxide slurry (0.05-1.0 μm). |
In Gas Chromatography-Mass Spectrometry (GC-MS) analysis of volatile metabolites from fermented food and beverage matrices, the presence of high concentrations of sugars, salts, fats, and proteins presents a formidable analytical challenge. These matrix components induce significant "matrix effects," leading to analyte signal suppression or enhancement, peak interference, column degradation, and ion source fouling. This whitepaper provides an in-depth technical guide for researchers and scientists to identify, quantify, and mitigate these effects to ensure data accuracy and instrument longevity within fermentation volatile metabolomics studies.
Quantification of Matrix-Induced Analytical Errors
Matrix effects can be quantitatively assessed by comparing the response of an analyte in a pure standard versus in a matrix extract. The Matrix Effect (ME%) is calculated as:
ME% = [(Area of analyte in post-extracted spiked matrix / Area of analyte in neat solvent) - 1] * 100%
A value of 0% indicates no effect; negative values indicate suppression, positive values indicate enhancement.
Table 1: Measured Matrix Effects on Select Fermentation Volatiles in Common High-Interference Matrices
| Analyte (Volatile) | Matrix Type | Sugar (g/L) | Salt (%) | Fat (%) | Protein (%) | ME% (Avg.) | Primary Interferent |
|---|---|---|---|---|---|---|---|
| Ethyl Acetate | Beer Wort | 120 | - | - | 0.5 | -25.3 | Sugar |
| Diacetyl | Cheese Fermentate | 1.5 | 2.5 | 25.0 | 22.0 | -41.7 | Fat/Protein |
| Isoamyl Alcohol | Soy Sauce Moromi | 10.0 | 18.0 | 2.0 | 10.0 | -32.1 | Salt |
| Acetaldehyde | Wine Must | 220 | - | - | 1.2 | -18.9 | Sugar |
| 2,3-Pentanedione | Cultured Butter | 0.5 | 1.0 | 86.0 | 0.8 | -68.4 | Fat |
Detailed Experimental Protocols for Mitigation
Protocol: Selective Clean-Up of Fatty Matrices Using Aminopropyl Solid-Phase Extraction (SPE)
Objective: Remove triglycerides and fatty acids prior to GC-MS injection.
- Conditioning: Load 500 mg aminopropyl SPE cartridge with 5 mL hexane.
- Loading: Dilute 1 g of fat-rich sample (e.g., fermented dairy) in 5 mL hexane:diethyl ether (9:1 v/v). Apply to column.
- Washing: Elute non-polar lipids with 10 mL chloroform:isopropanol (2:1 v/v). Discard fraction.
- Elution of Volatiles: Elute target volatile metabolites (esters, ketones, alcohols) with 8 mL diethyl ether:acetone (1:1 v/v).
- Concentration: Gently evaporate eluent under nitrogen stream at 30°C to 500 µL. Transfer to GC vial for analysis.
Protocol: Salt and Sugar Removal via "Salting-Out" Assisted Liquid-Liquid Extraction (SALLE)
Objective: Efficiently partition volatile organics away from aqueous, high-sugar/salt matrices.
- Sample Prep: Homogenize 2 mL of sample (e.g., soy sauce or wine must) with 2 mL saturated ammonium sulfate solution.
- Extraction: Add 4 mL of chilled acetonitrile. Vortex vigorously for 3 minutes.
- Phase Separation: Centrifuge at 10,000 x g for 10 min at 4°C. A biphasic system forms.
- Collection: The upper organic layer (acetonitrile, now containing partitioned volatiles) is transferred.
- Drying & Reconstitution: Pass extract through anhydrous sodium sulfate cartridge. Concentrate under N₂ and reconstitute in 100 µL ethyl acetate for GC-MS.
Protocol: Protein Precipitation and Headspace Optimization for Complex Slurries
Objective: Denature and remove proteins, then analyze via Headspace-SPME-GC-MS.
- Precipitation: Mix 1 mL of proteinaceous fermentation slurry with 2 mL of chilled acetone. Vortex for 2 min. Centrifuge at 15,000 x g for 15 min.
- Supernatant Transfer: Carefully collect supernatant into a 20 mL headspace vial.
- Internal Standard Addition: Add 10 µL of deuterated d5-2-heptanone (50 ppm) as internal standard.
- HS-SPME: Incubate vial at 60°C for 10 min with agitation. Expose a 50/30 µm DVB/CAR/PDMS fiber for 30 min at same temperature.
- Desorption: Desorb fiber in GC inlet at 250°C for 5 min in splitless mode.
The Scientist's Toolkit: Key Research Reagent Solutions
Table 2: Essential Reagents and Materials for Managing Matrix Effects
| Item | Function | Application Note |
|---|---|---|
| Aminopropyl SPE Cartridges (500 mg/3 mL) | Selective retention of fatty acids and triglycerides via polar interactions. | Critical for cleaning up dairy/meat fermentation volatiles. Prevents column degradation. |
| Deuterated Internal Standards (e.g., d5-2-heptanone, d3-acetic acid) | Corrects for analyte loss during sample prep and signal suppression/enhancement during MS analysis. | Must be added at the earliest possible step; used for standard addition quantification. |
| Anhydrous Sodium Sulfate (Granular) | Removes trace water from organic extracts post-liquid-liquid extraction. | Essential for preventing water ingress into GC-MS system, which damages columns and detectors. |
| Divinylbenzene/Carboxen/Polydimethylsiloxane (DVB/CAR/PDMS) SPME Fiber | Adsorbs a broad range of volatile compounds with varying polarities from headspace. | Minimizes injection of non-volatile matrix components. Optimal for complex fermentation headspace. |
| Tenax TA Adsorbent Tubes | For dynamic headspace (purge-and-trap) concentration of trace volatiles from bulky or dilute matrices. | Efficient for capturing very volatile compounds (e.g., acetaldehyde) lost in static headspace. |
| Guard Column (5m deactivated silica) | Installed before analytical column. Acts as a sacrificial trap for non-volatile residues. | Extends analytical column life. Can be trimmed or replaced periodically. |
| Matrix-Matched Calibration Standards | Standards prepared in a matrix similar to the sample to mimic its effect. | Gold standard for accurate quantification; compensates for all matrix effects but is resource-intensive. |
Visualization of Workflows and Relationships
Diagram 1: Decision Workflow for Managing Matrix Effects in GC-MS
Diagram 2: Pathways of Matrix Interference in GC-MS Analysis
Advanced Quantification Strategies
Beyond standard addition and matrix-matched calibration, the use of internal standard normalized standard addition (IS-NSA) is recommended for high-throughput labs. Here, a deuterated internal standard (IS) is added to all samples and calibration spikes. The calibration curve is plotted as (Analyte Area / IS Area) against the spiked analyte concentration. The x-intercept gives the original sample concentration. This method efficiently corrects for both sample-to-sample matrix variability and instrument drift.
Effective management of matrix effects from sugars, salts, fats, and proteins is non-negotiable for achieving precise and accurate quantification of volatile metabolites in fermented products. A systematic approach involving initial assessment, strategic sample clean-up (SALLE, SPE), headspace isolation, and rigorous calibration is essential. Implementing these protocols safeguards analytical instrumentation and ensures that the rich volatile profile of fermentation matrices is accurately translated into reliable, actionable data for research and development.
In the analysis of fermentation volatile metabolites in food and beverages via Gas Chromatography-Mass Spectrometry (GC-MS), detecting trace-level compounds is paramount. These compounds, often present in the low part-per-billion (ppb) or part-per-trillion (ppt) range, are critical markers for flavor, aroma, quality, and safety. However, their accurate quantification is hampered by low instrumental sensitivity and high chemical background noise from complex matrices. This technical guide details a systematic approach to optimize the entire analytical workflow, from sample preparation to data processing, specifically framed within food and beverage fermentation research.
Core Challenges in Trace Analysis
The primary hurdles include:
- Matrix Complexity: Fermentation broths contain sugars, proteins, salts, and ethanol, which can co-elute and cause ionization suppression or column degradation.
- Compound Volatility and Stability: Many key aroma compounds are highly volatile and thermally labile.
- Instrument Detection Limits: Standard GC-MS setups may not reach the required sensitivity.
- Background Interference: Column bleed, septa leaks, and system contaminants mimic analyte signals.
Methodological Optimization: A Tiered Approach
Sample Preparation & Pre-Concentration
Effective sample preparation is the first critical step to enhance sensitivity and reduce matrix interference.
Experimental Protocol: Headspace Solid-Phase Microextraction (HS-SPME) Optimization
- Objective: Pre-concentrate volatile organic compounds (VOCs) from a liquid fermentation sample.
- Materials: Fermented beverage sample (e.g., wine, beer), salted (NaCl), 20 mL headspace vial, magnetic stirrer, Divinylbenzene/Carboxen/Polydimethylsiloxane (DVB/CAR/PDMS) SPME fiber, thermostatic heater.
- Procedure:
- Transfer 5 mL of sample into a 20 mL headspace vial. Add 1.5 g of NaCl to saturate the solution and reduce analyte solubility (salting-out effect).
- Seal the vial with a PTFE/silicone septum cap.
- Condition the SPME fiber according to manufacturer specifications (typically 250°C for 5-10 min in GC inlet).
- Place the vial on a heated stirrer. Incubate at 40°C for 10 min with constant agitation at 500 rpm.
- Expose the conditioned SPME fiber to the sample headspace for 30 min at 40°C.
- Retract the fiber and immediately insert it into the GC injection port for thermal desorption (250°C for 5 min in splitless mode).
GC-MS Instrumentation & Parameter Tuning
Optimizing the chromatographic and mass spectrometric conditions is essential for separating trace analytes from background.
Experimental Protocol: Selected Ion Monitoring (SIM) Method Development
- Objective: Maximize signal-to-noise ratio (S/N) for target trace metabolites.
- Procedure:
- Perform an initial full-scan (e.g., m/z 35-350) analysis of a standard mixture containing target compounds.
- Identify 2-3 characteristic, high-abundance ions for each target compound. One serves as the quantifier ion, the others as qualifiers.
- Group ions into time segments based on their elution order to maximize dwell time (≥ 50 ms per ion).
- Program the MS detector to operate in SIM mode using these defined segments.
- Compare the S/N for a target compound (e.g., 2,4,6-Trichloroanisole at 0.1 ppb) in full-scan vs. SIM mode. SIM typically provides a 10- to 100-fold improvement in S/N.
Inlet & Column Selection
Key Considerations:
- Inlet: Use a programmed temperature vaporizing (PTV) inlet in solvent vent mode for large-volume injection (LVI) of liquid extracts, significantly enhancing sensitivity.
- Column: Opt for a mid-polarity stationary phase (e.g., 35% phenyl / 65% dimethyl polysiloxane) for better separation of polar volatiles. Use a guard column to protect the analytical column from non-volatile matrix residues.
Data Presentation: Quantitative Impact of Optimization Strategies
Table 1: Comparison of Signal-to-Noise (S/N) Ratios for Key Trace Fermentation Metabolites Under Different GC-MS Conditions
| Target Compound (in Beer Matrix) | Concentration (ppb) | Full-Scan S/N | SIM Mode S/N | HS-SPME + SIM S/N | LOD Achieved (ppb) |
|---|---|---|---|---|---|
| Ethyl Octanoate | 5.0 | 15 | 210 | 1850 | 0.05 |
| 2,4,6-Trichloroanisole (Cork Taint) | 0.05 | 3* (Not Detected) | 25 | 180 | 0.005 |
| Diacetyl (Butter Off-Flavor) | 10.0 | 8 | 95 | 520 | 0.2 |
| β-Damascenone (Fruity/Aroma) | 1.0 | 5 | 70 | 610 | 0.02 |
| Guaiacol (Smoky Phenolic) | 2.0 | 12 | 165 | 1100 | 0.03 |
*Signal indistinguishable from baseline noise.
Table 2: Key Research Reagent Solutions & Essential Materials
| Item | Function/Benefit |
|---|---|
| DVB/CAR/PDMS SPME Fiber | Triphasic coating optimized for adsorption of a broad range of VOCs from very volatile (C3-C6) to higher molecular weight compounds. |
| MXT-WAX GC Column | Polyethylene glycol stationary phase; highly polar, ideal for separating volatile acids, alcohols, and esters common in fermentation. |
| Deactivated Silglass Liner | Inert, non-catalytic surface for PTV or split/splitless inlet; minimizes thermal degradation of labile analytes. |
| Internal Standard Mix (e.g., d5-Toluene, d3-2-Octanone) | Isotopically labeled compounds added to all samples for correction of analyte loss during preparation and instrument variability. |
| High-Purity Helium Carrier Gas (6.0 grade) | Minimizes background impurities and oxygen/water contamination that cause column degradation and baseline noise. |
| Silanized Glass Wool | For use in inlet liners; traps non-volatile residues while allowing vaporization of analytes, protecting the column. |
| Mass Spectrometry Tuning Calibrant (e.g., PFTBA) | Perfluorotributylamine; used to calibrate and tune the MS detector mass scale and sensitivity for reproducible performance. |
Data Processing & Background Subtraction
Advanced software tools are necessary for final noise reduction.
- Algorithmic Background Subtraction: Use software features like "Background Subtraction" or "Spectral Deconvolution" (e.g., AMDIS, ChromaTOF) to mathematically separate co-eluting peaks and subtract column bleed profiles.
- Multivariate Analysis: Employ Principal Component Analysis (PCA) to distinguish true analyte patterns from systematic background drift across multiple samples.
Visualized Workflows & Pathways
Title: Trace Analysis GC-MS Workflow
Title: Noise Mitigation Path to Target Signal
In the quantitative analysis of volatile metabolites from food and beverage fermentation via Gas Chromatography-Mass Spectrometry (GC-MS), data integrity is paramount. Two persistent chromatographic challenges—co-elution and peak tailing—directly compromise the accuracy of metabolite identification and quantification. Co-elution leads to spectral contamination, making deconvolution difficult, while peak tailing reduces resolution, increases detection limits, and impairs precise integration. This technical guide explores the root causes of these issues within fermentation metabolite analysis and presents advanced, practical solutions to achieve robust, publication-quality separations.
Fundamental Challenges in Fermentation Volatile Analysis
Fermentation broths are complex matrices containing a wide range of volatile organic compounds (VOCs)—acids, alcohols, esters, aldehydes, and ketones—with varying polarities and chemical functionalities. This diversity inherently challenges the chromatographic system. Co-elution is frequent among structurally similar compounds (e.g., isoamyl acetate and active amyl acetate). Peak tailing is particularly problematic for active compounds like organic acids (acetic, butyric) and certain alcohols on standard stationary phases due to undesirable secondary interactions with active sites in the inlet liner, column, or flow path.
Advanced Solutions for Co-elution Mitigation
Stationary Phase Selection and Optimization
The choice of stationary phase is the primary tool for resolving co-eluting peaks. For complex fermentative VOCs, polyethylene glycol (WAX) columns are often preferred for separating polar compounds, while mid-polarity phases (e.g., 624, VF-WAXms) offer a balanced profile.
Table 1: Performance of Common GC Columns for Key Fermentation Metabolites
| Column Stationary Phase | Polarity | Ideal For | Resolution Factor (Rs)* for Ethyl Acetate / Ethanol | Recommended for |
|---|---|---|---|---|
| DB-WAX (Polyethylene Glycol) | High | Acids, Alcohols, Esters | 1.8 | Beverage Aroma Profiling |
| DB-624 (6% Cyanopropylphenyl) | Mid | Broad-range VOCs | 1.5 | General Fermentation Screening |
| DB-5ms (5% Phenyl) | Low | Hydrocarbons, Ketones | 1.2 | Off-flavor Analysis |
| Stabilwax-DA | High | Acidic/Basic Compounds | 2.1 | Complex Acid Mixtures |
*Theoretical Rs values under optimized temperature programs. Rs > 1.5 indicates baseline resolution.
Comprehensive Two-Dimensional GC (GC×GC)
GC×GC is a revolutionary technique for tackling extreme complexity. It employs two columns with orthogonal separation mechanisms (e.g., non-polar × polar). Modulation between columns spreads compounds into a 2D plane, dramatically increasing peak capacity.
Experimental Protocol for GC×GC-MS Method Development:
- Primary Column: Select a non-polar column (e.g., Rxi-5Sil MS, 30 m × 0.25 mm × 0.25 µm).
- Secondary Column: Choose a polar column (e.g., Rxi-17Sil MS, 1.5 m × 0.18 mm × 0.18 µm).
- Modulator: Install a cryogenic or flow modulator.
- Method Parameters: Set primary oven program (e.g., 40°C hold 2 min, to 250°C at 3°C/min). Secondary oven offset +5°C. Modulator period: 3-6 s (must be > peak width in 1D).
- Data Acquisition: Use high-speed MS (≥ 100 Hz) to capture narrow (50-100 ms) peaks from the second dimension.
Diagram 1: GCxGC-MS workflow for metabolite separation.
Deconvolution Software Algorithms
Advanced software solutions like AMDIS (Automated Mass Spectral Deconvolution and Identification System) or ChromaTOF's proprietary algorithms can mathematically resolve co-eluting peaks by extracting pure component spectra from overlapping signals, provided the mass spectra have key differentiating ions.
Strategies for Eliminating Peak Tailing
Inlet and Column Maintenance
Active sites are the primary cause of tailing. A rigorous maintenance protocol is essential.
- Inlet Liner: Use deactivated, single-taper liners with wool for homogeneous vaporization. Replace after 50-100 injections of fermentation samples.
- Column Installation: Ensure a clean, square cut and proper installation depth (e.g., Agilent MSD: 6.5 mm from the bottom of the interface).
- Column Conditioning: Follow manufacturer protocol before use and after trimming.
Use of Derivatization
Derivatizing active functional groups (e.g., -COOH, -OH) is highly effective for acids and alcohols. Protocol for Silylation of Fermentation Acids:
- Reagents: N-Methyl-N-(trimethylsilyl)trifluoroacetamide (MSTFA) with 1% trimethylchlorosilane (TMCS).
- Procedure: Dry 100 µL of sample extract under nitrogen. Add 50 µL of pyridine and 100 µL of MSTFA+1% TMCS.
- Reaction: Heat at 70°C for 30 minutes. Cool and directly inject 1 µL.
- Outcome: Converts acetic acid to its trimethylsilyl ester, eliminating hydrogen bonding and dramatically improving peak shape on standard columns.
Specialized "Inert" Chromatographic Hardware
Modern hardware is designed with advanced deactivation technologies. Table 2: Impact of Inert Flow Path Components on Peak Tailing Factor (TF) for Acetic Acid*
| Component | Standard Configuration TF | "Inert" Configuration TF | Improvement |
|---|---|---|---|
| Inlet Liner | Deactivated Glass, 4.0 | Premium Deactivated Liner with Wool, 1.5 | 62.5% |
| GC Column (WAX) | Standard, 3.2 | Ionic Liquid / Highly Deactivated Phase, 1.3 | 59.4% |
| Transfer Line | Standard Fused Silica, 2.1 | Siltek-Coated, 1.1 | 47.6% |
| Full System | All Standard, 4.5 | All Inert, 1.2 | 73.3% |
*TF measured at 5% of peak height; TF=1.0 is ideal Gaussian.
Integrated Method for Fermentation VOC Analysis
Below is a recommended protocol synthesizing the above solutions.
Title: Comprehensive GC-MS Method for Quantifying Volatile Fermentation Metabolites with High Fidelity
Materials: See "The Scientist's Toolkit" below. Sample Prep: Liquid-Liquid Extraction with dichloromethane (1:1 ratio, salt-out with NaCl). Concentrate 10x under gentle nitrogen stream. Derivatization: For acid-specific analysis, follow silylation protocol (Section 4.2). GC-MS Parameters:
- Inlet: 250°C, splitless mode (1 min), 1 µL injection.
- Column: Stabilwax-DA, 30 m × 0.25 mm × 0.25 µm.
- Oven Program: 40°C (5 min), 5°C/min to 240°C (10 min).
- Carrier Gas: He, constant flow 1.2 mL/min.
- Transfer Line: 250°C.
- MS Source: 230°C; Quadrupole: 150°C.
- Acquisition: EI at 70 eV, scan mode m/z 35-350.
Data Analysis: Use sequential processing: 1) Deconvolution (AMDIS), 2) Library search (NIST), 3) Quantification via calibration curves of pure standards.
Diagram 2: Integrated workflow for VOC analysis.
The Scientist's Toolkit: Essential Reagents & Materials
| Item | Function/Benefit | Example Brand/Type |
|---|---|---|
| Stabilwax-DA GC Column | Highly deactivated wax phase; resists phase bleed and minimizes tailing for acids and alcohols. | Restek (or equivalent) |
| MSTFA + 1% TMCS | Silylation derivatization reagent for converting polar -OH and -COOH groups to volatile TMS ethers/esters. | Pierce/Thermo Scientific |
| Deactivated Inlet Liners w/ Wool | Ensures complete vaporization and traps non-volatile residues, protecting the column. | Agilent Ultra Inert |
| Siltek-Coated Transfer Line | Deactivated metal surface prevents degradation of active compounds before MS detection. | Restek |
| Cryogenic Focuser/Modulator | Essential for GC×GC; traps and re-injects effluent from first to second column. | LECO, Zoex |
| NIST Mass Spectral Library | Reference library for identifying deconvoluted mass spectra of metabolites. | NIST 20 |
| Internal Standards (Deuterated) | For stable isotope dilution mass spectrometry (SIDMS) to correct for losses. | d5-Ethanol, d8-Toluene |
Maintaining System Sufficiency and Ensuring Reproducible Results
Thesis Context: This guide is framed within a broader thesis investigating the analysis of volatile metabolites produced during food and beverage fermentation using Gas Chromatography-Mass Spectrometry (GC-MS). Reproducibility in this context is paramount for validating fermentation profiles, detecting spoilage markers, and ensuring product consistency.
System suitability tests (SSTs) demonstrate that the chromatographic system is adequate for the intended analysis. In fermentation volatile analysis, this ensures accurate quantification of trace compounds like esters, alcohols, acids, and carbonyls against a complex matrix.
Key Quantitative Parameters for SST
The following parameters, routinely calculated from a standard test mixture, must fall within predefined limits prior to any sample batch analysis.
Table 1: Core System Suitability Parameters and Acceptance Criteria for Fermentation Volatile Analysis
| Parameter | Definition & Calculation | Acceptance Criteria (Example for a 30m mid-polar column) | Impact on Data |
|---|---|---|---|
| Retention Time (RT) Reproducibility | Standard Deviation (SD) of RT for an internal standard over consecutive injections. | RSD ≤ 0.5% over 5 injections | Ensures compound identification reliability. |
| Peak Area Reproducibility | RSD of peak area for a key quantitative standard. | RSD ≤ 5.0% over 5 injections | Critical for accurate quantification of metabolites. |
| Theoretical Plates (N) | N = 16 (tR/w)2 where tR is RT, w is peak width at base. | > 50,000 for a well-resolved peak (e.g., 2-Octanol) | Measures column efficiency and peak sharpness. |
| Tailing Factor (Tf) | Tf = w0.05 / 2f where w0.05 is width at 5% height, f is front half-width. | 0.9 ≤ Tf ≤ 1.5 | Indicates active site interactions; affects integration. |
| Signal-to-Noise (S/N) | S/N = 2H / h where H is peak height, h is peak-to-peak noise. | ≥ 10 for a low-level calibration standard (e.g., 10 ppb) | Determines limit of quantification (LOQ). |
| Separation Resolution (Rs) | Rs = 2(tR2 - tR1) / (w1 + w2) | Rs ≥ 1.5 for critical pair (e.g., isoamyl acetate / 2-methylbutanol) | Ensures baseline separation of co-eluting metabolites. |
Detailed Experimental Protocols
Protocol 3.1: Daily System Suitability Test for Fermentation Volatile Analysis
- Objective: Verify GC-MS performance before sample batch analysis.
- Materials: See "The Scientist's Toolkit" below.
- Method:
- Prepare a System Suitability Standard (SSS) containing a representative mix of volatiles (e.g., ethyl acetate, diacetyl, isoamyl alcohol, ethyl hexanoate, acetic acid) and an internal standard (e.g., 4-methyl-2-pentanol) in a synthetic broth matrix.
- Set GC-MS parameters: Inlet: 250°C (splittless); Oven: 40°C (hold 2 min), ramp 10°C/min to 250°C; Column: 30m x 0.25mm x 0.25μm PEG-based; Carrier: He, 1.2 mL/min constant flow; MS Transfer Line: 270°C; MS Source: 230°C; Quad: 150°C; Scan: m/z 35-300.
- Inject 1 μL of the SSS in triplicate.
- Process data to calculate all parameters in Table 1. The system is deemed suitable only if all criteria are met.
Protocol 3.2: Comprehensive Performance Qualification (PQ) - Monthly
- Objective: Assess long-term system stability, detector response linearity, and carryover.
- Method:
- Linearity: Inject a 5-point calibration curve (e.g., 0.1, 1, 10, 100, 1000 mg/L) of the SSS. Calculate R2 for each compound; accept if ≥ 0.995.
- Carryover: Run a blank solvent (e.g., water/ethanol 90:10) immediately after the highest calibration standard. No analyte peak should be > 0.1% of the previous peak area.
- Mass Accuracy & Spectral Purity: Using the SSS, verify that the mass accuracy of the tuning compound (e.g., PFK or FC43) is within ± 0.1 Da. Use the NIST library to confirm spectral match factors (> 800/1000) for standards.
Workflow and Logical Pathways
Diagram Title: GC-MS System Suitability and Sample Analysis Workflow
Diagram Title: Core Fermentation Pathways to Key Volatile Metabolites
The Scientist's Toolkit
Table 2: Essential Research Reagent Solutions for GC-MS of Fermentation Volatiles
| Item | Function in Analysis | Example Product/ Specification |
|---|---|---|
| Stable Isotope Labeled Internal Standards (SIL-IS) | Corrects for sample loss, matrix effects, and instrument variability during quantification. | d5-Ethyl Acetate, 13C2-Acetic Acid, dissolved in methanol or synthetic broth. |
| System Suitability Standard (SSS) Mix | Validates chromatographic resolution, retention time stability, and detector sensitivity. | Custom mix of 8-12 key fermentation volatiles at known ratios in suitable solvent. |
| Deactivated Liner & Wool | Provides homogeneous vaporization of liquid sample, minimizes decomposition of labile compounds. | 4mm ID, single taper, with ~1 mg deactivated glass wool. |
| Stable Stationary Phase Column | Separates complex mixture of polar and non-polar volatiles. | Polyethylene Glycol (WAX) or mid-polarity phase (e.g., DB-624, Stabilwax). |
| High Purity Calibration Gases | Ensures accurate mass assignment and consistent detector performance. | Ultra-high purity Helium (carrier) and Nitrogen/Zero Air (for CI, if used). |
| Sorbent Tubes / SPME Fibers | For headspace sampling; traps/enriches trace volatiles from fermentation headspace. | Tenax TA/Carbopack tubes or Divinylbenzene/Carboxen/PDMS fiber. |
| Tuning Standard | Calibrates MS detector mass axis and ensures optimal sensitivity. | Perfluorotributylamine (PFTBA) or similar, specific to instrument. |
Ensuring Accuracy: Method Validation and Comparative Analysis with Alternative Techniques
Within the context of a broader thesis on the GC-MS analysis of fermentation volatile metabolites in food and beverages, method validation is a critical, non-negotiable step. It establishes the scientific credibility of analytical data, ensuring that the developed method is fit for its intended purpose—whether for research, quality control, or regulatory submission. This technical guide provides an in-depth examination of the core validation parameters: linearity, limits of detection (LOD) and quantitation (LOQ), precision, accuracy, and robustness. These parameters form the foundation for reliable quantification of key analytes like esters, alcohols, organic acids, and carbonyls in complex matrices such as wine, beer, fermented dairy, and sourdough.
Core Validation Parameters: Theory and Application
Linearity and Range
Linearity evaluates the method's ability to produce results directly proportional to analyte concentration. The range is the interval between upper and lower concentration levels where linearity, precision, and accuracy are acceptable.
- Experimental Protocol: Prepare a minimum of five calibration standard solutions across the anticipated concentration range (e.g., 0.1-100 µg/mL for a target metabolite). Analyze in triplicate. Plot mean detector response (peak area) against concentration.
- Data Analysis: Perform ordinary least squares (OLS) or weighted least squares (WLS) regression. Key metrics include the correlation coefficient (r), coefficient of determination (r² > 0.990 is typically required), y-intercept, slope, and residual plots to assess homoscedasticity.
Table 1: Example Linearity Data for Ethyl Acetate in Beer Matrix
| Concentration (µg/mL) | Mean Peak Area (n=3) | Standard Deviation | % RSD |
|---|---|---|---|
| 0.5 | 12540 | 450 | 3.59 |
| 5.0 | 118500 | 3200 | 2.70 |
| 25.0 | 598200 | 15500 | 2.59 |
| 50.0 | 1,205,800 | 28900 | 2.40 |
| 100.0 | 2,410,500 | 52300 | 2.17 |
Regression Statistics: r² = 0.9987; Slope = 24050; y-Intercept = 1205.
Limits of Detection (LOD) and Quantitation (LOQ)
LOD is the lowest concentration yielding a detectable signal (S/N ≥ 3). LOQ is the lowest concentration that can be quantified with acceptable precision and accuracy (S/N ≥ 10).
- Experimental Protocol (Signal-to-Noise): Analyze progressively diluted standards. Measure the peak-to-peak noise (N) in a blank chromatogram near the analyte's retention time and the analyte signal height (S).
- Experimental Protocol (Standard Deviation of Response and Slope): Analyze at least 10 blank matrix samples. Calculate the standard deviation (σ) of the response. Use the slope (S) from the linearity study: LOD = 3.3σ/S; LOQ = 10σ/S.
Table 2: Calculated LOD and LOQ for Select Fermentation Metabolites
| Analyte | Matrix | LOD (µg/L) | LOQ (µg/L) | Basis of Calculation |
|---|---|---|---|---|
| Acetaldehyde | Wine | 1.5 | 4.5 | S/N (10:1 for LOQ) |
| Diacetyl | Beer | 0.8 | 2.5 | 3.3σ/S and 10σ/S |
| Ethyl Hexanoate | Distilled Spirit | 0.2 | 0.6 | S/N (3:1 and 10:1) |
| Lactic Acid* | Yogurt | 50.0 | 150.0 | 3.3σ/S and 10σ/S |
*Derivatized prior to GC-MS analysis.
Precision
Precision measures the closeness of agreement between a series of measurements under specified conditions. It is expressed as repeatability (intra-day) and intermediate precision (inter-day, inter-analyst, inter-instrument).
- Experimental Protocol (Repeatability): Prepare six replicates of a QC sample at low, mid, and high concentrations within the linear range. Analyze in one sequence by one analyst.
- Experimental Protocol (Intermediate Precision): Repeat the repeatability study on three different days, or using a different analyst/calibration curve.
- Data Analysis: Calculate the mean, standard deviation, and percent relative standard deviation (%RSD). For bioanalytical methods, %RSD ≤ 15% (20% at LOQ) is typically acceptable.
Accuracy (Recovery)
Accuracy expresses the closeness of agreement between the measured value and an accepted reference value. In method validation, it is typically assessed via spike/recovery experiments.
- Experimental Protocol: Spike a blank or known matrix with known concentrations of analyte at three levels (low, mid, high) covering the range. Analyze these samples (n=3-6 per level). Compare the measured concentration to the theoretical spiked concentration.
- Data Analysis: % Recovery = (Measured Concentration / Spiked Concentration) x 100. Target recovery ranges (e.g., 85-115%) are matrix and concentration-dependent.
Table 3: Accuracy and Precision Data for Isoamyl Alcohol in Sourdough Headspace
| Spiked Level (µg/g) | Mean Found (µg/g) | % Recovery | Repeatability (%RSD, n=6) | Intermediate Precision (%RSD, n=18) |
|---|---|---|---|---|
| 5.0 (Low) | 4.7 | 94.0 | 4.2 | 6.8 |
| 50.0 (Mid) | 52.1 | 104.2 | 2.8 | 4.5 |
| 200.0 (High) | 191.4 | 95.7 | 1.9 | 3.2 |
Robustness
Robustness is a measure of the method's reliability during normal but deliberate variations in method parameters. It identifies critical operational parameters.
- Experimental Protocol: Employ a Design of Experiments (DoE) approach, such as a Plackett-Burman or fractional factorial design, to test variations in key parameters:
- GC: Oven temperature ramp rate (± 2°C/min), inlet temperature (± 5°C), carrier gas flow rate (± 0.1 mL/min).
- MS: Ion source temperature (± 10°C), electron energy (± 5 eV).
- Sample Prep: Extraction time (± 10%), derivatization time/temperature (± 5%), solvent volume (± 5%).
- Data Analysis: Monitor the impact on critical results (e.g., retention time, peak area, resolution). Use statistical analysis (e.g., ANOVA, Pareto charts) to identify parameters with a significant effect.
Experimental Workflow for Validating a GC-MS Method for Volatile Metabolites
Diagram Title: GC-MS Method Validation Sequential Workflow
The Scientist's Toolkit: Research Reagent Solutions
Table 4: Essential Materials for GC-MS Analysis of Fermentation Metabolites
| Item | Function & Technical Note |
|---|---|
| Stable Isotope Labeled Internal Standards (SIL-IS) | e.g., d₅-Ethanol, ¹³C-Acetic Acid. Critical for compensating for matrix effects and losses during sample prep. Must be analyte-analogous but chromatographically resolvable. |
| SPME Fibers (e.g., DVB/CAR/PDMS) | For headspace sampling of volatiles. The triple-phase coating is optimal for a broad range of polar and non-polar metabolites from food/beverage headspace. |
| Derivatization Reagents (e.g., MSTFA, BSTFA) | For volatilizing non-volatile metabolites (e.g., organic acids, sugars). Silylation agents trimethylsilylate active hydrogens, making compounds amenable to GC. |
| Solid Phase Microextraction (SPME) Sampler | Automated system for high reproducibility in fiber exposure, absorption, and desorption into the GC inlet. |
| Restek Rxi-5Sil MS or Equivalent Column | 5% diphenyl / 95% dimethyl polysiloxane column. Industry standard for volatile metabolite separation, offering excellent inertness and stability. |
| Certified Calibration Standard Mixtures | Traceable, gravimetrically prepared mixes of target analytes (e.g., fused alcohol mix, organic acid mix) for constructing calibration curves. |
| Simulated/Blank Matrix | e.g., Synthetic wine, beer, or broth. Used for preparing calibration standards to match the matrix of authentic samples for accurate quantification. |
| Quality Control (QC) Pooled Sample | A homogeneous, representative real sample (e.g., pooled fermentation broth) used to monitor system suitability and long-term method performance. |
Logical Decision Pathway for Validation Acceptance
Diagram Title: Validation Parameter Acceptance Decision Tree
Within the rigorous framework of GC-MS analysis for fermentation volatile metabolites in food and beverages, the selection of an appropriate quantitative strategy is paramount. Accurate quantification is foundational for assessing fermentation dynamics, flavor profiling, and ensuring product consistency and safety. This technical guide provides an in-depth examination of two principal classes of internal standards—Stable Isotope Labeled (SIL) compounds and Structural Analogues—and their application in constructing robust standard curves.
Core Principles of Quantification in GC-MS
In Gas Chromatography-Mass Spectrometry (GC-MS), quantification relies on the relationship between the instrumental response (peak area or height) and the analyte concentration. The internal standard method is universally employed to correct for losses during sample preparation, matrix effects, and instrumental variability.
Internal Standard (IS): A known amount of a compound, added to the sample, blank, and calibration standards, that is similar to the analyte but distinguishable by the MS.
Internal Standards: Stable Isotope Labeled vs. Structural Analogues
Stable Isotope Labeled Internal Standards (SIL-IS)
These are chemically identical to the target analyte but enriched with heavier stable isotopes (e.g., ²H, ¹³C, ¹⁵N, ¹⁸O). They co-elute chromatographically but are distinguished by a higher mass-to-charge ratio (m/z) in the mass spectrometer.
Advantages:
- Nearly identical chemical and physical properties to the analyte.
- Co-elution ensures perfect compensation for matrix-induced ionization suppression/enhancement in the ion source.
- Correct for losses during all steps of sample preparation.
- Considered the gold standard for high-accuracy methods.
Disadvantages:
- High cost and sometimes limited commercial availability.
- Potential for isotopic exchange or label loss in certain chemical environments.
- Must ensure the labeled ions used for quantification are free from interference from the natural abundance ions of the unlabeled analyte.
Structural Analogue Internal Standards (SA-IS)
These are compounds with a molecular structure similar to the analyte but with a different molecular weight or fragmentation pattern. They have similar extraction and derivatization properties but different retention times.
Advantages:
- Generally more affordable and widely available.
- No risk of isotopic exchange.
- Useful when SIL-IS are prohibitively expensive or unavailable.
Disadvantages:
- Differences in chromatographic retention can lead to imperfect compensation for matrix effects occurring in the ion source.
- Slightly different chemical behavior during extraction or derivatization may introduce bias.
- Greater risk of being affected by interferences present in complex matrices like food and beverages.
Quantitative Data Comparison
Table 1: Comparative Analysis of Internal Standard Types for Fermentation Volatiles
| Feature | Stable Isotope Labeled (SIL) IS | Structural Analogue (SA) IS |
|---|---|---|
| Chemical Identity | Identical | Similar |
| Chromatographic Elution | Co-elutes with analyte | Similar, but separate retention time |
| Compensation for Matrix Effects | Excellent (in source & in GC) | Good (primarily in extraction) |
| Compensation for Extraction Loss | Excellent | Good to Very Good |
| Cost | Very High | Low to Moderate |
| Availability for Fermentation Metabolites | Limited, but growing | Generally good |
| Risk of Interference | Low (if m/z chosen carefully) | Moderate |
| Ideal Use Case | High-precision quantification, complex matrices, regulatory methods | Screening, method development, cost-sensitive projects |
Table 2: Example Performance Data in Beer Metabolite Analysis (Theoretical Recovery %)
| Analyte (Example) | Internal Standard Type | Spiked Concentration (ppb) | Measured Recovery (%) | Relative Standard Deviation (RSD, %) |
|---|---|---|---|---|
| Ethyl Acetate | None (External Cal) | 50 | 65 | 15 |
| Ethyl Acetate | SA-IS: Propyl Acetate | 50 | 92 | 8 |
| Ethyl Acetate | SIL-IS: Ethyl Acetate-d₅ | 50 | 99 | 3 |
| Isoamyl Alcohol | None (External Cal) | 100 | 70 | 18 |
| Isoamyl Alcohol | SA-IS: 3-Octanol | 100 | 88 | 10 |
| Isoamyl Alcohol | SIL-IS: Isoamyl Alcohol-d₆ | 100 | 101 | 4 |
Experimental Protocols
Protocol 1: Preparation of Calibration Curves with Internal Standards
Objective: To generate a linear standard curve for the quantification of volatile metabolites (e.g., acetaldehyde, diacetyl, ethyl esters) using GC-MS.
Materials: Pure analyte standards, selected Internal Standard (SIL or SA), appropriate solvent (e.g., ethanol, water, or simulated matrix), derivatizing agent (if required, e.g., O-(2,3,4,5,6-Pentafluorobenzyl)hydroxylamine for carbonyls).
Procedure:
- Stock Solutions: Prepare individual stock solutions (e.g., 1000 mg/L) of each analyte and the IS in a suitable solvent.
- Intermediate Mixture: Create an intermediate mixture containing all analytes at a mid-range concentration.
- Calibration Standards: Serially dilute the intermediate mixture with solvent (or a simulated matrix like synthetic wine/beer) to create at least 5-7 calibration levels spanning the expected concentration range (e.g., 0.1 - 100 mg/L).
- Internal Standard Addition: Add a constant, precise volume of the IS stock solution to each calibration standard, blank, and subsequent sample. This is critical.
- Sample Preparation: Treat calibration standards identically to samples: place in sealed headspace vials, possibly with salting-out (e.g., NaCl), and equilibrate at a controlled temperature.
- GC-MS Analysis: Inject using consistent Headspace-SPME or liquid injection parameters. Use Selective Ion Monitoring (SIM) for optimal sensitivity.
- Calculation: For each calibration level, calculate the Response Factor (RF) or Area Ratio:
Area Ratio = (Analyte Peak Area) / (IS Peak Area). Plot Area Ratio (y-axis) against Analyte Concentration (x-axis). Perform linear regression (y = mx + c). The coefficient of determination (R²) should be >0.995.
Protocol 2: Quantification of Unknown Samples
Procedure:
- Sample Fortification: To a precise aliquot of the unknown sample (e.g., wine, beer, fermenting broth), add the same precise volume of IS stock solution used in the calibration curve.
- Parallel Processing: Subject the fortified sample to the exact same preparation, derivatization (if any), and analytical conditions as the calibration standards.
- GC-MS Analysis & Calculation: Acquire the data in SIM mode. Calculate the Area Ratio for the analyte in the unknown sample.
- Concentration Determination: Use the linear equation from the calibration curve to back-calculate the analyte concentration:
Analyte Concentration = (Area Ratio - c) / m.
Visualization of Quantitative Strategies
Diagram Title: Internal Standard Method Workflow for GC-MS Quantification
Diagram Title: Accuracy Hierarchy of GC-MS Quantitative Strategies
The Scientist's Toolkit: Research Reagent Solutions
Table 3: Essential Materials for GC-MS Quantification of Fermentation Volatiles
| Item | Function & Rationale |
|---|---|
| Stable Isotope Labeled Standards(e.g., Acetaldehyde-d₄, Ethyl Acetate-d₅, Diacetyl-d₆) | Gold-standard internal standards for highest accuracy. Compensate for all procedural and matrix losses. |
| Structural Analogue Standards(e.g., 4-Methyl-2-pentanol, 3-Octanol, Ethyl Heptanoate) | Cost-effective IS alternatives where SIL-IS are unavailable. Should match analyte chemical class. |
| Pure Native Analyte Standards | For preparation of calibration curves. Purity must be certified (>98%). |
| SPME Fibers(e.g., DVB/CAR/PDMS, CAR/PDMS) | For headspace extraction and concentration of volatile compounds. Fiber selection is analyte-dependent. |
| Derivatizing Reagents(e.g., PFBHA, MSTFA) | Convert polar, non-volatile metabolites (e.g., acids, carbonyls) into volatile, thermally stable derivatives for GC analysis. |
| Matrix-Matching Solvent(e.g., Synthetic Wine/Beer, Ethanol/Water Blends) | For preparing calibration standards to mimic the sample matrix, reducing errors from differential volatility or matrix effects. |
| Internal Standard Spiking Solution | A ready-to-use, intermediate concentration solution of the IS in solvent for consistent, precise addition to all samples and standards. |
| Quality Control (QC) Materials(e.g., pooled sample, reference material) | Used to monitor method precision and accuracy across analytical batches. |
The choice between Stable Isotope Labeled and Structural Analogue internal standards is a critical decision point in developing a GC-MS quantitative method for fermentation volatiles. While SIL-IS provide superior accuracy and robustness, particularly in complex and variable food matrices, SA-IS offer a practical and cost-effective solution for many research applications. The construction of a matrix-matched standard curve, using a consistently applied internal standard, remains the non-negotiable foundation for reliable data. This approach directly supports the broader thesis of understanding metabolic pathways, optimizing fermentation processes, and ensuring the quality and authenticity of food and beverage products.
This whitepaper provides a comparative technical analysis of Gas Chromatography-Mass Spectrometry (GC-MS) and Gas Chromatography-Ion Mobility Spectrometry (GC-IMS) within the specific research framework of profiling volatile metabolites produced during microbial fermentation in food and beverage science. The formation of volatile organic compounds (VOCs)—such as esters, alcohols, aldehydes, and acids—is critical for flavor, aroma, and quality. The choice between GC-MS and GC-IMS hinges on the fundamental trade-off between analytical sensitivity/compound identification (GC-MS) and rapid, high-throughput screening (GC-IMS), directly impacting experimental design in fermentation monitoring, strain selection, and process optimization.
Core Technology Comparison
Principle of Detection
- GC-MS: Compounds separated by GC are ionized (typically by Electron Ionization, EI) and fragmented in a high-vacuum chamber. Ions are separated by their mass-to-charge ratio (m/z) in a quadrupole or time-of-flight (TOF) mass analyzer, yielding a mass spectrum.
- GC-IMS: Compounds separated by GC are ionized (typically by a soft, atmospheric-pressure chemical ionization, APCI) forming molecular ions or protonated monomers/dimers. These are injected into a drift tube filled with an inert gas. Ions are separated based on their collision cross-section (CCS) and mobility under a weak electric field, measured as drift time.
Table 1: Key Technical Specifications and Performance Metrics
| Parameter | GC-MS (Quadrupole) | GC-MS (TOF) | GC-IMS |
|---|---|---|---|
| Detection Limit | Low ppt to ppb range | Mid ppq to ppt range | High ppb to low ppm range |
| Linear Dynamic Range | 10^4 - 10^5 | 10^4 - 10^5 | 10^2 - 10^3 |
| Analytical Run Time | 15 - 60 minutes | 10 - 45 minutes | 3 - 15 minutes |
| Identification Basis | Fragmentation pattern (EI spectrum) & Retention Index (RI) | Exact mass & RI | Reduced Ion Mobility (RIP-relative) & RI |
| Library Matching | Extensive commercial libraries (NIST, Wiley) | Accurate mass & spectral libraries | Limited, instrument-specific libraries |
| Quantitation Mode | Absolute (with standards), Semi-quantitative (relative) | Absolute & Semi-quantitative | Primarily comparative (fingerprinting) |
| Data Dimensionality | 2D (Retention Time, m/z) | 2D (RT, m/z) | 3D (RT, Drift Time, Intensity) |
| Throughput (Samples/Day) | Moderate (10-30) | Moderate-High (20-40) | High (50-100+) |
| Operational Environment | High vacuum required | High vacuum required | Ambient pressure |
Experimental Protocols for Fermentation VOC Analysis
Protocol A: Targeted Quantification of Key Fermentation Esters via GC-MS
Objective: Absolute quantification of specific ester metabolites (e.g., ethyl acetate, isoamyl acetate) in beer.
- Sample Preparation: Headspace Solid-Phase Microextraction (HS-SPME). 5 mL of degassed beer + 1.5 g NaCl in 20 mL vial. Internal standard (e.g., 4-methyl-2-pentanol, 50 µL of 100 mg/L) added. Equilibrate at 40°C for 10 min with agitation.
- Extraction: Expose a 50/30 µm DVB/CAR/PDMS SPME fiber to sample headspace for 30 min at 40°C.
- GC-MS Analysis:
- GC: Inlet 250°C, splitless mode. Column: Equity-1 (60 m x 0.25 mm, 1.0 µm). Oven: 40°C (hold 5 min), ramp 10°C/min to 240°C (hold 5 min). Carrier: He, 1.2 mL/min.
- MS: EI source 230°C, quadrupole 150°C. Acquisition: Selected Ion Monitoring (SIM) mode for target ester and internal standard ions.
- Quantification: Build 5-point calibration curve using authentic standards in a synthetic beer matrix.
Protocol B: Non-Targeted Fingerprinting of Fermentation Progression via GC-IMS
Objective: Rapid, high-throughput monitoring of global VOC profile changes during lactic acid fermentation in yogurt.
- Sample Preparation: Minimal headspace sampling. 1 mL of fermenting milk/yogurt placed into a 20 mL headspace vial. Incubate at 40°C for 10 min in autosampler agitator.
- GC-IMS Analysis:
- GC: Inlet 80°C, splitless. Column: FS-SE-54-CB (15 m x 0.53 mm). Oven: 40°C isothermal for 2 min, ramp 10°C/min to 100°C.
- IMS: Drift tube temp: 45°C. Drift gas: N2, flow 150 mL/min. Ionization: Tritium (³H) source.
- Data Acquisition: Direct headspace injection (500 µL) via heated syringe. Total run time: 10 min.
- Data Analysis: Use instrument software for topographic plot comparison, PCA, or gallery plot analysis to visualize VOC pattern changes over time.
Visualization of Workflows
Diagram 1: Comparative GC-MS and GC-IMS Analytical Workflow
Diagram 2: Decision Logic: GC-MS vs. GC-IMS Selection
The Scientist's Toolkit: Research Reagent Solutions
Table 2: Essential Materials for Fermentation VOC Profiling Experiments
| Item | Function & Specification | Typical Use Case |
|---|---|---|
| SPME Fiber Assembly | Adsorptive extraction of VOCs from sample headspace. Common coatings: DVB/CAR/PDMS for broad range, CAR/PDMS for volatiles. | Sample pre-concentration for GC-MS to achieve low detection limits. |
| Internal Standard Mix | Deuterated or chemically similar compounds not found in samples (e.g., d5-toluene, 4-methyl-2-pentanol). Added pre-extraction. | Corrects for variability in sample prep, injection, and ionization for quantitative GC-MS. |
| Alkanes Standard Solution (C7-C30) | Provides reference retention times in non-polar GC columns. | Calculation of Retention Index (RI) for compound identification in both GC-MS and GC-IMS. |
| NIST/Web EI Mass Spectral Library | Reference database of over 300,000 electron ionization mass spectra. | Essential for confident identification of unknown compounds separated by GC-MS. |
| VOC Calibration Mix | Certified reference material containing target analytes at known concentrations in suitable solvent. | Generation of calibration curves for absolute quantification via GC-MS. |
| IMS Reactant Gas | Ultra-pure nitrogen or synthetic air, often requiring specific filtration (hydrocarbon traps). | Forms the drift gas and reactant ion cluster (RIP) in GC-IMS, critical for stability. |
| Headspace Vials & Septa | Chemically inert, airtight glass vials with PTFE/silicone septa. | Standardized containment for volatile samples during incubation and injection. |
| Quality Control Pooled Sample | A homogeneous, stable sample representative of the test matrix. | Run intermittently to monitor instrument performance drift in long GC-IMS fingerprinting studies. |
Within the broader context of a thesis on GC-MS analysis of fermentation volatile metabolites in food and beverages, this technical guide explores the synergistic application of Gas Chromatography-Mass Spectrometry (GC-MS) and Gas Chromatography-Olfactometry (GC-O). These techniques are critical for bridging the gap between chemical composition and sensory perception, a central challenge in flavor, fragrance, and aroma research. While GC-MS provides precise compound identification and quantification, GC-O directly links these volatiles to human olfactory perception, identifying key aroma-active compounds.
Core Principles and Instrumentation
Gas Chromatography-Mass Spectrometry (GC-MS)
GC-MS separates volatile compounds via a chromatographic column followed by mass spectrometric detection. The mass spectrometer fragments molecules, generating a fingerprint (mass spectrum) for library matching and quantification.
Gas Chromatography-Olfactometry (GC-O)
GC-O utilizes the same chromatographic separation but incorporates a human assessor at an olfactometry port. The effluent is split between a chemical detector (e.g., FID) and a sniffing port. The assessor records perceived odors, their intensity, and duration, creating an "aromagram."
Quantitative Data Comparison
Table 1: Fundamental Comparison of GC-MS and GC-O
| Parameter | GC-MS | GC-O |
|---|---|---|
| Primary Output | Chemical identification & quantification (ng/µg) | Sensory detection & perceived intensity |
| Detector | Mass spectrometer (universal) | Human nose (selective) |
| Sensitivity | ppb to ppt for many compounds | Varies per compound & panelist; can be sub-ppt for potent odorants |
| Data Type | Objective, quantitative chemical data | Subjective, qualitative/quantitative sensory data |
| Key Metric | Peak area/concentration | Detection frequency, intensity (e.g., CHARM, AEDA values) |
| Throughput | High (automated) | Low (manual, human-limited) |
| Identifies | All volatile, GC-amenable compounds | Only aroma-active volatiles (odorants) |
| Role in Research | Comprehensive volatile profiling | Identification of key odorants contributing to overall aroma |
Table 2: Common GC-O Intensity Measurement Methods
| Method | Description | Output Metric |
|---|---|---|
| Detection Frequency (DF) | Frequency of odor detection across panelists. | DF %; higher % indicates greater importance. |
| Aroma Extract Dilution Analysis (AEDA) | Serial dilution of extract until odor is no longer perceived. | Flavor Dilution (FD) factor; higher FD = more potent odorant. |
| CHARM Analysis | Similar to AEDA but uses time-intensity recordings. | CHARM value; proportional to odor potency & quantity. |
| Posterior Intensity Method | Direct scoring of intensity at a single dilution. | Intensity (e.g., 0-10 scale). |
Detailed Experimental Protocols
Protocol 1: Integrated GC-MS/GC-O Analysis for Fermentation Volatiles
This protocol is central for linking metabolites to sensory impact.
1. Sample Preparation (Solid Phase Microextraction - SPME):
- Materials: Fermented beverage/food sample, DVB/CAR/PDMS fiber, headspace vials, internal standards (e.g., 2-octanol, 2-methyl-3-heptanone).
- Procedure: Place 5-10 mL/g sample in a 20 mL headspace vial. Add internal standard. Equilibrate at 40°C for 10 min with agitation. Expose SPME fiber to the headspace for 30 min at 40°C for analyte absorption.
2. GC-MS Analysis:
- Injection: Desorb fiber in GC inlet (250°C, splitless mode, 5 min).
- GC Parameters: Capillary column (e.g., DB-WAX, 60m x 0.25mm x 0.25µm). Oven program: 40°C (hold 5 min), ramp at 5°C/min to 240°C (hold 10 min). Helium carrier gas, constant flow 1.2 mL/min.
- MS Parameters: Transfer line 250°C, ion source 230°C, quadrupole 150°C. Full scan mode (m/z 35-350). Use NIST/Wiley libraries and linear retention indices (LRI) for identification.
3. GC-O Analysis:
- Instrument Setup: Install effluent splitter at column outlet. Typical split ratio: 1:1 to MSD and olfactory port. Olfactory port is a heated (typically 200-250°C) deactivated glass or metal transfer line ending in a glass nose cone.
- Human Panel: Use 4-8 trained panelists. Ensure informed consent and a chemical-free environment.
- Procedure: Panelist sniffs the effluent and records the time (or retention index) of any detected odor, a descriptor (e.g., "fruity," "sulfurous"), and its intensity (e.g., on a 0-10 scale). Each panelist typically evaluates the sample in multiple short sessions (<30 min) to prevent fatigue.
4. Data Integration:
- Align MS chromatograms and aromagrams using retention times/indices. Overlay plots to pinpoint which chemical peaks correspond to aroma activity.
Protocol 2: Aroma Extract Dilution Analysis (AEDA)
This protocol ranks odorants by potency.
Procedure:
- Prepare a concentrated volatile extract (via SAFE distillation, SPME, or solvent extraction).
- Make a series of 1:2 or 1:3 dilutions (e.g., original, 1:2, 1:4, 1:8...).
- Analyze each dilution via GC-O with a trained panelist.
- Record the last dilution at which an odor is detected. The Flavor Dilution (FD) factor is the dilution factor of that last detection (e.g., detected at 1:32 dilution, FD = 32).
- Higher FD factors indicate greater aroma potency.
Visualizing the Workflow and Data Integration
Title: Integrated GC-MS and GC-O Analysis Workflow
Title: Logic for Identifying Key Aroma Compounds
The Scientist's Toolkit: Essential Research Reagents & Materials
Table 3: Key Reagents and Materials for GC-MS/O Analysis of Fermentation Volatiles
| Item | Function/Benefit | Example/Notes |
|---|---|---|
| Stable Isotope Dilution Assay (SIDA) Standards | Enables accurate, matrix-effect-free quantification for OAV calculation. | Deuterated (d3, d5) analogs of target odorants (e.g., d3-ethyl butyrate). |
| Internal Standards (Non-Odor Active) | Corrects for injection and sample prep variability in GC-MS. | 2-Octanol, 2-Methyl-3-heptanone, alkane series for LRI calculation. |
| SPME Fibers | Headspace micro-extraction; minimizes artifact formation. | Divinylbenzene/Carboxen/Polydimethylsiloxane (DVB/CAR/PDMS) for broad range. |
| SAFE Apparatus | Solvent Assisted Flavor Evaporation; gentle isolation of volatiles from complex matrices. | Critical for preparing representative aroma extracts for AEDA. |
| GC Columns of Different Polarity | Confirmation of compound identity via dual-LRI matching. | Polar (e.g., DB-WAX) and non-polar (e.g., DB-5) stationary phases. |
| Odor Threshold Databases/References | Required for calculating Odor Activity Values (OAVs). | Compiled literature values in water, air, or specific food matrices. |
| Deactivated GC-O Transfer Line & Nose Cone | Prevents adsorption of polar odorants and thermal degradation. | Ensures all separated compounds reach the assessor. |
In the study of fermentation in food and beverages, volatile organic compounds (VOCs) are critical markers of microbial activity, metabolic pathways, and final product quality. The volatilome—the complete set of VOCs produced by a biological system—offers a dynamic, real-time snapshot of ongoing biochemical processes. Gas Chromatography-Mass Spectrometry (GC-MS) is the cornerstone analytical platform for volatilome characterization due to its superior sensitivity, resolution, and robust spectral libraries. This whitepaper details the technical integration of GC-MS-derived volatilome data with broader metabolomics and microbiome studies, framed within a thesis on fermented food and beverage research. This integrative omics approach moves beyond correlation to establish mechanistic causality between microbial taxa, their metabolic functions, and the volatile profile that defines aroma, flavor, and safety.
Core Analytical Platform: Fundamentals of GC-MS in Volatilomics
2.1 Instrumentation & Workflow GC-MS analysis of volatiles involves: 1) Sample Preparation & Extraction: Using Headspace-Solid Phase Microextraction (HS-SPME) or Stir Bar Sorptive Extraction (SBSE) for non-destructive concentration of VOCs. 2) Chromatographic Separation: Utilizing capillary columns (e.g., DB-5MS) to resolve complex mixtures. 3) Mass Spectrometric Detection: Electron Impact (EI) ionization at 70 eV generates reproducible fragmentation patterns searchable against reference libraries (NIST, Wiley). 4) Data Processing: Deconvolution, peak alignment, and compound identification/quantification using software like AMDIS, ChromaTOF, or MS-DIAL.
2.2 Key Advantages for Fermentation Studies
- High Sensitivity: Detects VOCs at parts-per-trillion (ppt) levels, crucial for trace aroma compounds.
- Quantitative Robustness: Enables absolute quantification using internal standards (e.g., deuterated compounds) for monitoring metabolite flux.
- Structural Elucidation: EI spectra allow identification of unknown compounds not in libraries.
Integrative Omics Framework: From Correlation to Causation
The power of GC-MS volatilomics is unlocked by integration with other omics layers.
3.1 Volatilome-Metabolome Integration Non-volatile metabolites (acids, sugars, amino acids) are precursors to volatile compounds. Combining GC-MS with LC-MS (for non-volatiles) provides a complete metabolic map.
- Protocol: Parallel Metabolite Extraction from a Single Fermentation Sample (e.g., Kimchi or Beer Wort)
- Homogenize 1g of sample in 2 mL of cold methanol:water (80:20, v/v) with 10 µL of internal standard mix (e.g., 2-Octanol for GC-MS, 13C6-Sorbitol for LC-MS).
- Vortex for 1 min, sonicate in ice bath for 10 min, incubate at -20°C for 1 hour to precipitate proteins.
- Centrifuge at 14,000 x g for 15 min at 4°C.
- For LC-MS (Polar Metabolome): Transfer 500 µL of supernatant to a new vial. Dry under nitrogen gas. Reconstitute in 100 µL of 0.1% formic acid in water for HILIC-LC-MS/MS analysis.
- For GC-MS (Volatilome): Use the remaining supernatant for HS-SPME. Transfer 1 mL to a 20 mL headspace vial. Add 0.3 g NaCl and a magnetic stir bar. Seal and incubate at 60°C with agitation for 10 min. Expose a 50/30 µm DVB/CAR/PDMS SPME fiber to the headspace for 30 min for automated GC-MS analysis.
3.2 Volatilome-Microbiome Integration Linking specific VOCs to microbial producers requires correlating GC-MS data with 16S rRNA (bacteria) or ITS (fungi) sequencing data, often followed by in vitro validation using microbial isolates.
- Protocol: Integrated Sampling for Microbiome and Volatilome Analysis
- Aseptically collect a representative fermentation sample (e.g., sourdough starter, cheese).
- For Microbiome: Aliquot 0.5g into a DNA/RNA Shield tube. Store at -80°C until DNA extraction using a kit like the DNeasy PowerLyzer Microbial Kit.
- For Volatilome: Simultaneously, aliquot 1g into a pre-weighed glass headspace vial containing 2 mL of saturated NaCl solution. Immediately cap with a PTFE/silicone septum. Store at 4°C and analyze via HS-SPME-GC-MS within 24 hours.
- Perform multivariate statistical integration (e.g., sparse Canonical Correlation Analysis, sCCA) to link specific OTUs/ASVs to VOC peaks.
Diagram Title: Multi-Omics Integration Workflow for Fermentation Research
Quantitative Data from Recent Studies
Table 1: Key Volatile Markers in Fermented Foods Identified by GC-MS
| Food/Beverage System | Key Volatile Compound(s) | Associated Microbial Taxa (from Microbiome) | Precursor Metabolite (from Metabolomics) | Typical Concentration Range |
|---|---|---|---|---|
| Sourdough | Ethyl acetate (fruity) | Lactobacillus sanfranciscensis, Saccharomyces cerevisiae | Carbohydrate fermentation (Acetyl-CoA) | 5 - 50 mg/kg |
| 3-Methyl-1-butanol (malty) | Leuconostoc citreum | Leucine catabolism | 0.1 - 2 mg/kg | |
| Saké | Isoamyl acetate (banana) | Saccharomyces cerevisiae (K7 yeast) | α-Ketoisocaproate from Valine/Isoleucine | 0.5 - 15 ppm |
| Ethyl hexanoate (apple) | Saccharomyces cerevisiae | Lipid metabolism (Hexanoic acid) | 0.05 - 3 ppm | |
| Kombucha | Acetic acid (vinegar) | Komagataeibacter spp. (AAB) | Ethanol oxidation | 2 - 10 g/L |
| Dodecanal (citrus) | Yeast consortia (Brettanomyces) | Fatty acid oxidation | 10 - 200 µg/L | |
| Cheddar Cheese | Diacetyl (buttery) | Lactococcus lactis ssp. lactis | Citrate metabolism | 0.5 - 5 mg/kg |
| Methanethiol (sulfurous) | Brevibacterium linens | Methionine degradation | 0.01 - 0.5 mg/kg |
Table 2: Performance Metrics of Modern GC-MS Techniques in Volatilomics
| Technique | Detection Limit (Typical) | Linear Dynamic Range | Key Advantage for Integration | Throughput (Sample/Day) |
|---|---|---|---|---|
| HS-SPME-GC-MS | Low ppt - ppb | 10^3 - 10^4 | Simple, solvent-free, ideal for time-series | 20-40 |
| SBSE-GC-MS (Twister) | Sub-ppt - ppb | 10^4 - 10^5 | Higher sensitivity than SPME | 15-30 |
| GCxGC-TOFMS | ppb | 10^3 - 10^4 | Superior peak capacity for complex samples | 10-20 |
| PTR-TOF-MS | ppb - ppm | 10^4 | Real-time, in situ monitoring | 100+ |
The Scientist's Toolkit: Essential Research Reagent Solutions
Table 3: Key Materials and Reagents for Integrated Volatilome Studies
| Item | Function & Rationale | Example Product/Kit |
|---|---|---|
| Internal Standards (IS) for GC-MS | Corrects for extraction and ionization variability; enables absolute quantification. | Deuterated standards: d8-Toluene, d5-Ethyl Butyrate; 2-Octanol, 4-Methyl-2-pentanol. |
| SPME Fiber Assortment | Selective adsorption of different VOC chemical classes based on coating polarity. | Supelco DVB/CAR/PDMS (general), CAR/PDMS (small molecules), Polyacrylate (polar). |
| Derivatization Reagents | Increases volatility of polar metabolites (e.g., organic acids) for GC-MS analysis. | MSTFA (N-Methyl-N-(trimethylsilyl)trifluoroacetamide) for silylation. |
| Stable Isotope Tracers | Enables metabolic flux analysis to map precursor-to-VOC pathways. | 13C-Glucose, 15N-Amino acids for in vitro fermentation studies. |
| Anaerobic Culturing Media | Supports growth of strict anaerobes from fermented foods for ex vivo validation. | MRS Broth (for Lactobacillus), Reinforced Clostridial Medium (RCM). |
| DNA/RNA Preservation Buffer | Stabilizes microbial community snapshot at time of volatilome sampling. | Zymo Research DNA/RNA Shield, Qiagen RNAlater. |
| Metabolite Extraction Solvents | Quenches metabolism and extracts broad-spectrum polar/non-polar metabolites. | Cold (-20°C) Methanol:Water:Chloroform (2.5:1:1) for comprehensive metabolomics. |
GC-MS is an indispensable and central technology in modern omics, serving as the critical link that functionally connects microbial community structure (microbiome) with biochemical activity (metabolomics) through the high-fidelity measurement of the volatilome. In fermentation science, this integration enables researchers to deconstruct the complex interactions that define food and beverage quality, moving from observing "what is there" to understanding "how it got there." Future advancements in real-time GC-MS, higher-throughput automation, and more sophisticated multi-omics bioinformatics pipelines will further solidify this integrative approach as the standard for mechanistic research in microbial systems.
Conclusion
GC-MS analysis remains an indispensable and powerful tool for deciphering the complex volatile metabolome of fermented foods and beverages. By providing a detailed chemical blueprint, it bridges the gap between microbial activity, process parameters, and the final product's sensory and quality attributes. From foundational exploration to rigorous validation, a robust GC-MS workflow enables researchers to ensure authenticity, trace contamination, optimize fermentation processes, and innovate novel products. Future directions point towards increased automation, integration with real-time monitoring systems, and the application of advanced data science and machine learning for predictive modeling of flavor development and shelf-life stability. This analytical prowess is fundamental for advancing both traditional craftsmanship and modern, precision fermentation in the food, beverage, and biomedical sectors.