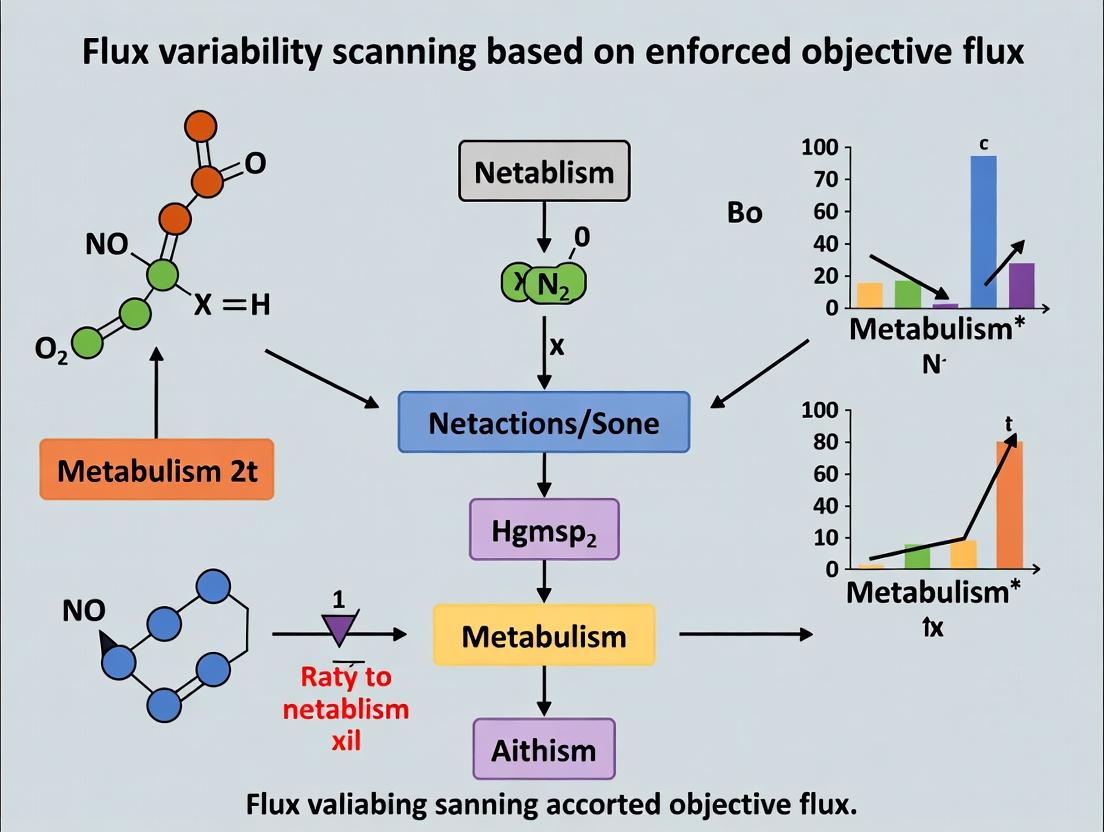
Flux Variability Scanning with Enforced Objective Flux (FVSEOF): A Comprehensive Guide for Metabolic Engineering and Drug Target Discovery
This article provides a detailed exploration of Flux Variability Scanning based on Enforced Objective Flux (FVSEOF), a pivotal computational framework in constraint-based metabolic modeling.
Flux Variability Scanning with Enforced Objective Flux (FVSEOF): A Comprehensive Guide for Metabolic Engineering and Drug Target Discovery
Abstract
This article provides a detailed exploration of Flux Variability Scanning based on Enforced Objective Flux (FVSEOF), a pivotal computational framework in constraint-based metabolic modeling. Tailored for researchers and drug development professionals, we cover the foundational concepts of metabolic flux analysis and the limitations of traditional FVA, leading to the rationale for FVSEOF. We then detail its methodological workflow, from setting flux enforcement constraints to interpreting gene target rankings, with practical application examples in strain optimization. The guide addresses common troubleshooting and optimization challenges, including network gaps and computational scaling. Finally, we validate FVSEOF by comparing its predictive performance against alternative algorithms like OptKnock and GDLS, and discuss its integration with omics data for robust in silico strain design. This synthesis aims to empower scientists to effectively leverage FVSEOF for identifying high-value metabolic engineering and therapeutic targets.
What is FVSEOF? Understanding the Core Principles and Evolution from Traditional FVA
Defining Constraint-Based Reconstruction and Analysis (COBRA) and Flux Balance Analysis (FBA)
Technical Support & Troubleshooting Center
FAQ Section
Q1: After performing Flux Balance Analysis (FBA) on my metabolic model, I obtain a single optimal flux distribution. How do I account for flux variability, especially within the context of Flux Variability Scanning based on Enforced Objective Flux (FVA-EOF) research?
A: A single FBA solution represents one point in a high-dimensional solution space. To analyze variability, you must perform Flux Variability Analysis (FVA). For FVA-EOF, you iteratively enforce the objective function value at a fraction of its maximum and then perform FVA at each step. Common issues are infeasible solutions when enforcing the objective flux. Ensure your enforced value is thermodynamically and stoichiometrically feasible. Check reaction reversibilities and growth medium constraints.
Q2: My COBRA model simulation returns an infeasible solution error. What are the primary checks I should perform?
A: Follow this troubleshooting protocol:
- Check Model Consistency: Use
checkMassChargeBalanceandcheckObjectivefunctions. - Verify ATP Maintenance: An incorrectly set ATP maintenance reaction (
ATPM) requirement is a common culprit. Confirm its bounds are biologically realistic. - Review Medium Constraints: Ensure exchange reaction bounds for carbon, oxygen, and nitrogen sources are correctly opened (
lowerBound < 0for uptake). - Identify Blocked Reactions: Use
findBlockedReactionto pinpoint reactions that cannot carry flux due to network gaps.
Q3: During FVA-EOF scanning, I observe abrupt discontinuities in the range of allowable fluxes for a reaction of interest. What does this indicate and how should I proceed?
A: Discontinuities often signal a shift in the optimal use of parallel pathways or loops. This is a key insight in FVA-EOF research, revealing regulatory points. To diagnose:
- Map the Flux Envelope: Plot minimum and maximum flux for key reactions across the enforced objective range.
- Analyze Pathway Usage: At points before and after the discontinuity, extract the flux distributions and compare active pathways using flux sum analysis.
- Inspect Model Constraints: The discontinuity may be caused by hitting a hard constraint (e.g., uptake limit). Review variable bounds at the scanning point.
Q4: When implementing FVA-EOF protocols, computational time becomes prohibitive for large genome-scale models. What optimization strategies are recommended?
A: Implement the following:
- Use Parsimonious FBA (pFBA): As a preprocessing step to identify a thermodynamically feasible, low enzyme-cost solution space before FVA.
- Employ Linear Programming (LP) Solvers: Utilize efficient, pre-compiled solvers like GLPK, GUROBI, or CPLEX. Ensure your COBRA toolbox is properly linked to them.
- Apply Sampling: For initial exploratory scans, use Markov Chain Monte Carlo (MCMC) sampling of the solution space at a few key enforced flux points instead of full FVA at every point.
- Constrain the Problem: Reduce the search space by fixing the fluxes of well-characterized, high-confidence reactions based on experimental data.
Key Experimental Protocols
Protocol 1: Standard Flux Balance Analysis (FBA)
Objective: To predict an optimal steady-state metabolic flux distribution that maximizes or minimizes a defined biological objective (e.g., biomass yield).
Methodology:
- Load Model: Import a genome-scale metabolic reconstruction (in SBML format) into a COBRA-compatible environment (e.g., MATLAB COBRA Toolbox, Python COBRApy).
- Define Constraints: Set the constraints vector b.
- Apply reaction directionality (lowerBound
lb, upperBoundub). - Define nutrient availability by setting
lbof specific exchange reactions.
- Apply reaction directionality (lowerBound
- Set Objective: Designate the objective function vector c (e.g., biomass reaction).
- Solve the Linear Programming Problem: Maximize Z = cᵀv subject to S∙v = 0 and lb ≤ v ≤ ub, where S is the stoichiometric matrix and v is the flux vector.
- Extract Solution: The output is the optimal flux for every reaction in the network.
Protocol 2: Flux Variability Scanning based on Enforced Objective Flux (FVA-EOF)
Objective: To systematically map the range of possible fluxes (variability) for all network reactions as the optimal objective flux is enforced at sub-maximal levels.
Methodology:
- Perform Initial FBA: Calculate the maximum theoretical objective flux (e.g., growth rate,
μ_max). - Define Scanning Range: Create a vector of enforced objective flux values from a minimal value (e.g., 0.05·
μ_max) toμ_max. - Iterative Loop: For each enforced objective value (
μ_enforced): a. Fix Objective Flux: Add a constraint that sets the objective reaction flux equal toμ_enforced. b. Perform FVA: For each reactioniin the model, solve two LP problems: * Minimizev_isubject toS∙v = 0,lb ≤ v ≤ ub, andv_objective = μ_enforced. * Maximizev_iunder the same constraints. c. Store Results: Record the calculated minimum (minFlux_i) and maximum (maxFlux_i) for each reaction. - Analysis: Compile results to visualize the flux variability envelope of key reactions across the enforced objective spectrum.
Data Presentation
Table 1: Comparison of Key Constraint-Based Methodologies
| Method | Primary Objective | Core Equation/Constraint | Key Output | Application in FVA-EOF Research |
|---|---|---|---|---|
| Flux Balance Analysis (FBA) | Find optimal flux distribution. | Maximize cᵀv, s.t. S∙v=0, lb≤v≤ub | Single flux vector maximizing objective. | Determines the reference μ_max to define the scanning range. |
| Flux Variability Analysis (FVA) | Determine flux ranges for all reactions. | Min/Max v_i, s.t. S∙v=0, lb≤v≤ub, cᵀv ≥ α·Z_opt |
Min and max flux for each reaction at optimal (α=1) or sub-optimal growth. | Core computational routine executed at each enforced flux point. |
| Parsimonious FBA (pFBA) | Find optimal flux distribution with minimal total enzyme usage. | Minimize ∑|v|, s.t. S∙v=0, lb≤v≤ub, cᵀv = Z_opt | A unique, enzymatically efficient flux distribution. | Used to reduce solution space and accelerate FVA-EOF scanning. |
| FVA-EOF | Map solution space structure versus objective capacity. | Perform FVA at each point where v_objective = μ_enforced |
Flux variability envelopes across the objective spectrum. | Primary method for identifying phases and critical points in network utilization. |
Visualizations
Title: Flux Balance Analysis (FBA) Core Workflow
Title: FVA-EOF Iterative Scanning Protocol
The Scientist's Toolkit: Research Reagent & Software Solutions
| Item | Function/Benefit | Example/Tool |
|---|---|---|
| COBRA Software Suite | Provides the core computational environment for building, simulating, and analyzing constraint-based models. | COBRA Toolbox (MATLAB), COBRApy (Python), RAVEN Toolbox. |
| Linear Programming Solver | High-performance optimization engine required to solve the LP problems at the heart of FBA/FVA. | Gurobi, CPLEX, GLPK. |
| Standard Metabolic Model | A curated, genome-scale reconstruction used as a starting point for hypothesis testing. | E. coli iJO1366, Human Recon 3D, Yeast 8. |
| SBML File | The standard (Systems Biology Markup Language) format for exchanging and loading metabolic models. | An .xml file containing reactions, metabolites, and constraints. |
| Isotope-Labeled Substrates | Used in companion experiments (e.g., 13C-MFA) to validate model predictions and constrain fluxes. | [1-13C]Glucose, [U-13C]Glutamine. |
| Flux Sampling Algorithm | Enables statistical exploration of the solution space when unique solutions are not found. | optGpSampler, ACME. |
| Visualization Package | For creating informative plots of flux distributions and variability envelopes. | matplotlib (Python), ggplot2 (R), Escher map viewer. |
Troubleshooting Guides & FAQs
Q1: After running Flux Balance Analysis (FBA), I have a single optimal growth rate. Why does my model still fail to predict experimentally observed metabolite secretion patterns?
A: A single FBA solution identifies one optimal flux distribution, but your metabolic network is likely underdetermined, meaning multiple flux distributions can achieve the same optimal objective (e.g., growth). The model may be choosing a solution that doesn't secrete Metabolite X, while another, equally optimal solution does. This is a key limitation of single-point solutions. Solution: Perform Flux Variability Analysis (FVA) to determine the full range (min/max) of possible fluxes for each reaction at the optimal objective value. You will likely find that the secretion reaction for Metabolite X has a non-zero maximum flux, indicating the capability is present in the model's solution space.
Q2: How do I interpret FVA results where the feasible flux range for a critical reaction is extremely wide (e.g., 0 to 1000 mmol/gDW/h)?
A: A wide flux range indicates that the reaction is poorly constrained in your model under the given conditions. This "flexibility" highlights a major limitation of relying on a single optimal flux value. Potential causes and checks:
- Missing Thermodynamic Constraints: Ensure reactions are irreversible where biologically required.
- Absence of Regulatory Rules: The model lacks known transcriptional or allosteric regulation.
- Gap in Experimental Data: No measured exchange, uptake, or secretion rate is constraining the associated pathways.
- Solution: Incorporate additional constraints (e.g.,
model.reactions.RXN.lower_bound = 0.5) based on literature or 'omics data to reduce variability and yield more physiologically relevant flux ranges.
Q3: When implementing Flux Variability Scanning based on Enforced Objective Flux (FVA-EOF), my solver status is "infeasible." What are the common causes?
A: Infeasibility occurs when the enforced objective flux (EOF) value is impossible for the model to achieve. Follow this checklist:
| Check | Action | Example Command/Note |
|---|---|---|
| 1. Max Objective Capability | Run FBA to find the model's theoretical maximum objective flux (e.g., max_growth). |
solution = model.optimize() |
| 2. Valid EOF Range | Ensure your enforced flux is between 0 and max_growth. Values >max_growth cause infeasibility. |
if enforced_flux > solution.fluxes.Biomass: print("Error") |
| 3. Model Constraints | Review all custom bounds (lower_bound, upper_bound). An overly restrictive bound elsewhere may conflict with the EOF. |
print(model.reactions.EX_glc__D_e.bounds) |
| 4. Numerical Precision | Solvers have tolerance settings. If enforcing a flux very close to the maximum, add a small buffer (e.g., 99% of max). | enforced_flux = max_growth * 0.99 |
Q4: What is the practical difference between Classic FVA and FVA-EOF in the context of drug target discovery?
A: This distinction is central to the thesis on flux variability scanning.
- Classic FVA: Computes flux ranges at the global optimum. It identifies reactions essential for peak function (narrow range around zero). However, it may miss reactions essential for sub-optimal but viable growth states, which pathogens often utilize.
- FVA-EOF (Flux Variability Scanning): Systematically enforces a series of sub-optimal objective fluxes (e.g., 90%, 80%, ... of max growth) and performs FVA at each level. This reveals reactions that become critical (i.e., have strictly required fluxes) when the cell is under stress or drug inhibition, uncovering conditional essentiality and more robust therapeutic targets.
Table: Comparison of FVA Approaches for Target Identification
| Feature | Classic FVA | FVA-EOF (Flux Variability Scanning) |
|---|---|---|
| Objective State | Global optimum only | Scans a range of sub-optimal states |
| Identifies | Absolute essential reactions | Conditionally essential reactions |
| Drug Target Relevance | Targets for maximum growth | Targets for resilient, adaptive networks |
| Computational Cost | Lower | Higher (multiple FVA runs) |
| Interpretation | "What must the cell do at its best?" | "What must the cell do to survive at 70% fitness?" |
Detailed Experimental Protocol: Flux Variability Scanning based on Enforced Objective Flux
Objective: To identify conditionally essential reactions across a spectrum of cellular fitness states.
Materials: See "Research Reagent Solutions" below.
Methodology:
- Model Preparation: Load a genome-scale metabolic model (GEM). Set environmental constraints (e.g., carbon source, oxygen).
- Determine Baseline: Perform FBA to calculate the maximum theoretical growth rate (μ_max).
- Define Scanning Range: Create a vector of objective flux values to enforce. Example:
enforced_fluxes = [μ_max, 0.9*μ_max, 0.8*μ_max, ..., 0.1*μ_max]. - Iterative FVA Loop:
a. For each
efinenforced_fluxes: b. Add a constraint to fix the biomass objective function reaction's flux toef. c. Perform FVA to compute the minimum and maximum possible flux for every reaction in the model under this enforced sub-optimal growth state. d. Store the min/max flux matrices. - Analysis of Results: a. For each reaction, analyze how its feasible flux range changes across the scanned objective values. b. Identify conditionally essential reactions: those whose min and max flux converge to a non-zero value (i.e., become required) at a specific sub-optimal growth level. c. Plot flux variability profiles for key candidate reactions.
Visualizations
Flux Variability Scanning (FVA-EOF) Workflow
Limitations of FBA vs. Capabilities of FVA
The Scientist's Toolkit: Research Reagent Solutions
| Item | Function in FVA-EOF Research | Example/Note |
|---|---|---|
| Genome-Scale Model (GEM) | The in silico representation of metabolism. The core "reagent" for all simulations. | Recon, iJO1366, Human1. Use community-curated models. |
| Constraint-Based Modeling Suite | Software environment to load models, run FBA/FVA, and implement scanning loops. | COBRApy (Python), COBRA Toolbox (MATLAB). |
| Linear Programming (LP) Solver | Computational engine that performs the optimization calculations. | Gurobi, CPLEX, GLPK. Critical for speed in large scanning studies. |
| Enforced Objective Flux Vector | The predefined series of sub-optimal growth rates to scan. Defined by the researcher. | e.g., numpy.linspace(max_growth, 0.1*max_growth, 10) in Python. |
| Flux Variability Analysis (FVA) Script | Custom code to iteratively constrain the model and run FVA at each enforced flux. | Typically loops model.solver = 'gurobi' and cobra.flux_analysis.flux_variability_analysis. |
| Data Visualization Library | To plot flux ranges, identify convergence points, and create publication-quality figures. | matplotlib (Python), ggplot2 (R). Essential for interpreting results. |
Troubleshooting Guides & FAQs
Q1: The FVSEOF algorithm fails to converge or returns an empty set of candidate reactions. What are the primary causes? A1: This is typically due to infeasible constraints or conflicting objectives. First, verify that your enforced objective flux value is thermodynamically and stoichiometrically achievable within the model. Run a basic Flux Balance Analysis (FBA) with the same objective to check the maximum theoretical flux. If the enforced value is higher, the problem is infeasible. Second, ensure the coupling between growth (or the main objective) and the target product is correctly defined. Relaxing the enforced flux value in incremental steps can help identify a feasible range.
Q2: How do I interpret variability in the flux envelopes for the scanned reactions? A2: A wide flux envelope for a specific reaction at a given objective enforcement level indicates high flexibility, meaning it may not be a good candidate for genetic manipulation. A narrow envelope, especially one that consistently correlates with increasing product flux, suggests a strong coupling and a high-value target. Reactions whose minimum or maximum flux bounds shift directionally (e.g., lower bound increases) are prime candidates.
Q3: My FVSEOF results suggest gene knockouts that are known to be lethal. How is this handled? A3: The basic FVSEOF algorithm does not inherently incorporate essentiality checks. You must post-process the candidate list. Compare your candidates against a pre-computed list of essential genes (from single-gene deletion analysis) for your model under the specified growth condition. Candidates appearing on the essential gene list should be deprioritized or considered for modulation (e.g., knockdown via promoters) rather than complete knockout.
Q4: What are the common pitfalls when integrating FVSEOF results with laboratory strain engineering? A4: The main pitfalls are:
- Ignoring Thermodynamics: FVSEOF is constraint-based; always check the thermodynamic feasibility (e.g., using loopless constraints or Gibbs free energy estimates) of suggested flux directions.
- Lack of Kinetic Considerations: The algorithm assumes optimal enzyme efficiency. In reality, enzyme saturation and regulation may prevent achieving predicted fluxes.
- Genetic Context: Success in a model organism (e.g., E. coli) may not translate directly to a production host (e.g., yeast) due to different regulatory networks.
Experimental Protocol: FVSEOF for Succinate Overproduction inE. coli
1. Prerequisite Model Preparation:
- Obtain a genome-scale metabolic model (e.g., iML1515 for E. coli).
- Set the appropriate medium constraints (e.g., aerobic/anaerobic, carbon source).
- Define the biomass reaction as the primary objective for FVA.
- Define the target reaction (e.g., SUCCt2_2, succinate transport) as the enforced objective.
2. FVSEOF Execution:
- Step 1: Perform a reference FBA to obtain the maximum theoretical succinate flux (Obj_max).
- Step 2: Define a series of enforced objective flux levels (Si) from 0 to Objmax (e.g., 0, 0.1Obj_max, 0.2Objmax, ..., Objmax).
- Step 3: For each level Si, solve the following optimization problem twice for every reaction
jin the model:- Maximize: vj
- Subject to:
- S * v = 0 (Steady-state mass balance)
- LB ≤ v ≤ UB (Reaction bounds)
- Z = Z_opt (Maintain optimal biomass at ≥ X% of its max, typically 90-99%)
- vtarget = Si (Enforce the succinate production flux)
- Step 4: Record the resulting minimum (vjmin) and maximum (vjmax) flux for each reaction at each enforcement level S_i.
3. Data Analysis & Candidate Identification:
- For each reaction, plot its flux envelope (vjmin to vjmax) against the enforced objective flux (S_i).
- Select candidate reactions where the minimum flux shows a clear positive/negative correlation with S_i, or the flux range becomes narrow and non-zero.
4. In Silico Validation:
- Perform single- or double-gene knockout simulations on candidate reactions while constraining the target flux (succinate) at a high level to validate their impact.
Research Reagent Solutions Toolkit
| Item | Function in FVSEOF-related Research |
|---|---|
| Genome-Scale Model (GSM) | A computational representation of metabolism; the core matrix (S) for all FBA, FVA, and FVSEOF calculations. |
| COBRA Toolbox / COBRApy | Software packages used to implement constraint-based reconstructions and analysis, including running FVSEOF scripts. |
| Defined Minimal Media | For consistent in vivo validation, ensures experimental conditions match model constraints. |
| CRISPR-Cas9 Kit | For precise genomic edits (knockouts, knock-ins) of candidate genes identified by FVSEOF. |
| LC-MS/MS | For quantifying extracellular metabolite fluxes (exchange rates) and validating model predictions. |
| RNA-seq Kits | To analyze transcriptional changes after genetic modifications and compare with flux predictions. |
Table 1: Example FVSEOF Output for Succinate Production in E. coli (Anaerobic)
| Enforced Succinate Flux (mmol/gDW/h) | Biomass Flux (mmol/gDW/h) | Reaction ID | Reaction Name | Min Flux | Max Flux | Candidate Score |
|---|---|---|---|---|---|---|
| 0.0 | 0.85 | PPC | Phosphoenolpyruvate carboxylase | -0.5 | 2.1 | Low |
| 5.0 | 0.82 | PPC | Phosphoenolpyruvate carboxylase | 3.8 | 4.5 | High |
| 10.0 | 0.78 | PPC | Phosphoenolpyruvate carboxylase | 8.9 | 9.2 | High |
| 0.0 | 0.85 | PYK | Pyruvate kinase | 0.0 | 10.0 | Low |
| 10.0 | 0.78 | PYK | Pyruvate kinase | 0.0 | 1.5 | Medium |
Table 2: Comparison of Strain Engineering Algorithms
| Algorithm | Core Principle | Key Output | Computational Cost | Handles Multiple Objectives? |
|---|---|---|---|---|
| FVSEOF | Scans flux variability while enforcing target flux | Ranked list of gene targets correlated with product flux | Medium | No (Single enforced objective) |
| OptKnock | Identifies knockouts for max product yield at max growth | A set of deletion strategies | High | Yes (Bi-level optimization) |
| OMNI | Integrates kinetic & omics data with FVA | Context-specific flux ranges & targets | Very High | Yes |
| FVA | Quantifies flux flexibility under optimal growth | Flux range for each reaction | Low | No |
Visualizations
Title: FVSEOF Algorithm Computational Workflow
Title: Example Flux Redirection for Succinate from FVSEOF
Troubleshooting & FAQs
Q1: Our FVSEOF simulation yields an excessively large number of candidate knockout targets, making experimental validation impractical. How can we refine the list? A: This is common when scanning flux variability. Implement these filters sequentially:
- Essentiality Check: Cross-reference candidates with an essential gene database (e.g., EcoGene, DEG). Eliminate essential genes for growth.
- Flux Change Threshold: In your results table, apply a minimum threshold for the absolute change in the enforced objective flux (EOF). Focus on genes where perturbation causes a >10% change.
- Metabolic Choke Point Analysis: Prioritize genes encoding enzymes that are sole producers or consumers of a key metabolite in the target pathway.
- Genetic Tool Feasibility: Filter for genes with available knockout strains or well-characterized CRISPR guides for your organism.
Q2: When comparing single-point optimization (e.g., at max growth) to the FVSEOF scan, the suggested target genes are contradictory. Which result should we trust? A: FVSEOF is more robust for identifying consistent targets. Single-point optimization is highly sensitive to the chosen condition (e.g., growth rate). A contradiction often means the gene's effect is condition-dependent. Trust the FVSEOF target if it appears consistently across multiple scanning intervals. Refer to the decision table below.
Q3: The enforced objective flux (EOF) for our product is zero under wild-type conditions. Can FVSEOF still be applied? A: Yes, but a prerequisite step is required. You must first use OptKnock or similar constraint-based modeling to identify a feasible reaction deletion that couples product formation (non-zero EOF) with growth. Then, apply FVSEOF with this non-zero EOF as the objective to find additional gene knockdown (not knockout) targets to further enhance flux.
Q4: During the in silico scanning step, the simulation fails to find a feasible solution at certain enforced flux levels. What causes this and how do we proceed? A: Infeasibility indicates a metabolic bottleneck at that specific flux demand. This is informative. Proceed as follows:
- Identify the metabolites and reactions causing the infeasibility (check solver diagnostics).
- This bottleneck zone highlights critical network limitations. The genes involved in these reactions become high-priority overexpression targets, not knockouts.
- Resume scanning after the infeasible region by slightly increasing the flux bound.
Q5: Our experimental gene knockout based on FVSEOF prediction fails to improve product titer, or even severely inhibits growth. What are the likely reasons? A:
- Model Inaccuracy: The genome-scale model may lack regulatory constraints or isozymes. Validate the model's predictions for core metabolism.
- Compensatory Mechanisms: The organism may activate bypass pathways. Check flux balance at the mutant state and consider double knockouts.
- False Essentiality: The gene may be conditionally essential in your experimental medium. Re-simulate using your exact medium composition.
- Measurement Error: Ensure you are accurately measuring the enforced objective flux (e.g., specific production rate), not just final titer.
Data Presentation
Table 1: Core Distinction Between FVSEOF and Single-Point Optimization
| Feature | FVSEOF (Flux Variability Scanning) | Single-Point Optimization (e.g., pFBA at μ_max) |
|---|---|---|
| Analysis Type | Systematic scan across a range of enforced objective fluxes. | Optimization at a single specific condition/flux state. |
| Primary Goal | Identify gene targets that are consistently required across various production demands. | Identify optimal state for max growth or yield at one point. |
| Target Output | Ranked list of gene knockdown (or knockout) targets for robust improvement. | A single flux distribution and potential gene deletion targets for that state. |
| Context Consideration | High. Accounts for network flexibility and alternative pathways. | Low. Represents one solution among many possible flux states. |
| Best For | Identifying robust, strain-independent engineering targets. | Understanding theoretical maxima under a specific condition. |
Table 2: Troubleshooting Decision Matrix for Contradictory Targets
| Scenario | FVSEOF Suggestion | Single-Point Suggestion | Recommended Action |
|---|---|---|---|
| 1 | Strong candidate (high score across scan) | Not a candidate | Prioritize FVSEOF target. Likely a robust, context-independent target. |
| 2 | Weak/No candidate | Strong candidate | Treat single-point target cautiously. Validate with FVA at other flux states before实验. |
| 3 | Strong knockdown candidate | Strong knockout candidate | Consider knockdown first. The gene may be essential at higher production envelopes. |
| 4 | Candidate at high EOF only | Candidate at low EOF only | Strategy depends on goal. For high-titer process, use FVSEOF high-EOF target. |
Experimental Protocols
Protocol: In Silico FVSEOF Workflow for Identifying Gene Knockdown Targets
- Prerequisite: A validated genome-scale metabolic model (GEM) for your organism in a standardized format (SBML).
- Define the Enforced Objective Flux (EOF): Identify the exchange reaction for your target bio-product (e.g.,
EX_succ_e). - Set Scanning Range: Determine the minimum (vmin, often 0) and maximum (vmax, from FVA) feasible flux for the EOF.
- Perform Flux Scanning: Use a tool like COBRApy. For each small increment (e.g., 1% of vmax) of the enforced flux (vproduct):
- Constrain the product reaction lower bound to v_product.
- Set biomass as the objective function.
- Perform FVA (Flux Variability Analysis) for all gene-associated reactions.
- Calculate Flux Changes: For each gene at each flux point, calculate the relative change in its reaction flux compared to the wild-type (v_product = 0) state.
- Score and Rank Genes: Sum the absolute flux changes for each gene across all scanned points. Genes with the highest cumulative scores are top knockdown targets.
Protocol: Experimental Validation of FVSEOF-Predicted Knockdown
- Strain Construction: Use CRISPRi or titratable promoters to create tunable knockdown strains for the top 3-5 FVSEOF targets. Include a single-point optimization-predicted target as a control.
- Cultivation: Cultivate all strains in bioreactors with controlled, defined medium.
- Sampling & Metabolomics: Take periodic samples to measure growth (OD), substrate, and product concentrations. Calculate specific rates (μ, q_product).
- Flux Analysis: For the key mid-exponential phase point, perform [13C]-Metabolic Flux Analysis ([13C]-MFA) to obtain experimental flux maps.
- Correlation: Compare the in silico predicted flux changes (from Step 5 above) with the experimentally observed flux redistribution from [13C]-MFA.
Mandatory Visualization
Title: FVSEOF Computational Workflow for Target Identification
Title: FVSEOF vs Single-Point Optimization Logical Comparison
The Scientist's Toolkit
Table 3: Essential Research Reagent Solutions for FVSEOF-Guided Metabolic Engineering
| Item | Function in FVSEOF Workflow | Example/Notes |
|---|---|---|
| Genome-Scale Model (GEM) | The in silico representation of metabolism for simulations. Must be high-quality. | Model SEED, BIGG Database, or organism-specific models (e.g., iML1515 for E. coli). |
| Constraint-Based Modeling Software | Platform to perform FVA and scanning. | COBRApy (Python), COBRA Toolbox (MATLAB), OptFlux. |
| CRISPRi Knockdown System | For tunable gene repression to experimentally test knockdown predictions. | dCas9 and sgRNA libraries for your host; anhydrotetracycline (aTc) or IPTG inducible systems. |
| [13C]-Labeled Substrates | For experimental flux validation via [13C]-MFA. | [1-13C] Glucose, [U-13C] Glucose, or other relevant carbon sources. |
| Metabolomics Standards | For quantifying extracellular and intracellular metabolites to calculate fluxes. | Succinate, acetate, amino acids, etc., in defined medium. Use for LC-MS/MS calibration. |
| Bioreactor System | Provides controlled, reproducible environment for measuring specific production rates (q_product). | DASGIP, BioFlo, or similar systems with pH/DO control. Critical for data quality. |
| Flux Analysis Software | To interpret [13C]-labeling data and generate experimental flux maps. | INCA, 13C-FLUX, OpenFlux. |
Technical Support Center: Troubleshooting & FAQs for FVSEOF Experiments
Disclaimer: This guide provides general support for Flux Variability Scanning based on Enforced Objective Flux (FVSEOF) methodology. Specific conditions may require protocol optimization.
Frequently Asked Questions (FAQs)
Q1: After enforcing a production flux in my genome-scale model, the simulation returns an infeasible solution. What are the primary causes? A: An infeasible solution typically indicates a violation of the model's constraints. Common causes and checks are listed below.
| Potential Cause | Diagnostic Check | Recommended Action |
|---|---|---|
| Overly Stringent Flux Enforcement | Compare enforced flux value (v_target) with the model's theoretical maximum (max v_target) from FVA. |
Gradually increase the enforced flux from zero to identify the feasibility limit. |
| Growth Requirement Conflict | Set biomass formation to zero and re-solve. If feasible, growth and product formation are competing. | Implement a two-stage simulation: 1) Growth phase, 2) Production phase with relaxed/zero biomass. |
| Network Gaps or Missing Pathways | Check for dead-end metabolites in the pathway to your target. Use network gap-filling tools. | Consult literature and databases (e.g., Metacyc, KEGG) to annotate missing transport or enzymatic reactions. |
| Incorrect Media Constraints | Verify exchange reaction bounds for carbon, oxygen, and essential nutrients reflect your experimental setup. | Re-define the min and max bounds for all extracellular metabolites in the simulation. |
Q2: My FVSEOF-predicted gene knockout strategy fails to increase yield in the wet-lab experiment. How should I troubleshoot? A: Discrepancies between in silico predictions and in vivo results are common. Follow this systematic approach.
| Discrepancy Factor | Investigation Protocol | Tools/Techniques |
|---|---|---|
| Model Inaccuracy | Validate model predictions of wild-type growth rates and by-product secretion under your conditions. | Conduct chemostat or batch fermentation experiments to generate validation data. |
| Regulatory Effects | The model assumes constant enzyme capacity. Real cells may downregulate pathway enzymes. | Measure transcriptomics (RNA-seq) and/or proteomics in the engineered strain vs. wild-type. |
| Toxicity & Metabolic Burden | Knockouts may cause accumulation of toxic intermediates or excessive resource diversion. | Measure growth rate, cell viability, and intracellular metabolomics post-engineering. |
| Alternative Pathway Activation | Cells may use isoenzymes or promiscuous enzymes not captured in the model. | Perform 13C metabolic flux analysis (13C-MFA) to map actual intracellular fluxes. |
Q3: How do I choose the appropriate scanning range and step size when enforcing the target flux? A: The scanning parameters are critical for identifying robust strategies. Use the following heuristic table.
| Model Size / Complexity | Recommended Initial Scan Range (% of Max Theoretical Yield) | Recommended Step Size | Rationale |
|---|---|---|---|
| Small Metabolic Model (<500 reactions) | 10% to 100% | 5-10% | High resolution is computationally cheap and reveals detailed trade-offs. |
| Genome-Scale Model (>2000 reactions) | 30% to 100% | 10-20% | Balances detail with computation time. Focuses on high-yield, physiologically relevant space. |
| For Identifying Knockout Targets | Focus on 70%-100% of max yield | 5% | Robust strategies are often those that are essential only at high production rates. |
Detailed Experimental Protocols
Protocol 1: Core FVSEOF Computational Workflow
Objective: To identify gene knockout targets that couple cell growth with high product formation. Software: COBRA Toolbox (MATLAB/Python) or similar constraint-based modeling suite. Input: A curated genome-scale metabolic model (GEM) in SBML format.
Model Preparation:
- Load the GEM (
model). - Set medium constraints to match your experimental conditions (e.g.,
model = changeRxnBounds(model, 'EX_glc__D_e', -10, 'l')). - Define the biomass reaction (
biomass_rxn) and the target product reaction (target_rxn).
- Load the GEM (
Calculate Theoretical Maximum:
- Set the objective to maximize
target_rxn. Solve using FBA to obtainmax_product. - (Optional) Perform Flux Variability Analysis (FVA) on
target_rxnto confirm.
- Set the objective to maximize
Flux Enforcement Scanning:
- For
v_enforce = 0.1*max_product : step_size : max_product: a. Add a constraint to fix the lower bound oftarget_rxntov_enforce:model_enforced = changeRxnBounds(model, target_rxn, v_enforce, 'l'). b. Set the objective to maximizebiomass_rxnin themodel_enforced. c. Solve the linear programming problem:solution = optimizeCbModel(model_enforced). d. If feasible, record the solution flux for all reactions. If infeasible, break the loop.
- For
Target Identification:
- Analyze the flux distribution matrix across all scanning steps.
- Identify reactions whose flux direction correlates positively with the enforced product flux and is essential for feasibility at high enforcement levels. These are primary knockout candidates (e.g., reactions that divert carbon away from the target).
Validation with Double/Triple Knockout Simulation:
- Use OptKnock or RobustKnock algorithms on the model with the
target_rxnenforced at a high level (e.g., 90% of max) to predict synergistic knockout combinations.
- Use OptKnock or RobustKnock algorithms on the model with the
Title: Core computational FVSEOF workflow for target identification.
Protocol 2:In VivoValidation of Predicted Knockouts inE. coli
Objective: To construct and phenotype gene knockout strains identified by FVSEOF. Strain: E. coli K-12 MG1655. Target Product: Succinate.
Strain Construction (Using Lambda Red Recombination):
- Design primers with ~50 bp homology extensions for the target gene(s).
- Amplify a selective marker (e.g., kanamycin resistance cassette, kanR) from a template plasmid.
- Prepare electrocompetent cells of the production host, expressing the Lambda Red recombinase genes from a temperature-sensitive plasmid (pKD46).
- Electroporate ~100 ng of the purified PCR product into competent cells.
- Recover cells in SOC medium at 37°C for 2 hours, then plate on LB agar with kanamycin (50 µg/mL).
- Verify knockouts via colony PCR using verification primers outside the homologous region.
Batch Fermentation for Phenotyping:
- Inoculate 5 mL LB + antibiotic and grow overnight (37°C, 220 rpm).
- Sub-culture into 50 mL of defined minimal medium (e.g., M9 + 20 g/L glucose) in a 250 mL baffled flask to an initial OD600 of 0.05.
- Incubate at 37°C, 220 rpm. Monitor OD600 and glucose concentration hourly until mid-exponential phase, then every 30-60 min until stationary phase.
- Take 1 mL samples for extracellular metabolite analysis (HPLC or GC-MS). Centrifuge at 13,000 rpm for 3 min, filter supernatant (0.22 µm).
- HPLC Conditions (Example): Aminex HPX-87H column, 5 mM H2SO4 mobile phase, 0.6 mL/min, 50°C, Refractive Index detector.
Data Analysis:
- Calculate key metrics: maximum growth rate (µmax), product yield (Yp/s = mol product / mol substrate), and specific productivity (qp = rate per cell mass).
The Scientist's Toolkit: Research Reagent Solutions
| Item/Category | Function in FVSEOF Pipeline | Example/Specification |
|---|---|---|
| Genome-Scale Metabolic Model | The in silico representation of metabolism for all simulations. | E. coli iJO1366, S. cerevisiae iMM904, Human1 Recon3D. |
| Constraint-Based Modeling Software | Platform to perform FBA, FVA, and enforce flux constraints. | COBRA Toolbox (MATLAB/Python), Cobrapy (Python), RAVEN Toolbox (MATLAB). |
| Defined Minimal Medium | Provides a controlled environment matching model constraints for validation. | M9 (bacteria), Minimal Essential Medium (mammalian), Synthetic Complete (yeast). |
| Lambda Red Recombination System | Enables rapid, precise chromosomal gene knockouts in E. coli. | Plasmid pKD46 (gam, bet, exo), pKD3/4 (template for FRT-flanked markers). |
| Analytical Chromatography System | Quantifies substrate consumption and product formation for yield calculation. | HPLC with RI/UV detector or GC-MS for metabolites; columns: Aminex HPX-87H, etc. |
| 13C-Labeled Substrate | Enables experimental determination of intracellular fluxes via 13C-MFA. | [1-13C]-Glucose, [U-13C]-Glucose; purity >99%. |
| Flux Analysis Software (MFA) | Calculates intracellular flux maps from 13C labeling data. | INCA (Isotopomer Network Compartmental Analysis), 13CFLUX2, OpenFlux. |
Title: Conceptual rationale for flux enforcement revealing robust strategies.
A Step-by-Step Protocol: Implementing FVSEOF for Metabolic Engineering and Target Prioritization
Technical Support Center: Troubleshooting & FAQs
This support center addresses common challenges in the prerequisite steps for Flux Variability Scanning based on Enforced Objective Flux (FVSEOF) research. A robust FVSEOF outcome is contingent upon a high-quality, well-constrained Genome-Scale Metabolic Model (GSMM).
FAQs & Troubleshooting Guides
Q1: How do I select the most appropriate genome-scale model from public databases for my organism of interest? A: Model selection is critical. A poor choice can lead to inaccurate flux predictions.
- Issue: Multiple model versions or reconstructions exist for the same organism (e.g., E. coli iJO1366, iML1515).
- Solution:
- Prioritize models from curated repositories like the BiGG Models database.
- Compare key metrics (see Table 1) and select the model with the highest curation score, relevant publication date, and compatibility with your intended simulation environment (COBRApy, COBRA Toolbox).
- For non-model organisms, consider automated reconstruction tools (e.g., ModelSEED, CarveMe) followed by extensive manual curation.
Q2: My model produces physiologically unrealistic flux distributions (e.g., ATP overproduction, futile cycles) during FBA. How do I debug and curate it? A: This indicates gaps or errors in the model's metabolic network.
- Issue: Energy-generating cycles (EGCs), incorrect stoichiometry, or missing transport reactions.
- Solution Protocol:
- Perform Flux Variability Analysis (FVA) with a zero objective function to identify all reactions capable of carrying flux. Reactions with non-zero minimum and maximum fluxes in this state are often involved in loops.
- Check Mass and Charge Balance: Use toolbox functions (
checkMassChargeBalancein COBRA) to identify reactions with imbalanced equations. - Validate with Known Phenotypes: Use essentiality analysis (single gene/reaction deletion) against known knockout mutant growth data from databases like EcoCyc or SGD.
- Add Missing Constraints: Incorporate experimentally measured uptake/secretion rates, ATP maintenance (ATPM) requirements, and cofactor balances.
Q3: How do I accurately define the environmental parameters (exchange reaction bounds) for my specific experimental condition to use in FVSEOF? A: Environmental parameters directly constrain the solution space.
- Issue: Using default "complete medium" bounds when simulating a defined medium leads to false-positive overproduction predictions.
- Solution Protocol:
- Quantify Substrate Uptake: Measure the uptake rate (mmol/gDW/h) of your primary carbon source (e.g., glucose) via bioreactor or microplate reader data.
- Define Exchange Bounds: Set the lower bound (
lb) for the corresponding exchange reaction (e.g.,EX_glc__D_e) to-measured_rate. Set thelbfor absent nutrients to 0. - Define Secretion Bounds: Set the upper bound (
ub) for common byproducts (e.g., acetate, ethanol) based on historical or pilot experimental data, not arbitrarily high values. - Table 1: Example Environmental Parameter Definition for E. coli in a Glucose-Limited Chemostat*
| Exchange Reaction | Metabolite | Lower Bound (lb) [mmol/gDW/h] | Upper Bound (ub) [mmol/gDW/h] | Justification |
|---|---|---|---|---|
EX_glc__D_e |
D-Glucose | -10.0 | 0.0 | Measured uptake rate |
EX_o2_e |
Oxygen | -18.0 | 0.0 | Measured consumption |
EX_nh4_e |
Ammonia | -9999 | 0.0 | Non-limiting |
EX_pi_e |
Phosphate | -9999 | 0.0 | Non-limiting |
EX_ac_e |
Acetate | 0.0 | 2.5 | Max observed secretion |
EX_lac__D_e |
D-Lactate | 0.0 | 0.01 | Trace byproduct |
Q4: I get "infeasible" errors when applying enforced objective flux constraints in FVSEOF. What's wrong? A: The model cannot achieve both the cellular objective (e.g., growth) and the enforced target flux simultaneously under the given conditions.
- Issue: The enforced target product flux may be thermodynamically or stoichiometrically impossible.
- Solution:
- Verify Model Capability: First, run a Production Envelope Analysis (growth vs. target product synthesis) to find the theoretical maximum product yield.
- Relax Constraints: Ensure the enforced flux is below this theoretical maximum. Start with a low enforced flux and incrementally increase it.
- Review Medium: The current environmental bounds may lack a required cofactor or precursor. Re-evaluate medium composition.
Experimental Protocol: Production Envelope Analysis for Feasibility Check
Purpose: To determine the theoretical maximum production yield of a target metabolite before running FVSEOF.
- Load your curated GSMM (
model) and set environmental bounds. - Set the biomass reaction as the objective.
- Define the exchange reaction for your target product (e.g.,
EX_succ_efor succinate). - For a range of product secretion rates (e.g., 0 to 20 mmol/gDW/h): a. Constrain the product exchange reaction lower bound to the current rate. b. Perform FBA to maximize biomass. c. Record the resulting growth rate.
- Plot growth rate (y-axis) vs. product secretion rate (x-axis). The x-intercept is the maximum theoretical yield.
Visualization: FVSEOF Prerequisite Workflow
Diagram Title: Prerequisite Workflow for Robust FVSEOF Analysis
Visualization: Common Model Curation Issues & Checks
Diagram Title: Key Model Curation Checks and Corresponding Tools
The Scientist's Toolkit: Key Research Reagent Solutions
| Item / Resource | Function / Purpose in GSMM Prerequisites |
|---|---|
| COBRA Toolbox (MATLAB) | Primary software suite for constraint-based modeling, FBA, FVA, and model curation tasks. |
| COBRApy (Python) | Python version of COBRA, essential for automated pipelines and integration with machine learning libraries. |
| BiGG Models Database | Curated repository of high-quality, published genome-scale metabolic models. Primary source for model selection. |
| MEMOTE (Model Testing) | Open-source software for standardized and comprehensive testing of GSMM quality (stoichiometry, annotations, etc.). |
| CarveMe / ModelSEED | Platforms for de novo reconstruction of draft GSMMs from a genome annotation, for non-model organisms. |
| EcoCyc / KEGG / MetaCyc | Reference databases for biochemical pathways, used to verify and annotate model reactions during curation. |
| Experimental Data (e.g., Uptake Rates) | Quantitative measurements from chemostats or microplate assays are not reagents but essential data to define accurate environmental bounds. |
Troubleshooting Guides and FAQs
Q1: During the definition of the Objective Flux (OF) in my FVSEOF (Flux Variability Scanning based on Enforced Objective Flux) simulation, the model fails to produce a feasible solution. What could be the cause? A1: A common cause is an incorrectly defined OF constraint. Ensure that: 1) The OF reaction is correctly identified in your genome-scale metabolic model (GMM). 2) The enforced flux rate is within a physiologically possible range. Check the model's maximum theoretical yield for your target compound (e.g., succinate) and start with a lower enforcement value (e.g., 10-30% of max) before scaling up. 3) The co-factor and mass balances for the OF are consistent (e.g., NADH/NADPH usage for vanillin production).
Q2: After enforcing the OF, the variability scanning step returns no candidate reaction sets for genetic modification. How can I resolve this? A2: This indicates that the enforced OF is too stringent, leaving no flexibility in the network. First, relax the OF enforcement value incrementally. Second, verify that your growth or maintenance ATP constraint is not conflicting with the OF. Temporarily relaxing the non-growth associated maintenance (NGAM) can help identify if it's a thermodynamic bottleneck. Third, ensure your reaction variability analysis is set to a sensible epsilon tolerance (e.g., 1e-6).
Q3: My experimental yield of succinate is significantly lower than the FVSEOF-predicted yield after implementing suggested gene knockouts. What are the likely reasons? A3: Discrepancies often stem from model limitations. Key checks include: 1) Regulation: The model is constraint-based and lacks transcriptional/translational regulation that may hinder flux. 2) Toxicity: High intermediate or product (e.g., vanillin) accumulation can inhibit growth. 3) Kinetics: The model assumes enzymes adjust perfectly; in reality, enzyme kinetics and capacity are limiting. 4) Model Completeness: Ensure all relevant transport reactions and co-factor dependencies (e.g., for vanillin biosynthesis from ferulic acid) are accurately represented.
Q4: How do I choose between maximizing biomass and enforcing the objective flux when setting up the core FVSEOF algorithm? A4: The FVSEOF methodology typically involves a two-step optimization. First, you solve for maximum biomass to establish a baseline. Then, you enforce the OF at a specific fraction of its maximum theoretical yield while setting biomass as a constraint, often at a reduced value (e.g., 80% of max). This forces the network to prioritize your target while maintaining viability. The core algorithm is defined in the table below.
Q5: What file format should my metabolic model be in for reliable FVSEOF analysis, and are there common parsing errors?
A5: SBML (Systems Biology Markup Language) Level 3 Version 1 is the standard. Common errors include: missing reaction bounds, incorrect metabolite charge/formula leading to mass imbalance, and duplicate reaction identifiers. Always validate your model using tools like COBRApy's check_mass_balance() and verify_model() functions before proceeding.
Core FVSEOF Algorithm Protocol
Objective: To identify genetic modification targets for overproducing a biochemical (e.g., Succinate, Vanillin) by systematically scanning flux variability while enforcing its production.
Prerequisites: A validated genome-scale metabolic model (GMM) in SBML format, COBRA Toolbox (v3.0+) or COBRApy, and a defined objective flux reaction (e.g., EX_succ_e for succinate export).
Step-by-Step Methodology:
- Model Preparation: Load the GMM. Define the biomass reaction (
BIOMASS) and the objective flux reaction (OF). - Calculate Baselines:
- Optimize for maximum biomass (
Max Z1). Record value:µ_max. - Constrain biomass to zero and optimize for maximum objective flux (
Max Z2). Record value:OF_max.
- Optimize for maximum biomass (
- Enforce Objective Flux: For each enforcement level
k(from 0.1 to 0.9 ofOF_maxin steps):- Set the lower bound of the
OFreaction to:LB_OF = k * OF_max. - Set the biomass constraint to a fraction of its maximum (e.g.,
LB_biomass = 0.05 * µ_maxto maintain viability). - Perform Flux Variability Analysis (FVA) on all model reactions under these new constraints. Use a small optimality tolerance (e.g., 99% of optimal solution).
- Set the lower bound of the
- Scan for Modification Targets: For each reaction
i, analyze its flux range ([min_i, max_i]) across all enforcement levelsk.- Up-regulation Target: A reaction where
min_iincreases consistently and significantly asOFenforcement increases. - Down-regulation/Knockout Target: A reaction where
max_idecreases to near zero asOFenforcement increases, indicating it must be shut down.
- Up-regulation Target: A reaction where
- Rank and Validate: Rank candidate reactions by the magnitude and consistency of flux change. Validate essentiality checks (single-gene deletion) and analyze through metabolic pathway maps.
Key Algorithm Steps Table
| Step | Mathematical Formulation | Purpose | Output |
|---|---|---|---|
| 1. Baseline Max Biomass | Max Z1 = v(BIOMASS) s.t. S·v = 0, LB ≤ v ≤ UB | Find maximum growth rate. | µ_max |
| 2. Baseline Max OF | Max Z2 = v(OF) s.t. S·v = 0, LB ≤ v ≤ UB, v(BIOMASS)=0 | Find theoretical max target yield. | OF_max |
| 3. Enforce OF & FVA | For each k: LBOF = k * OFmax LBBIOM = 0.05 * µmax FVA: Min/Max v(i) s.t. S·v=0, new bounds | Find feasible flux ranges for all reactions at enforced production. | Flux range [min_i, max_i] for all reactions i at each k. |
| 4. Scan & Identify | ∆Flux(i) = f(mini, maxi) over increasing k | Identify reactions whose flux is forced to increase or decrease. | List of candidate reactions for up/down-regulation. |
FVSEOF Workflow Diagram
Title: FVSEOF Core Algorithm Workflow
Objective Flux Enforcement Logic
Title: Logic of Network States Under Flux Enforcement
The Scientist's Toolkit: Research Reagent Solutions
| Item | Function in FVSEOF-Related Research | Example/Specification |
|---|---|---|
| Genome-Scale Model (GMM) | The core in silico representation of metabolism for constraint-based simulations. | E. coli iML1515, S. cerevisiae iMM904, or organism-specific models from databases like BiGG or MetaNetX. |
| Constraint-Based Modeling Suite | Software to perform FBA, FVA, and implement the FVSEOF algorithm. | COBRA Toolbox (MATLAB), COBRApy (Python), or the RAVEN Toolbox. |
| Chemically Defined Medium | For reproducible fermentation experiments to validate model predictions. | M9 minimal medium (for bacteria) or SM medium (for yeast) with precisely controlled carbon sources (e.g., glucose, glycerol). |
| Analytical Standard | For accurate quantification of the objective flux product (e.g., succinate, vanillin). | HPLC- or GC-grade succinic acid or vanillin standard for calibration curve generation. |
| Quenching Solution | To rapidly halt metabolism in culture samples for accurate intracellular metabolite measurement. | Cold methanol/buffer solution (60% methanol, 40% 0.85% ammonium bicarbonate, -40°C). |
| Gene Editing Kit | To implement suggested knockouts/overexpressions from FVSEOF predictions. | CRISPR-Cas9 systems specific to your host organism (e.g., pCas9/pTargetF for E. coli). |
| Enzyme Assay Kit | To verify activity changes in up/down-regulated targets identified by FVSEOF. | Colorimetric or fluorometric kits for specific dehydrogenases, kinases, or reductases relevant to the pathway. |
Troubleshooting Guides & FAQs
Q1: During iterative scanning, the solver frequently returns "infeasible solution" when enforcing an objective flux bound. What are the primary causes and solutions?
A: An infeasible solution indicates that the enforced flux constraint is incompatible with the network's stoichiometry and other applied constraints.
- Cause 1: The enforced objective flux value is set too high, beyond the theoretical maximum (max in FVA). Re-run Flux Variability Analysis (FVA) on the objective function to establish the feasible range.
- Cause 2: Conflicting constraints elsewhere in the model (e.g., on uptake/secretion rates) are creating a "no solution" scenario. Systematically relax other constraints to identify the conflict.
- Solution Protocol:
- Perform FVA on the primary objective reaction to determine its allowable range [min, max].
- Start iterative scanning from the min value, incrementing in small, physiologically relevant steps.
- If infeasibility occurs mid-scan, verify the consistency of all other model bounds using a feasibility check (e.g., solving for biomass without an objective).
Q2: The resulting flux pattern shows unexpected variability in a key pathway despite a fixed objective flux. How should this be investigated?
A: This is a central observation in flux variability analysis. High variability indicates alternative optimal pathways (isozymes, cycles, redundant routes).
- Investigation Protocol:
- Identify Reactions: List all reactions with variability > 10% of the median flux at that enforced objective level.
- Subsystem Analysis: Group variable reactions by metabolic subsystem (e.g., Pentose Phosphate Pathway).
- Correlation Analysis: Calculate pairwise correlation coefficients between variable reaction fluxes across all scanning iterations. Strong negative correlations often reveal redundant pathways.
- Additional Constraint: Integrate transcriptomic or proteomic data to further constrain the variable reactions and reduce solution space.
Q3: How do I distinguish between numerical solver instability and genuine biological flux variability in the output data?
A:
- Genuine Variability: Manifests as consistent, bounded ranges across solver repeats and is often structurally inherent (e.g., parallel pathways). It will be reproducible with different LP/QP solvers (e.g., GLPK, COBRA, CPLEX).
- Numerical Instability: Appears as wildly fluctuating, unbounded ranges or different solutions on consecutive runs with identical inputs.
- Diagnostic Protocol:
- Run the identical scanning problem 3-5 times, noting the solution time and status.
- For a point yielding high variability, fix the objective flux and compute the exact min/max for a suspect reaction using FVA. Compare this to the range from the scan.
- Tighten the solver's optimality and feasibility tolerances (e.g., to 1e-9) and re-run.
Q4: When integrating scanning results across multiple objective flux levels, how can we optimally visualize the high-dimensional flux trends?
A: Dimensionality reduction and clustering are key.
- Visualization Protocol:
- Data Matrix: Construct matrix where rows are scanning iterations (enforced flux levels) and columns are reaction fluxes.
- Principal Component Analysis (PCA): Apply PCA to identify the top 2-3 principal components that explain the most variance across the scanning series.
- Visualization: Plot iterations in PC space, colored by the enforced objective flux level, to reveal phase transitions or metabolic regime shifts.
- Heatmap: Create a clustered heatmap of reactions (columns) across iterations (rows) to group co-varying reactions.
Key Experimental Protocols
Protocol 1: Core Iterative Flux Scanning with FVA
Objective: To map the solution space of a genome-scale metabolic model (GSMM) as a function of a primary objective reaction's flux.
- Load Model: Load the GSMM (e.g., in SBML format) into a constraint-based modeling environment (e.g., COBRApy, MATLAB COBRA Toolbox).
- Apply Base Constraints: Set constraints for growth medium (e.g., glucose uptake = 10 mmol/gDW/h, oxygen uptake = 20 mmol/gDW/h).
- Baseline FVA: Perform Flux Variability Analysis on the primary objective reaction (e.g., ATPM, BIOMASS) to determine its global range: Obj_min, Obj_max.
- Iterative Loop: For i = Obj_min to Obj_max in steps of (Obj_max - Obj_min)/N: a. Set the lower and upper bound of the objective reaction to i (fixing its flux). b. Perform a full Flux Variability Analysis (or sample the solution space) on all model reactions under this condition. c. Record the minimum and maximum flux for each reaction.
- Compile Output: Create a data structure containing, for each reaction and each enforced flux i, the computed [min, max] flux range.
Protocol 2: Identifying Alternative Optimal Pathways from Scanning Data
Objective: To identify groups of reactions that form functionally redundant pathways.
- Data Filtering: From the iterative scan data, extract reactions where the median variability span (max - min) across all iterations exceeds a threshold (e.g., 1e-3).
- Flux Profile Matrix: For each variable reaction, create a flux profile vector of its median flux at each scanning point.
- Hierarchical Clustering: Cluster reactions using their flux profiles (Euclidean distance, Ward's linkage).
- Pathway Enrichment: For each resulting cluster, perform an over-representation analysis using the model's reaction subsystems or KEGG pathway annotations.
- Validation via Deletion: For a representative reaction in each key cluster, perform an in silico gene knockout simulation at multiple enforced objective levels to assess functional impact.
Data Tables
Table 1: Example Flux Variability Scanning Results for E. coli Core Model (Glucose Minimal Medium)
| Enforced ATPM Flux (mmol/gDW/h) | Biomass Flux Range [min, max] (1/h) | PPP Flux Variability Span (mmol/gDW/h) | TCA Cycle Flux Variability Span (mmol/gDW/h) | Solution Status |
|---|---|---|---|---|
| 5.0 | [0.05, 0.18] | 0.01 | 0.15 | Optimal |
| 10.0 | [0.10, 0.22] | 0.02 | 0.25 | Optimal |
| 15.0 | [0.15, 0.25] | 5.50 | 0.30 | Optimal |
| 18.0 | [0.18, 0.18] | 0.01 | 0.05 | Optimal |
| 20.0 | Infeasible | - | - | Infeasible |
Table 2: Research Reagent Solutions Toolkit
| Item | Function in Flux Analysis | Example/Supplier |
|---|---|---|
| Constraint-Based Modeling Software | Platform for performing FVA and iterative scanning. | COBRApy, COBRA Toolbox for MATLAB, RAVEN Toolbox |
| Linear Programming (LP) Solver | Computational engine for solving the linear optimization problems. | Gurobi, CPLEX, GLPK |
| Genome-Scale Metabolic Model (GSMM) | Stoichiometric network representing all known metabolic reactions for an organism. | Recon (Human), iJO1366 (E. coli), Yeast8 |
| Stoichiometric Matrix (S) in SBRML | Core mathematical representation of the metabolic network (reactions x metabolites). | Imported from models in .xml or .mat format |
| Flux Sampling Algorithm | Used when solution space is large, to statistically characterize possible flux distributions. | gpSampler (COBRA), OptGpSampler |
| Pathway Analysis Tool | For enrichment analysis of variable reaction clusters. | KEGG Mapper, GO Enrichment Analysis |
Visualizations
Iterative Flux Scanning Core Workflow
Redundant Pentose Phosphate Pathway Fluxes
Technical Support Center
Troubleshooting Guide & FAQs
Q1: My flux variability analysis (FVA) produces an excessively large solution space for many reactions. How can I narrow down candidate gene targets? A: A large FVA solution space often indicates insufficient constraints. Implement a two-step protocol:
- Enforce Objective Flux (EOF) Scanning: Constrain the model's primary objective (e.g., growth rate) to a sub-optimal value (e.g., 90% of max) and re-run FVA. This identifies reactions whose variability is reduced, marking them as sensitive to the enforced objective.
- Reaction Essentiality Check: Perform single reaction knockouts within the enforced objective condition. Reactions that become essential under this constraint are high-priority candidates. Use the following protocol:
- Set growth-associated reaction (e.g.,
R_biomass) lower bound to0.9 * max_growth. - Perform FVA to identify reactions with reduced flux variability (
ΔVariability > 75%). - For each high-impact reaction, simulate its knockout and compute the objective flux drop.
- Prioritize genes associated with reactions where knockout reduces objective flux below a set threshold (e.g., <50% of constrained value).
- Set growth-associated reaction (e.g.,
Q2: After identifying candidate reactions, how do I reliably map them to specific genes for knockout? A: Mapping reactions to genes in Genome-Scale Metabolic Models (GMMs) can be complex due to isoenzymes and protein complexes. Follow this diagnostic protocol:
- Consult the model's
grRules(gene-reaction rules) for the target reaction. - Parse the Boolean logic (e.g.,
GENE1 and GENE2for a complex;GENE3 or GENE4for isoenzymes). - For
ANDrules: All genes must be knocked out to eliminate flux. - For
ORrules: Each gene must be tested individually, as single knockouts may be insufficient. Prioritize genes with high expression in your experimental transcriptomics data. - Validation Step: Use
CobraPy'sgene_knockoutfunction to simulate the genetic perturbation in silico before lab work.
Q3: How do I prioritize candidate overexpression targets from flux data suggesting increased reaction flux is beneficial? A: Overexpression targets require differentiating between capacity-limiting and regulation-limited reactions. Use this workflow:
- Identify Flux-Forced Reactions: From EOF scanning, list reactions where maximum flux under constraint is significantly higher than wild-type flux.
- Check Thermodynamic Feasibility: Use tools like
eQuilibratorto ensure the reaction's directionality is consistent. - Analyze Transcriptomic Correlation: Cross-reference with transcriptomic data. Prioritize reactions where flux is positively correlated with gene expression, suggesting direct regulation.
- Exclude Bottlenecks from Downstream Effects: Test if artificially increasing the reaction flux (via model bounds) improves the objective. If not, the reaction is not a primary bottleneck.
Q4: My in silico gene knockout predicts lethality, but the wet-lab experiment shows viable growth. What are the common causes? A: This discrepancy often stems from model incompleteness or incorrect regulation. Follow this diagnostic checklist:
| Possible Cause | Diagnostic Test | Corrective Action |
|---|---|---|
| Alternative Isoenzyme (Missing from model) | BLAST query of your organism's genome against the reaction's E.C. number. | Annotate and add the missing gene to the model. |
| Incorrect Biomass Composition | Compare model's biomass precursors with recent experimental literature. | Update biomass equation composition. |
| Missing Bypass Pathway | Perform flux balance analysis (FBA) on the knockout model and inspect the active alternate pathway. | Verify pathway existence with pathway databases (e.g., MetaCyc). |
| Wrong Medium Constraints | Verify in silico medium matches experimental conditions exactly. | Correct exchange reaction bounds in the model. |
Q5: How can I integrate transcriptomic data with flux data to improve target ranking? A: Create an integrated score. Use this protocol for ranking:
- Calculate a Flux Impact Score (FIS):
FIS = (1 - (Flux_Variability_Constrained / Flux_Variability_WildType)) * 100. Higher scores indicate greater flux control. - Calculate an Expression Z-Score:
Z = (Expression_Target_Gene - Mean_Expression_All_Genes) / Std_Dev_Expression. - Compute a Combined Priority Index (CPI):
CPI = (0.7 * FIS) + (0.3 * abs(Z)). Weigh flux impact higher for knockout candidates. For overexpression, prioritize reactions with high FIS but low or negative Z (under-expressed). - Tabulate results.
Table: Example Candidate Ranking Using Combined Priority Index (CPI)
| Rank | Gene ID | Reaction | Flux Impact Score (FIS) | Expression Z-Score | CPI | Suggested Action |
|---|---|---|---|---|---|---|
| 1 | G_1234 | PFK (R_PFK) | 95.2 | -1.8 | 92.3 | Overexpress |
| 2 | G_5678 | ATPase (R_ATPM) | 98.1 | 0.5 | 89.7 | Knockout |
| 3 | G_9101 | SUCDi (R_SUCDi) | 87.5 | 2.1 | 85.8 | Down-regulate |
Experimental Protocols
Protocol 1: Flux Variability Scanning with Enforced Objective Flux (EOF-FVS) Purpose: To identify reactions whose flux range is critically sensitive to a sub-maximal objective function.
- Model Loading: Load your GEM (e.g., in
CobraPyformat). - Baseline Optimization: Solve FBA to determine maximum objective flux (
Obj_max). - Apply Constraint: Set the objective reaction bound to a sub-optimal value (e.g.,
objective.bounds = (0.9*Obj_max, Obj_max)). - Flux Variability Analysis: Perform FVA for all reactions under the constrained model. Use
cobra.flux_analysis.flux_variability_analysis()with default bounds. - Calculate Variability Reduction: For each reaction, compute:
% Reduction = 100 * (1 - (range_constrained / range_wildtype)). - Output: Generate a list of reactions where
% Reduction > 75%. These are high-priority candidates for genetic manipulation.
Protocol 2: In Silico Validation of Gene Knockout Candidates Purpose: To predict the phenotypic impact of single/multiple gene knockouts under enforced objective flux.
- Prepare Model: Start with the constrained model from Protocol 1, Step 3.
- Gene Deletion Simulation: For each candidate gene, use
cobra.flux_analysis.single_gene_deletion(). - Impact Assessment: Calculate the percentage drop in the enforced objective flux post-knockout.
- Threshold Filtering: Classify as "High-Impact" if objective flux drops below 50% of its constrained value.
- Output: A validated shortlist of gene deletions predicted to severely impair the objective under the defined condition.
Diagrams
Diagram 1: EOF-FVS Workflow for Target Identification
Diagram 2: From Reaction to Gene Target Logic Mapping
Diagram 3: Integrated Target Prioritization Scoring
The Scientist's Toolkit: Research Reagent Solutions
| Item | Function & Application in Target Validation |
|---|---|
| Genome-Scale Metabolic Model (GEM) (e.g., Recon, iML1515) | In silico representation of metabolism. Used for FBA, FVA, and simulating gene knockouts to predict flux changes. |
| Constraint-Based Reconstruction and Analysis (COBRA) Toolbox | MATLAB/Python software suite for performing all constraint-based modeling simulations (FBA, FVA, EOF scanning). |
| CRISPR-Cas9 Knockout Kit (e.g., lentiviral sgRNA vectors) | For precise, stable gene knockout in cell lines to validate in silico predictions of essentiality. |
| dCas9-KRAB / dCas9-VPR Systems | For targeted gene down-regulation (CRISPRi) or up-regulation (CRISPRa) to validate down/over-expression targets. |
| RNA-Seq Library Prep Kit | To generate transcriptomic data for calculating expression Z-scores and integrating with flux data. |
| Seahorse XF Analyzer Consumables | To experimentally measure extracellular acidification and oxygen consumption rates, providing ex vivo validation of predicted metabolic flux changes. |
| Siliconized Microcentrifuge Tubes | Essential for handling sensitive reagents during CRISPR complex formation or cDNA synthesis without loss due to adhesion. |
| High-Fidelity DNA Polymerase | For accurate amplification of genetic constructs (e.g., sgRNA, dCas9 fusions) with minimal errors for stable cell line generation. |
Troubleshooting Guides & FAQs
Q1: After implementing the FVSEOF-predicted gene knockouts (e.g., ldhA, adhE, ackA-pta), my E. coli strain shows severe growth impairment. What could be the cause and how can I resolve it?
A: This is a common issue. FVSEOF identifies knockouts that maximize theoretical succinate flux but may ignore redox (NADH/NAD+) and ATP cofactor balancing.
- Cause: The simultaneous knockout of major fermentative pathways can cripple the cell's ability to recycle NADH and generate ATP (via substrate-level phosphorylation), leading to growth arrest.
- Solution:
- Implement Knockouts Sequentially: Start with ldhA, then introduce adhE in an adapted strain.
- Introduce a Redox-Balancing Module: Express a heterologous NADH-dependent formate dehydrogenase (FDH) from Candida boidinii under a strong promoter. This converts CO₂ and NADH to formate, aiding NAD+ regeneration.
- Supplement Media: Add low concentrations of metabolites that can feed into the TCA cycle (e.g., 0.2 g/L aspartate) to boost initial energy generation.
Q2: The enforced succinate flux in my FVSEOF simulation suggests upregulating the glyoxylate shunt (aceBA), but my experimental flux analysis shows minimal activity. Why?
A: The in silico prediction may not account for allosteric regulation.
- Cause: Isocitrate dehydrogenase (ICD, icd gene) is highly active and outcompetes isocitrate lyase (ACE, aceB gene) for isocitrate. ICD is regulated by phosphorylation (aceK), creating a complex regulatory node.
- Solution:
- Knockdown icd: Use CRISPRi to repress icd expression, not a full knockout (which is lethal), to divert flux toward the glyoxylate shunt.
- Express a Constitutive ACE Variant: Clone aceBA from a C. glutamicum mutant with reduced feedback inhibition.
- Modulate Cultivation Conditions: Use a defined minimal medium with acetate (1-2 g/L) as a co-substrate to induce and utilize the glyoxylate shunt naturally.
Q3: My high-yield strain produces unexpected by-products (e.g., acetate, pyruvate) under microaerobic conditions despite the knockouts. How do I diagnose and fix this?
A: This indicates residual flux through alternative pathways or regulatory dysfunction.
- Cause: Incomplete gene knockout, activation of cryptic pathways, or overflow metabolism due to an imbalanced glycolytic flux.
- Diagnostic Protocol:
- Seq-Verify Knockouts: Perform PCR and sequencing on the modified loci to confirm complete gene disruption.
- Enzymatic Assay: Measure in vitro activity of Pyruvate Formate-Lyase (PFL, pflB). Despite ackA-pta knockout, active PFL can produce acetyl-CoA and then acetate via other minor routes.
- Solution: Introduce a pflB knockout or downregulation if the diagnostic assay shows high activity, but ensure anaerobic conditions are tightly controlled as ΔpflB strains are anaerobic-lethal.
Q4: When I enforce a very high succinate objective flux (e.g., > 90% of maximum theoretical yield) in FVSEOF, the solution space becomes empty. What does this mean and what are the practical implications?
A: An empty solution space is a critical in silico finding.
- Implication: The network, under the applied constraints (e.g., glucose uptake, knockouts), is incapable of achieving the enforced flux level. It defines the absolute thermodynamic/stoichiometric limit for your specific model configuration.
- Actionable Steps:
- Relax Constraints: Slightly lower the enforced objective flux (e.g., from 95% to 85%) to find a feasible solution and identify the next limiting reactions.
- Re-evaluate Model: Ensure your genome-scale model (e.g., iML1515) includes all heterologous reactions you've introduced (e.g., from Mannheimia succiniciproducens).
- Identify New Targets: The last feasible solution before the space becomes empty highlights the most critical bottlenecks. These are your new priority targets for overexpression (e.g., PEP carboxylase, ppc).
Key Experimental Protocols
Protocol 1: In Silico FVSEOF Implementation for Target Identification
- Load Model: Use COBRApy in Python. Load a curated E. coli GEM (e.g., iML1515).
- Apply Constraints: Set glucose uptake rate to -10 mmol/gDW/h. Apply known knockouts (
model.reactions.<RXN_ID>.bounds = 0, 0). - Define Objective: Set the succinate exchange reaction (
EX_succ_e) as the objective. - Run FVA: Perform Flux Variability Analysis (FVA) on the wild-type model to determine the maximum possible succinate flux (MaxSucc).
- Enforce Flux & Scan: For enforcing flux levels from 0.1MaxSucc to 0.95MaxSucc in 0.05 increments:
- Constrain the succinate exchange reaction lower bound to the enforced value.
- Perform FVA on all other reactions.
- Record reactions whose flux variability range collapses to a non-zero value (consistently up- or down-regulated) across increasing enforced fluxes.
- Prioritize Targets: Reactions with consistently positive flux are overexpression targets (e.g., mdh). Reactions with consistently negative/zero flux are knockout targets (e.g., ldhA).
Protocol 2: Validation of Succinate Production via HPLC
- Culture & Sampling: Grow engineered and control strains in M9 minimal medium with 20 g/L glucose under defined microaerobic conditions (0.15 vvm, 200 rpm). Take 1 mL samples at OD₆₀₀ ~ 0.6, 1.2, and at stationary phase.
- Sample Prep: Centrifuge at 13,000 x g for 5 min. Filter supernatant through a 0.22 μm nylon membrane.
- HPLC Setup:
- Column: Aminex HPX-87H (300 x 7.8 mm)
- Mobile Phase: 5 mM H₂SO₄, isocratic, 0.6 mL/min
- Temperature: 45 °C
- Detector: Refractive Index (RID), 40 °C
- Analysis: Run samples and quantify succinate, acetate, lactate, formate, and ethanol against external standards. Calculate yield (g/g glucose) and titer (g/L).
Mandatory Visualizations
Title: FVSEOF Algorithm Workflow for Target Identification
Title: Engineered Succinate Pathway in E. coli with FVSEOF Targets
Research Reagent Solutions & Essential Materials
| Item Name | Function in Experiment | Key Details / Recommended Source |
|---|---|---|
| iML1515 Genome-Scale Model | In silico metabolic network for FVSEOF simulations. Defines all reactions, genes, and constraints. | Available from BiGG Models database. Use with COBRApy toolbox. |
| COBRApy (Python Package) | Primary software toolbox for constraint-based reconstruction and analysis (FVA, FBA). | Install via pip install cobra. Essential for running FVSEOF algorithm. |
| E. coli BW25113 ΔldhA ΔadhE | Base strain with key fermentative knockouts to minimize by-products. | Part of Keio collection. Use P1 phage transduction to combine knockouts. |
| pTrc99A-ppc plasmid | Expression vector for overexpression of PEP carboxylase (ppc), a common FVSEOF overexpression target. | Amp⁺. Use IPTG (0.1 mM) for induction. Cloned gene from E. coli MG1655. |
| Aminex HPX-87H Column | HPLC column for organic acid analysis (succinate, acetate, lactate, etc.). | Bio-Rad Laboratories. Requires acidic mobile phase (5 mM H₂SO₄). |
| M9 Minimal Salts | Defined medium for metabolic experiments. Eliminates complex nutrient interference. | Contains (NH₄)₂SO₄, KH₂PO₄, Na₂HPO₄, NaCl. Supplement with MgSO₄, CaCl₂, and glucose. |
| NADH-Dependent Formate Dehydrogenase (FDH) | Enzyme for redox balancing. Converts CO₂ + NADH to formate + NAD⁺. | Recombinant enzyme from Candida boidinii. Can be expressed from plasmid pTrc99A-fdh. |
| CRISPRi Kit for icd repression | For tunable knockdown of isocitrate dehydrogenase to shift flux to glyoxylate shunt. | Uses dCas9 and sgRNA targeting icd gene. Allows partial flux reduction without lethality. |
Overcoming Practical Challenges: Troubleshooting FVSEOF for Reliable and Scalable Results
Troubleshooting Guides & FAQs
FAQ 1: What are the primary indicators of a network gap in my metabolic model during Flux Variability Scanning (FVS)? Answer: Network gaps manifest as blocked reactions, inability to produce essential biomass precursors, or zero flux through pathways expected to be active under the enforced objective flux. A key indicator is when FVS results show no variability (zero range) for reactions downstream of a gap when the objective is enforced.
FAQ 2: How can I diagnose and resolve thermodynamically infeasible cycles (TICs) that distort FVS results?
Answer: TICs are loops of reactions that can carry flux without net consumption of metabolites, artificially inflating flux ranges. Diagnose them using tools like loopless constraints or by checking for nonzero flux in null reactions during simulation. Resolution involves applying thermodynamic constraints (e.g., Gibbs energy data) or implementing loopless flux balance analysis (ll-FBA) protocols within your FVS framework.
FAQ 3: My enforced objective flux leads to an infeasible solution. What are the first steps to debug this? Answer: Infeasibility often stems from incorrect model constraints, missing energy (ATP) or redox (NADH) cofactor balancing, or an objective that violates network stoichiometry. First, relax all non-physiological bounds (e.g., exchange reactions). Then, systematically check the stoichiometric consistency of the sub-network involved in your enforced objective.
FAQ 4: How do I distinguish between a genuine network gap and missing transport reaction in my cell-specific model? Answer: Conduct a flux propagation analysis from the enforced objective reaction. If a metabolite is produced but not consumed (or vice versa) within the model boundary, it suggests a network gap. If the metabolite is available in the extracellular compartment but cannot enter the cytosol, a missing transport reaction is likely. GapFind algorithms can assist in this differentiation.
Experimental Protocols
Protocol 1: Identifying Network Gaps via Flux Variability Scanning with Enforced Objective Flux
- Objective Enforcement: Set the flux through your target reaction (e.g., drug production) to a non-zero value (v_obj = k) as a model constraint.
- FVS Execution: Perform Flux Variability Analysis (FVA) on all model reactions under this new constrained condition.
- Gap Analysis: Filter reactions with minimum and maximum flux bounds equal to zero (|min| = |max| = 0). These are blocked.
- Precursor Tracing: For each blocked reaction essential to the objective, identify its unmet substrate metabolite(s).
- Gap Filling Candidate: Propose adding reactions from databases (e.g., MetaCyc) that connect the orphan metabolite to the main network. Validate with gap-filling algorithms like
mseed.
Protocol 2: Eliminating Thermodynamically Infeasible Loops for Robust FVS
- Loop Detection: Run standard FVA without thermodynamic constraints. Identify reactions with unbounded flux ranges (e.g., incredibly high maximum flux).
- Apply ll-FBA: Implement the loopless constraint method. This adds a constraint that the sum of absolute log-transformed metabolite concentrations times the stoichiometric matrix is zero for all internal fluxes.
- Re-run FVS: Perform FVS with the loopless constraints applied.
- Validation: Compare flux ranges before and after. Genuine metabolic capabilities will remain, while loop-driven inflations will be eliminated.
Protocol 3: Correcting Model Infeasibility Post-Objective Enforcement
- Feasibility Test: Attempt to maximize a trivial objective (e.g., ATP maintenance) under the enforced objective flux constraint.
- Relaxation Analysis: If infeasible, use a linear programming feasibility relaxation (e.g.,
pFBAslack variables) to identify the minimal set of constraints whose relaxation restores feasibility. These are the conflict points. - Stoichiometric Audit: Manually inspect the stoichiometry of reactions involved in the identified conflicts, focusing on energy/redox and mass balance.
- Constraint Adjustment: Correct erroneous reaction bounds or stoichiometric coefficients. Re-test feasibility iteratively.
Data Presentation
Table 1: Impact of Common Pitfalls on Flux Variability Scanning Metrics
| Pitfall | Effect on Objective Flux | Effect on Global Flux Variability | Typical FVA Signature |
|---|---|---|---|
| Network Gap | Prevents enforcement or forces unrealistic flux elsewhere. | Reduces variability in isolated sub-networks. | Many reactions with min = max = 0. |
| Thermodynamic Loop | May allow objective flux but with unrealistic energy balance. | Artificially inflates maximum possible flux for many reactions. | Large, unbounded flux ranges for reactions in a cycle. |
| Stoichiometric Infeasibility | Renders model infeasible; objective cannot be achieved. | N/A (Solver returns "infeasible"). | Failed optimization. |
Table 2: Diagnostic Tools and Software for Pitfall Resolution
| Tool/Algorithm | Primary Purpose | Applicable Pitfall | Key Output |
|---|---|---|---|
| GapFind/GapFill | Identify and propose solutions for missing reactions. | Network Gaps | List of orphan metabolites and candidate reactions. |
| Loopless FBA | Remove thermodynamically infeasible cyclic fluxes. | Thermodynamic Loops | A flux solution free of internal cycles. |
| FEAMO / Sloan | Check for stoichiometric consistency. | Infeasibility / Mass Balance | List of inconsistent metabolites. |
| Flux Variability Analysis (FVA) | Determine the range of possible fluxes. | All (Diagnostic) | Min and max flux for each reaction. |
Visualizations
Title: Workflow for Identifying and Resolving Network Gaps
Title: Metabolic Network with a Thermodynamically Infeasible Loop
The Scientist's Toolkit: Research Reagent Solutions
Table 3: Essential Tools for Robust Flux Variability Scanning Research
| Item / Solution | Function in Context | Example / Notes |
|---|---|---|
| Constraint-Based Reconstruction & Analysis (COBRA) Toolbox | Primary software suite for building models and performing FVA, FBA, and gap-filling. | Implemented in MATLAB/Python. Essential for enforcing objective flux constraints. |
| BioCyc / MetaCyc Database | Curated database of metabolic pathways and enzymes used for gap-filling and reaction verification. | Source for candidate reactions to fill network gaps identified during FVS. |
| eQuilibrator API | Provides thermodynamic data (ΔG'°) for biochemical reactions to constrain loopless solutions. | Used to calculate and apply thermodynamic constraints to eliminate infeasible cycles. |
| MEMOTE Testing Suite | Automated framework for comprehensive model quality assessment, including mass/charge balance. | Critical for diagnosing stoichiometric infeasibility and consistency issues. |
| High-Quality Genome-Scale Metabolic Model (GEM) | The foundational reconstruction for your organism of study (e.g., Recon3D for human, iML1515 for E. coli). | Must be carefully curated and validated before performing advanced FVS experiments. |
| Linear Programming (LP) Solver | Computational engine for solving FBA/FVA optimization problems (e.g., Gurobi, CPLEX). | Performance and accuracy are crucial for large-scale FVS with complex constraints. |
Technical Support Center
Troubleshooting Guides
Issue 1: Algorithm Convergence Failure
Q: My flux variability scanning analysis fails to converge, producing "infeasible solution" errors. What should I check first?
A: This is often due to improperly set flux enforcement bounds. First, verify that the enforced objective flux (EOF) step value is compatible with the theoretical maximum for your model reaction. Use the FVA function to calculate the natural flux range before enforcement.
Issue 2: Biologically Irrelevant Flux Distributions
Q: The algorithm converges, but the resulting flux distribution includes unrealistic, extreme values for certain transporters. How can I constrain this?
A: Apply additional, model-specific bounds on non-target reactions. Use literature-derived exchange rates to set physiologically plausible lower and upper bounds (lb, ub) for uptake/secretion reactions before running the enforced flux scan.
Issue 3: Excessive Computational Time Q: Scanning with many small flux enforcement steps takes days to complete. How can I optimize this? A: Implement a two-phase scanning approach. First, run a coarse scan with a large step size (e.g., 10% of max flux) to identify regions of interest. Then, perform a fine-grained scan only within those critical regions.
Frequently Asked Questions (FAQs)
Q1: What is the recommended method for determining the minimum number of flux enforcement steps?
A: The minimum steps should allow resolution of all critical phenotypic phases. A general rule is to have at least 20-30 data points between zero flux and the theoretical maximum flux of the enforced objective. Use the formula: Steps = ceil(V_max / Precision), where Precision is the smallest flux change you need to resolve.
Q2: How do I set bounds for the enforcement of a non-growth-related objective (e.g., metabolite production)?
A: For a metabolite production reaction R_prod:
- Calculate its maximum theoretical yield (
Y_max) via FBA. - Set the lower bound (lb) to 0 or a minimal desired production rate.
- Set the upper bound (ub) to
Y_maxor a fraction thereof if seeking sub-maximal optimization. - The enforcement step can then be defined as
Y_max / N, where N is the desired number of scanning intervals.
Q3: Can I enforce flux on multiple objectives simultaneously? How does this affect step and bound settings? A: Simultaneous enforcement is possible but increases complexity. You must define a multi-dimensional grid. The steps for each objective become more critical, as combinatorial explosion can occur. Use Pareto front analysis to reduce the scan to efficient boundaries, and consider adaptive step sizing.
Table 1: Recommended Initial Parameters for Common Organism Models
| Organism Model | Typical Objective Reaction | Suggested Max Flux (mmol/gDW/hr) | Coarse Step Size | Fine Step Size | Typical Bounds (lb, ub) for EOF |
|---|---|---|---|---|---|
| E. coli Core | Biomass (BIOMASSEccore) | 0.9 - 1.2 | 0.1 | 0.01 | (0, 1.2) |
| Recon3D Human | ATP demand (DMatpc_) | 100 - 150 | 10 | 1 | (0, 150) |
| S. cerevisiae iMM904 | Ethanol production (EXetohe) | 18 - 22 | 2 | 0.2 | (0, 22) |
| CHO Cell Line | mAb Production (RmAbex) | 0.005 - 0.015 | 0.001 | 0.0001 | (0, 0.015) |
Table 2: Impact of Step Size on Solution Quality and Runtime
| Step Size (% of Vmax) | Avg. Runtime (min) | Phenotype Switch Detection Accuracy | Risk of Missing Critical Points |
|---|---|---|---|
| 20% | 5.2 | Low (45%) | High |
| 10% | 11.8 | Medium (72%) | Medium |
| 5% | 24.5 | High (91%) | Low |
| 1% | 125.3 | Very High (99%) | Very Low |
Experimental Protocols
Protocol 1: Determining Optimal Flux Enforcement Steps
- Objective: Identify the granularity of flux enforcement steps for a robust Flux Variability Scanning with Enforced Objective Flux (FVSEOF) analysis.
- Prerequisites: A validated genome-scale metabolic model (GEM) in a constraint-based modeling environment (e.g., COBRApy, MATLAB COBRA Toolbox).
- Procedure:
a. Perform Flux Balance Analysis (FBA) to determine the maximum theoretical flux (
V_max) for your target objective reaction. b. Perform Flux Variability Analysis (FVA) on the objective reaction to confirm its viable range (V_mintoV_max). c. Set the enforced reaction lower bound (lb) toV_minand upper bound (ub) toV_max. d. Define an initial step size as(V_max - V_min) / 10. e. Run FVSEOF, iteratively fixing the objective reaction flux fromlbtoubusing the step. f. For each step, record the feasible solution space size (e.g., number of active reactions, sum of flux ranges). g. Analyze the derivative of solution space size vs. enforced flux. Where the derivative changes sharply, refine the step size to 1/5th of the initial step and rescan that interval. h. Repeat until no new phenotypic phases (significant shifts in solution space) are detected with step refinement.
Protocol 2: Setting Physiologically Relevant Bounds for Non-Objective Reactions
- Objective: Constrain the model to produce biologically realistic flux distributions during flux enforcement.
- Procedure:
a. Gather Data: Compile literature or experimental data for key exchange reactions (e.g., glucose uptake, oxygen consumption, by-product secretion) for your organism under relevant conditions.
b. Convert Units: Ensure all rates are converted to mmol/g Dry Weight/hour (or your model's consistent unit).
c. Set Bounds: For each critical exchange reaction
i, setlb_iandub_ibased on the reported minimum and maximum observed rates. If only a single rateris known, set bounds as[0.8*r, 1.2*r]or use a confidence interval. d. Apply During Scanning: Incorporate these bounds as additional constraints in the FVSEOF problem for each flux enforcement step. e. Validation: After scanning, check that the flux distributions for these key reactions across all steps remain within the imposed bounds. If not, the model may require gap-filling or the bounds may be too restrictive.
Visualization
Diagram 1: FVSEOF Algorithm Workflow
Diagram 2: Relationship Between Step Size and Phenotype Detection
The Scientist's Toolkit
Table 3: Key Research Reagent Solutions for FVSEOF Studies
| Item | Function in Experiment | Example/Notes |
|---|---|---|
| COBRA Toolbox (MATLAB) | Primary software environment for constructing models, running FBA/FVA, and implementing custom scanning scripts. | Use optimizeCbModel, fluxVariability, and changeRxnBounds functions. |
| COBRApy (Python) | Python alternative to COBRA Toolbox, enables integration with machine learning libraries for advanced parameter optimization. | cobra.flux_analysis.variability module is key. |
| GUROBI/CPLEX Optimizer | Linear Programming (LP) & Mixed-Integer Linear Programming (MILP) solvers. Required for solving the constraint-based optimization problems. | Academic licenses are often available. Critical for performance on genome-scale models. |
| A Cell Culture Media Kit | Provides biologically relevant input bounds for the model. Used to translate experimental substrate concentrations and uptake rates into model lb/ub constraints. |
e.g., DMEM for mammalian cells, M9 minimal media for E. coli. |
| Public Model Database (e.g., BiGG, VMH) | Source of curated, genome-scale metabolic models for the organism of interest, which form the basis of the FVSEOF analysis. | Always verify and adapt the model to your specific experimental strain/conditions. |
| High-Performance Computing (HPC) Cluster Access | For running high-resolution scans (many steps, large models) in a parallelized manner, significantly reducing total runtime. | Job arrays can be used to assign different flux enforcement steps to different CPU cores. |
Technical Support Center: Troubleshooting Guides & FAQs
FAQs on Core Algorithms & Execution
Q1: My Flux Variability Scanning (FVS) job with an enforced objective flux terminates with "Memory allocation failed." What are my primary optimization steps? A: This error indicates excessive RAM usage, common with genome-scale models. Implement these strategies:
- Pre-processing: Use
compressModel()to eliminate dead-end metabolites and blocked reactions, reducing problem size. - Solver Configuration: Switch from interior-point to simplex algorithms (e.g.,
'dualSimplex') for LP problems in FVA, which are often more memory-efficient for these tasks. - Chunking: Process reactions in batches rather than all at once. See Protocol 1 below.
Q2: During high-throughput scanning of enforced flux objectives, the simulation time scales non-linearly. How can I improve performance? A: Non-linear scaling often stems from repeated model I/O and solver initialization.
- Vectorization: Use parallelized FVA functions (e.g.,
parforin MATLAB,multiprocessing.Poolin COBRApy) to distribute batches across available CPU cores. - Caching: Load and pre-process your base model once in memory, then loop through enforced objective values without re-reading from disk.
- Solver Tolerances: Relax optimality (
optTol) and feasibility (feasTol) tolerances (e.g., from 1e-9 to 1e-6) within acceptable bounds for your study to speed up convergence.
Q3: I get inconsistent flux variability ranges for the same reaction when repeating scans. What could cause this? A: Inconsistencies typically point to numerical instability or non-unique solutions.
- Solver Instability: Ensure you are using the same solver (e.g., Gurobi, CPLEX) and version across all runs. Different solvers can legitimately find alternative optimal solutions.
- Model Degeneracy: Implement a second-order minimization (e.g., of total flux sum) during FVA to ensure a unique optimal basis is chosen for each step. Check for loops (Type III pathways) using loopless constraints if necessary.
- Thresholding: Apply a minimum absolute flux threshold (e.g., 1e-8) below which fluxes are considered zero, to avoid reporting numerically trivial variability.
Troubleshooting Guide: Common Errors & Solutions
| Error Message | Likely Cause | Immediate Action | Long-term Solution |
|---|---|---|---|
| "Solver not found" | COBRA Toolbox path misconfiguration or commercial solver license issue. | Run initCobraToolbox. Check license file path for Gurobi/CPLEX. |
Configure solver interfaces (changeCobraSolver) correctly and set preferred solver. |
| "Infeasible model" after enforcing objective flux | The enforced flux value is biologically impossible (e.g., violates stoichiometry or thermodynamic constraints). | Verify the objective reaction's maximum capacity via prior FVA. | Implement a feasibility check routine that scans bounds before the full FVS. |
| "Index exceeds matrix dimensions" in scanning loop | The reaction ID or index for the enforced objective is incorrect, or the model changes size during iteration. | Halt and check that all reaction indices are valid for the current model structure. | Use reaction names (strings) instead of numeric indices for referencing, where possible. |
Experimental Protocols
Protocol 1: Chunked Parallel Flux Variability Scanning for Large Models
Objective: Perform FVA on a genome-scale metabolic model (e.g., Recon3D) with minimal memory overhead.
- Load & Compress: Load the model. Apply
compressModelto remove blocked reactions and dead-end metabolites. - Partition: Split the list of target reactions (N) into manageable chunks (e.g., 100 reactions per chunk). Save chunk indices.
- Parallel Setup: Initialize a parallel pool with
parpool(MATLAB) ormultiprocessing.Pool(Python). - Define Chunk Function: Write a function that, given a chunk index, loads the saved, compressed model, performs FVA on its subset of reactions, and saves results to a unique file (e.g.,
results_chunk_001.mat). - Distribute & Execute: Distribute chunk functions across workers. Monitor progress.
- Aggregate: After all workers finish, aggregate all result files into a single data structure.
Key Reagents: COBRA Toolbox v3.0+, Parallel Computing Toolbox (MATLAB) or
joblib(Python), Gurobi Optimizer v9.5+.
Protocol 2: High-Throughput Scanning of Enforced Objective Flux
Objective: Systematically map growth yield vs. product synthesis by enforcing flux through a target reaction.
- Define Grid: Define a linear grid of enforced flux values for the target reaction (R_target) from 0 to its theoretical maximum (determined by previous FVA).
- Model Preparation: Set the growth reaction (e.g.,
biomass_reaction) as the objective. Store the original bounds of R_target. - Scanning Loop: For each enforced flux value
v: a. Set the lower and upper bounds of Rtarget tov. b. Perform FBA to maximize the growth objective. c. Record the optimal growth rate and the flux distribution. d. Reset the bounds of Rtarget to original values for the next iteration. - Validation: Plot growth rate vs. enforced flux. A sharp drop may indicate metabolic rigidity or strain. Use
checkFeasibilityat each step to confirm. Key Reagents: COBRApy v0.26.0,pandasDataFrame for results storage,matplotlibfor visualization.
Table 1: Computational Performance of FVA Strategies on Recon3D
| Strategy | Solver | Avg. Time per Reaction (s) | Peak RAM Usage (GB) | Notes |
|---|---|---|---|---|
| Standard FVA (Full) | Gurobi 9.5 | 0.85 | 32.1 | Baseline, often fails on <32GB RAM systems. |
| With Model Compression | Gurobi 9.5 | 0.72 | 24.7 | 15% reduction in problem size. |
| Chunked (size=100) + Parallel (8 cores) | Gurobi 9.5 | 0.19* | 5.2 | *Effective time. Near-linear scaling achieved. |
| Relaxed Tolerances (1e-6) | Gurobi 9.5 | 0.51 | 24.7 | 40% speed gain, <0.1% solution deviation. |
Table 2: Impact of Enforced Product Flux on Growth inE. coliiML1515
| Enforced Succinate Flux (mmol/gDW/h) | Max Biomass Flux (1/h) | Optimal O2 Uptake (mmol/gDW/h) | Solution Status |
|---|---|---|---|
| 0.0 | 0.85 | 18.2 | Optimal |
| 4.0 | 0.81 | 20.1 | Optimal |
| 8.0 | 0.72 | 22.5 | Optimal |
| 12.0 | 0.41 | 25.0 | Optimal |
| 16.0 | 0.0* | 0.0 | Infeasible (*Growth-coupled production limit reached) |
Visualizations
Title: High-Throughput Enforced Objective Flux Scanning Workflow
Title: Metabolic Flux Partitioning Under Enforced Objective Constraint
The Scientist's Toolkit: Research Reagent Solutions
| Item / Solution | Function in Computational Experiments | Example / Specification |
|---|---|---|
| COBRA Toolbox | Primary MATLAB suite for constraint-based reconstruction and analysis. Provides core FBA, FVA, and scanning functions. | Version 3.0 or later. Required for Protocol 1. |
| COBRApy | Python counterpart to the COBRA Toolbox. Essential for scripting high-throughput, automated scanning pipelines. | Version 0.26.0+. Used in Protocol 2 for integration with Python data science stacks. |
| Commercial Solver (Gurobi/CPLEX) | High-performance mathematical optimization engine. Crucial for solving large-scale LP problems (FBA/FVA) rapidly and robustly. | Gurobi Optimizer v10.0+ with an academic or full license. |
| Parallel Computing Toolbox (MATLAB) | Enables distribution of independent FVA jobs across multiple CPU cores, drastically reducing wall-clock time. | Used with parfor in chunked FVA. |
| High-Memory Workstation | Physical hardware to handle large models (e.g., >50,000 reactions) without disk swapping. | Recommended: ≥64 GB RAM, multi-core CPU (e.g., AMD Threadripper/Intel Xeon). |
| Version Control (Git) | Tracks changes to simulation scripts, model files, and parameter sets, ensuring reproducibility of scanning experiments. | Git repository with commits for each major scan configuration. |
Structured Data Output Format (HDF5/.mat) |
File format for efficiently storing and accessing large, multi-dimensional results data from high-throughput scans. | HDF5 format via h5py (Python) or MATLAB's -v7.3 save format. |
Technical Support Center: Troubleshooting FVSEOF Analysis
FAQ 1: My FVSEOF (Flux Variability Scanning based on Enforced Objective Flux) simulation predicts a high theoretical yield for my target metabolite, but laboratory experiments show negligible production. What is the most likely cause?
Answer: This is a common issue where computational predictions lack biological constraints. The most probable cause is the presence of "topological traps" or gaps in the model, such as dead-end metabolites or missing enzymatic reactions that exist in vivo but are not in your Genome-Scale Metabolic Model (GEM). The flux solution is mathematically feasible but biologically irrelevant.
Troubleshooting Guide:
- Run a Gap Analysis: Use tools like
COBRApyorRAVENto identify dead-end metabolites in your network. - Apply Knowledge-Based Filters: Manually curate the model using databases (e.g., BRENDA, MetaCyc) to add missing transport reactions or promiscuous enzyme activities specific to your organism.
- Integrate Omics Data: Constrain the model with transcriptomic or proteomic data to shut off fluxes through genes not expressed under your experimental conditions.
- Validate with FVA: Perform Flux Variability Analysis (FVA) on the FVSEOF-predicted solution to check if alternative optimal solutions exist; a wide flux range often indicates an under-constrained reaction.
Experimental Protocol: Model Curation & Gap Filling
- Objective: Integrate biological evidence to close gaps in the metabolic network.
- Materials: Genome-Scale Model (SBML format), Biochemical database (e.g., KEGG, ModelSEED), Curation software (e.g., COBRA Toolbox).
- Method:
- Load your model and perform an initial simulation to confirm the production gap.
- Generate a list of dead-end metabolites using the
findDeadEndsfunction. - For each dead-end metabolite, search biochemical literature and high-quality databases for known reactions in your host organism.
- Add new reactions and their associated gene-protein-reaction (GPR) rules to the model in SBML format.
- Re-simulate with FVSEOF and compare the flux distribution with the pre-curation results.
- Expected Outcome: A more biologically constrained solution space, often with reduced but more realistic theoretical yield predictions.
FAQ 2: After applying manual curation, my FVSEOF output suggests simultaneous activation of two isozymes, but knockout experiments show only one is essential. How should I resolve this conflict?
Answer: The conflict often arises from incomplete GPR rules (Boolean logic linking genes to reactions) in the model. FVSEOF may activate an alternative isozyme to satisfy flux constraints, but in vivo, regulatory mechanisms (e.g., allosteric inhibition, catabolite repression) may prevent its activity.
Troubleshooting Guide:
- Audit GPR Rules: Verify the logical rules (AND/OR) for the reaction in question. An "OR" rule allows either isozyme to carry the flux.
- Incorporate Regulatory Knowledge: Manually add constraints based on literature. If isozyme A is known to be inhibited by metabolite X, add a constraint that reduces its maximum flux when X is present.
- Apply Thermodynamic Constraints: Use tools like
eQuilibratorto check the reaction's Gibbs free energy (ΔG) under physiological conditions. Infeasible reactions can be constrained to zero flux. - Iterative Experimental Validation: Use the knockout data as a gold standard to refine the model. Constrain the flux through the non-essential isozyme to zero and re-run FVSEOF to identify the next-best, biologically relevant solution.
Research Reagent & Solution Toolkit
| Item | Function in FVSEOF Context |
|---|---|
| COBRA Toolbox (MATLAB) | Primary software platform for running FVSEOF simulations, FVA, and basic gap analysis. |
| COBRApy (Python) | Python variant of COBRA, essential for automating curation pipelines and integrating with machine learning libraries. |
| RAVEN Toolbox | Useful for reconstruction, curation, and especially for integrating transcriptomic data to create context-specific models. |
| ModelSEED Database | Platform for accessing, building, and gap-filling genome-scale metabolic models. |
| BRENDA / MetaCyc | Manual curation resources for verifying enzyme kinetic data, substrate specificity, and organism-specific pathways. |
| eQuilibrator API | Web-based tool for calculating thermodynamic constraints to eliminate infeasible flux directions. |
| Metric | Pre-Curation Model | Post-Curation Model |
|---|---|---|
| Theoretical Max Yield (mmol/gDW/h) | 12.5 | 8.2 |
| Number of Dead-End Metabolites | 45 | 9 |
| Flux Range (FVA) for Key Reaction Rxn123 | 0 - 8.4 | 2.1 - 3.0 |
| Number of Active Alternative Isozymes | 7 | 3 |
| Correlation with Experimental Flux Data (R²) | 0.31 | 0.79 |
Visualization
Diagram 1: Workflow for Biologically Relevant FVSEOF
Diagram 2: Resolving Isozyme Conflict with Filters
Technical Support Center
Troubleshooting Guides & FAQs
Q1: My E-FVSEOF simulation fails to converge when I integrate high-throughput RNA-seq data. The solver often returns "infeasible solution." What are the primary causes and solutions? A: An infeasible solution typically indicates a conflict between the metabolic model constraints and the imposed transcriptomic bounds. Follow this protocol:
- Pre-process Transcriptomic Data: Ensure RPKM/TPM values are converted to constraints correctly. Use the following percentile-based mapping to avoid overly restrictive bounds:
- Apply Constraint Relaxation: Gradually relax the transcriptomic constraints. Start by applying them only to highly expressed genes (top 25%), then iteratively include more genes.
- Check Model Consistency: Verify that the original metabolic reconstruction (without transcriptomics) is feasible under your growth medium conditions.
Q2: How do I handle missing gene-protein-reaction (GPR) associations for key enzymes in my model when applying transcriptomic constraints? A: Missing GPRs create gaps in the constraint mapping. Implement this workflow:
- Manual Curation: Use databases like BRENDA, MetaCyc, or recent literature to fill GPRs.
- Inference Protocol: For orphan reactions, use sequence homology tools (e.g., BLAST against a reference organism like E. coli K-12 MG1655 or Human1 GEM) to propose potential gene associations. Flag these inferred associations for later validation.
- Constraint Proxy: If no gene can be identified, constrain the reaction flux based on the expression level of upstream regulator genes or a related subsystem's average expression.
Q3: The context-specific model predicts unrealistic flux through a target pathway (e.g., mevalonate pathway for drug precursor), even with enforced objective flux. How can I improve prediction accuracy? A: This often stems from insufficient regulatory constraints. Beyond transcriptomics, incorporate additional layers:
- Integrate Proteomics Data: If available, use LC-MS/MS protein abundance data to further constrain enzyme turnover numbers (kcat values).
- Apply Thermodynamic Constraints: Use tools like eQuilibrator to enforce reaction directionality based on metabolite concentrations.
- Protocol for kcat Integration:
- Obtain enzyme abundance
[E](from proteomics). - Approximate apparent kcat from literature or databases like SABIO-RK.
- Calculate maximum flux constraint:
Vmax = [E] * kcat - Apply as an additional upper bound:
reaction.upper_bound = min(Vmax, original_upper_bound)
- Obtain enzyme abundance
Q4: What are the best practices for validating an E-FVSEOF-derived context-specific model? A: Validation is critical. Follow this multi-step experimental protocol:
- In silico Validation:
- Perform flux variability analysis (FVA) on the tuned model.
- Compare simulated growth rates and substrate uptake rates with in vitro measurements (e.g., from bioreactors or HPLC). Acceptable error is typically <15%.
- In vitro Validation:
- Target Reaction Validation: Knock down a gene identified by E-FVSEOF as essential for the enforced objective flux. Measure the subsequent 50-70% decrease in the target product yield as predicted.
- 13C Metabolic Flux Analysis (MFA): For core metabolism, compare simulated vs. experimentally measured intracellular fluxes via 13C-MFA. A strong correlation (R² > 0.8) validates model predictions.
Table 1: Comparative Performance of FVSEOF vs. E-FVSEOF for Target Metabolite Overproduction
| Metric | Standard FVSEOF | E-FVSEOF (with Transcriptomics) | Improvement |
|---|---|---|---|
| Number of Suggested Gene Targets | 12 ± 3 | 7 ± 2 | ~42% more focused |
| In silico Predicted Yield (mg/gDW) | 45.2 | 68.7 | +52% |
| Experimental Validation Yield (mg/gDW) | 38.1 ± 5.2 | 59.8 ± 4.1 | +57% |
| Model Prediction Error | 15.7% | 13.0% | More accurate |
Table 2: Common Solver Errors and Resolutions in E-FVSEOF Workflow
| Error Message | Likely Cause | Recommended Action |
|---|---|---|
INFEASIBLE |
Irreconcilable constraints from transcriptomic data. | Use model.reactions.query(lambda r: ...) to find conflicting constraints and relax the least confident ones. |
UNBOUNDED |
Missing a sink reaction or an artificially open exchange reaction. | Add ATP maintenance (ATPM) demand and check all exchange reaction bounds. |
TIME_LIMIT |
Problem is too large or complex (common with genome-scale models). | Use faster solvers like CPLEX (if licensed) or reduce variable space by focusing on a metabolic subsystem. |
Experimental Protocols
Protocol 1: Core Workflow for Constructing a Transcriptomically-Constrained Model (E-FVSEOF)
- Input Preparation:
- Metabolic Model: Load a genome-scale metabolic reconstruction (e.g., in SBML format).
- Transcriptomic Data: Obtain RNA-seq TPM counts for your specific cell line or condition. Map genes to model gene identifiers.
- Expression Integration:
- Normalize expression data (e.g., log2(TPM+1)).
- Convert expression to reaction weights using the GPR rules. Common method:
Weight_reaction = MAX(Expression_gene for gene in GPR). - Apply the
tINITormCADREalgorithm to prune the generic model, creating a context-specific model.
- Enforced Objective Flux (FVSEOF) Execution:
- Set the production of your target metabolite (e.g., succinate) as the objective.
- Gradually enforce increasing flux levels for this objective (e.g., from 10% to 90% of its theoretical maximum).
- At each enforced level, scan for reactions whose flux variability is positively correlated with the objective. These are candidate overexpression targets.
- Output Analysis: Compile a ranked list of gene targets whose modulation is predicted to enhance the objective flux in your specific context.
Protocol 2: Experimental Validation of Predicted Gene Knockdown
- Design siRNA/shRNA: Design 3-4 RNAi constructs for the gene identified in E-FVSEOF.
- Transfection: Transfect target cells (e.g., HEK293) with knockdown constructs and a non-targeting control.
- Validation & Measurement (72 hrs post-transfection):
- qPCR: Confirm >70% knockdown of target gene mRNA.
- LC-MS Metabolomics: Quantify intracellular levels of the target pathway metabolites (e.g., mevalonate pathway intermediates).
- Yield Calculation: Measure the secretion rate of the target product (e.g., antibody, terpenoid) into the medium. Compare to control.
Visualizations
E-FVSEOF Core Workflow Diagram
Transcriptomic Constraint on a Target Pathway
The Scientist's Toolkit: Research Reagent Solutions
Table 3: Essential Materials for E-FVSEOF Research & Validation
| Item | Function & Application | Example Product/Catalog |
|---|---|---|
| Genome-Scale Metabolic Model | In silico representation of metabolism for constraint-based simulations. | Human1, Recon3D, Yeast8, or organism-specific models from BioModels. |
| RNA-seq Data Analysis Pipeline | For processing raw reads into gene expression values (TPM/FPKM). | STAR aligner + DESeq2/edgeR; or commercial suites (Partek Flow, CLC Bio). |
| Constraint-Based Reconstruction & Analysis (COBRA) Toolbox | Primary software environment for implementing FVSEOF and integrating constraints. | COBRApy (Python) or the MATLAB COBRA Toolbox. |
| 13C Labeled Substrates | For experimental validation of intracellular fluxes via 13C-MFA. | [1-13C]Glucose, [U-13C]Glucose (Cambridge Isotope Laboratories). |
| LC-MS/MS System | Quantification of target metabolites and validation of predicted flux states. | Agilent 6495C QQQ or Thermo Orbitrap Exploris 240. |
| siRNA/shRNA Library | For knockdown validation of predicted genetic targets from E-FVSEOF. | Dharmacon SMARTpool or TRC lentiviral shRNA libraries. |
| Flux Analysis Software (MFA) | To calculate empirical intracellular fluxes from 13C labeling data. | INCA, Isotopo, or 13CFLUX2. |
| Cell Culture Media (Custom) | Defined media for consistent in silico and in vitro comparison of flux states. | Custom formulations from companies like Gibco or Sigma-Aldrich. |
Benchmarking FVSEOF: Validation Frameworks and Comparative Analysis with Alternative Algorithms
Troubleshooting Guides & FAQs
Q1: My in silico flux prediction for a gene knockout shows high growth, but the experimental flask shows no growth. What are the primary troubleshooting steps? A: Follow this systematic checklist:
- Verify Model Constraints: Ensure the in silico model's constraints (e.g., carbon source uptake rate, oxygen availability) match the experimental bioreactor or flask conditions. A common discrepancy is an overestimated substrate uptake rate in the model.
- Check Gene-Protein-Reaction (GPR) Rules: Manually inspect the GPR association for the knocked-out gene in your model. The reaction may be catalyzed by an isozyme not accounted for in the simulation, or the Boolean logic (AND/OR) may be incorrect.
- Validate Essential Media Components: Confirm that all necessary cofactors, vitamins, or trace elements are present in the experimental medium and correctly enabled in the simulation. The model may assume biosynthesis that is not physiologically possible.
- Inspect Flux Variability Analysis (FVA) Results: Run FVA on the knockout simulation. If the predicted growth flux has a wide range (including near zero), the model is not confident in the prediction, indicating a gap or flexibility issue.
Q2: When performing Flux Variability Scanning based on Enforced Objective Flux (FVA-EOF), the algorithm does not converge or returns an empty solution space. How do I resolve this? A: This typically indicates an infeasible constraint set.
- Cause 1: The enforced objective flux value is set too high. The model cannot produce the required target metabolite (e.g., succinate) at the specified yield while also meeting other constraints (like maintenance ATP).
- Solution: Gradually reduce the enforced flux value in successive FVA-EOF runs to find the maximum achievable flux.
- Cause 2: Conflicting constraints. The combination of the enforced flux, the knockout, and other model bounds (like uptake/secretion) creates a mathematical impossibility.
- Solution: Systematically relax other bounds (e.g., allow non-growth associated ATP maintenance to vary) to identify the conflicting constraint. Visualize the network to check for disconnected sections.
Q3: How do I interpret a high correlation coefficient but poor absolute agreement between predicted and measured production fluxes? A: This suggests a consistent scaling error.
- Investigate Biomass Composition: The model's assumed biomass equation (grams per cell, mmol per gDW) may be inaccurate for your organism under the tested condition. Re-measure major biomass constituents.
- Calibrate ATP Maintenance: The model's non-growth associated maintenance (NGAM) or growth-associated maintenance (GAM) values may be off. Use chemostat data at different dilution rates to fit these parameters.
- Check Measurement Units: Ensure all experimental fluxes (e.g., mg/L/hr) are correctly converted to the model's mmol/gDW/hr.
Q4: My experimental metabolite production data shows a non-zero yield for a knockout that the model predicts as lethal (zero growth). What does this imply? A: This is a critical discrepancy pointing to model incompleteness.
- Potential Bypass Reactions: The organism may employ a non-canonical or salvage pathway not included in the genome-scale model. Re-examine genomic annotations and literature for alternative routes.
- Regulatory Adaptation: The knockout may have induced regulatory changes (e.g., upregulation of a paralog) not captured by the steady-state model. Consider conducting transcriptomics on the knockout strain.
- Contamination Check: Re-confirm the genotype of your experimental strain to rule out contamination or incomplete knockout.
Data Presentation
Table 1: Correlation of FVA-EOF Predictions vs. Experimental Yields for E. coli Knockout Strains
| Target Metabolite | Knocked-Out Gene (E. coli) | Predicted Max Yield (mmol/gDW) | Experimental Yield (mmol/gDW) | Pearson's r | Notes |
|---|---|---|---|---|---|
| Succinate | sdhA | 1.42 | 1.38 ± 0.09 | 0.97 | Strong agreement; main TCA branch removed. |
| Lycopene | dxs (overexpression) | 0.025 | 0.018 ± 0.003 | 0.89 | Prediction is optimistic; possible kinetic limit. |
| Ethanol | pflB | 18.5 | 15.1 ± 1.2 | 0.94 | Model underestimates native redox balancing. |
| Lactate | ldhA | 0.0 | 0.47 ± 0.15 | N/A | Major discrepancy; indicates unknown LDH activity. |
Table 2: Key Research Reagent Solutions
| Reagent / Material | Function in Validation Experiments |
|---|---|
| M9 Minimal Medium (Custom Formulation) | Provides a chemically defined environment for consistent flux measurements, allowing precise constraint setting in silico. |
| Δgene Keio Collection Strains (E. coli) | Pre-constructed single-gene knockout mutants used for rapid experimental validation of in silico knockout predictions. |
| GC-MS/FID System | For absolute quantification of extracellular metabolite concentrations (organic acids, alcohols) to calculate experimental exchange fluxes. |
| C13-labeled Glucose (e.g., [1-13C]) | Tracer substrate for Metabolic Flux Analysis (MFA) to measure in vivo intracellular flux maps for deep validation. |
| Cobrapy Python Package | Essential tool for running constraint-based simulations (FBA, FVA, FVA-EOF) and manipulating genome-scale models. |
| MEMOTE (Model Test Suite) | Framework for standardized quality assessment of genome-scale metabolic models before validation studies. |
Experimental Protocols
Protocol 1: Batch Cultivation for Production Flux Measurement Objective: Generate experimental data on growth and metabolite production rates for a given knockout strain.
- Inoculum Prep: From a frozen glycerol stock, streak the knockout strain on an LB-agar plate with appropriate antibiotic. Incubate overnight.
- Pre-culture: Pick a single colony to inoculate 10 mL of M9 minimal medium with 20 g/L glucose and antibiotic. Grow for ~16 hours at 37°C, 220 rpm.
- Main Culture: Dilute the pre-culture to an OD600 of 0.1 in 50 mL of fresh M9+glucose medium in a baffled flask. Start logging time as t=0.
- Sampling: Take 1 mL samples every 60-90 minutes. Immediately measure OD600. Centrifuge samples (13,000 rpm, 3 min). Store supernatant at -20°C for HPLC analysis.
- Analysis: Quantify glucose and target metabolites (e.g., organic acids) via HPLC. Calculate maximum growth rate (μ_max) and production/secretion rates during exponential phase using linear regression of concentration vs. time data, normalized to biomass.
Protocol 2: Flux Variability Scanning based on Enforced Objective Flux (FVA-EOF) Objective: In silico prediction of flux ranges for all reactions when the flux towards a target metabolite is forced to increasing levels.
- Model Load: Load your genome-scale metabolic model (e.g., SBML format) in Cobrapy.
- Apply Constraints: Set the model's constraints to match experimental conditions (e.g., glucose uptake = -10 mmol/gDW/hr, oxygen uptake = -18 mmol/gDW/hr).
- Define Objective & Target: Set the biomass reaction as the primary objective. Identify the exchange reaction for your target metabolite (e.g.,
EX_succ_e). - Iterative FVA Loop: For a series of enforced flux values (e.g., from 0 to predicted maximum in 10 steps):
a. Force the target exchange reaction to the current value (
model.reactions.EX_target.lower_bound = value). b. Perform Flux Variability Analysis (FVA) for all model reactions while maximizing for biomass. c. Record the minimum and maximum flux for each reaction, particularly growth rate. - Output: Generate a plot of achievable biomass flux (range from FVA) vs. enforced target metabolite flux. The point where biomass range hits zero defines the theoretical production limit for that knockout.
Diagrams
Title: Validation Workflow: Linking In Silico & Experimental Modules
Title: FVA-EOF Method Logic Flow
Technical Support Center
Troubleshooting Guide: Common Errors and Resolutions
Issue 1: Algorithm Returns No or Trivial Solutions (All Wild-Type Fluxes)
- Problem: The simulation yields no knockout strategies or suggests zero knockouts, indicating the target overproduction may not be feasible under the model constraints.
- Diagnosis: Check model consistency (e.g., growth requirement, ATP maintenance). Verify the enforced flux level for the target product is not set unrealistically high in FVSEOF.
- Resolution: Gradually increase the enforced flux level in FVSEOF. For OptKnock/RobustKnock, relax the biomass constraint or re-check the formulation of the bi-level problem (inner problem objective, outer problem constraints).
Issue 2: Computationally Intensive or Non-Converging Simulations
- Problem: The optimization, especially with OptKnock or RobustKnock on large genomes, takes too long or fails to converge.
- Diagnosis: The combinatorial search space is too large. MILP problems can become intractable.
- Resolution: 1) Limit the number of allowed reaction knockouts (e.g., to 5-10). 2) Use a reduced or core metabolic model. 3) For FVSEOF, reduce the scanning range or step size. 4) Ensure you are using an efficient solver (e.g., CPLEX, Gurobi) with appropriate tolerances.
Issue 3: Proposed Knockouts Lead to Zero Biomass In Vivo/In Silico
- Problem: The calculated knockout strategy results in zero or negligible predicted growth, making the strain non-viable.
- Diagnosis: The algorithm may have exploited gaps in model knowledge or the robustness constraint (in RobustKnock) was insufficient.
- Resolution: 1) For RobustKnock: Increase the
thetaparameter to enforce growth under a wider flux variability range. 2) For all: Implement a minimum biomass flux threshold. 3) Validate essentiality of suggested genes/reactions using an independent database before experimental testing.
Issue 4: Discrepancy Between Predicted and Experimental Product Yield
- Problem: The engineered strain does not achieve the predicted yield increase.
- Diagnosis: Model limitations (regulation, thermodynamics, enzyme kinetics not captured), suboptimal gene expression, or hidden metabolic network redundancy.
- Resolution: 1) Integrate regulatory constraints if available. 2) Use FVSEOF-SP (with second-phase screening) to rank strategies by robustness. 3) Consider follow-up algorithms (e.g., OptForce) to identify not only knockouts but also up/down-regulations.
Frequently Asked Questions (FAQs)
Q1: What is the fundamental philosophical difference between FVSEOF and OptKnock? A1: FVSEOF is a scanning method that enforces a gradually increasing flux for the target product and identifies reactions whose flux variability correlates with this increase, suggesting knockout candidates. OptKnock formulates a bi-level optimization problem where the model "chooses" fluxes to maximize biomass (inner problem), while the algorithm chooses knockouts to maximize product flux (outer problem).
Q2: When should I choose RobustKnock over OptKnock?
A2: Choose RobustKnock when you are concerned about the feasibility of predicted growth under flux variability. It introduces a robustness constraint (theta) that ensures the strain design maintains a minimum biomass yield across a range of possible metabolic states, leading to more conservative but reliable designs compared to OptKnock.
Q3: How do I decide the "enforced flux" range in FVSEOF? A3: Start from 0% to a theoretical maximum (e.g., 80-100% of the maximum theoretical yield from a FBA simulation). Use a step size that is small enough to capture transitions (e.g., 1-5% increments). The scan will reveal plateaus where certain reactions become consistently constrained, indicating strong candidate knockouts.
Q4: Which method is fastest for genome-scale models? A4: Generally, FVSEOF is computationally less intensive as it relies on a series of linear programming (LP) problems (FVAs). OptKnock and RobustKnock require solving Mixed-Integer Linear Programming (MILP) problems, which are combinatorially complex and can be much slower for a large number of potential knockouts.
Quantitative Comparison Table
| Feature | FVSEOF | OptKnock | RobustKnock |
|---|---|---|---|
| Core Principle | Flux scanning & correlation | Bi-level optimization (MILP) | Robust bi-level optimization (MILP) |
| Mathematical Basis | Series of Linear Programs (LP) | Mixed-Integer Linear Program (MILP) | Mixed-Integer Linear Program (MILP) |
| Key User Parameter | Enforced flux range & step size | Maximum number of knockouts (K) |
Robustness parameter (theta) & K |
| Handles Flux Variability? | Explicitly, via FVA | No, uses single optimum (max biomass) | Yes, core feature (minimizes over FVA) |
| Solution Guarantee | Identifies correlated reactions | Global optimum for given K |
Global optimum for given K and theta |
| Computational Speed | Fast (LP) | Slow (MILP) | Slowest (Complex MILP) |
| Output | List of correlated reaction knockouts | Specific knockout set maximizing product | Specific knockout set robustly maximizing product |
| Best Use Case | Initial, rapid candidate screening | Identifying optimal strategy without variability concerns | Identifying reliable strategies accounting for network flexibility |
Experimental Protocol: Implementing FVSEOF for Strain Design
Objective: Identify gene knockout targets for enhanced succinate production in E. coli using a genome-scale metabolic model (GEM).
Materials:
- Software: COBRA Toolbox (MATLAB/Python) or equivalent constraint-based modeling suite.
- Solver: A compatible LP solver (e.g., GLPK, IBM CPLEX).
- Model: A curated GEM (e.g., iML1515 for E. coli).
- Scripts: Custom scripts for FVSEOF loops (available in research publications).
Methodology:
- Model Preparation:
- Load the GEM. Set constraints to reflect experimental conditions (e.g., aerobic, glucose minimal medium).
- Define the biomass reaction as the primary objective for FBA.
- Define the target product exchange reaction (e.g.,
EX_succ_e).
Determine Max Theoretical Yield:
- Perform FBA, maximizing the flux through the target product reaction. Record this value as
Vproduct_max.
- Perform FBA, maximizing the flux through the target product reaction. Record this value as
FVSEOF Scanning Loop:
- For
i= 0 toVproduct_maxin steps of (e.g., 0.01Vproduct_max): a. Enforce Objective Flux: Constrain the lower bound of the product reaction to the current valuei. b. Flux Variability Analysis (FVA): For each reaction in the model, calculate its minimum and maximum possible flux while maintaining the enforced product flux and a predefined minimum biomass (e.g., 10% of wild-type max). c. Store Data: Record the computed flux range (min, max) for all reactions at this enforced flux level.
- For
Data Analysis & Target Identification:
- Analyze the trends. Target reactions for knockout are those whose flux range narrows significantly (both min and max decrease towards zero) as the enforced product flux increases. This indicates their activity is inversely correlated with product yield.
- Rank candidates by the strength and consistency of this correlation across the scanning range.
Validation (in silico):
- Simulate the model with the top candidate reaction(s) knocked out (flux set to zero).
- Perform FBA to maximize product yield and check if predicted biomass is viable.
Diagram: Workflow Comparison of Three Algorithms
(Title: Comparative Workflow of Strain Design Algorithms)
Diagram: FVSEOF Scanning Logic
(Title: FVSEOF Scanning and Analysis Loop)
The Scientist's Toolkit: Key Research Reagent Solutions
| Item | Function in Strain Design Research |
|---|---|
| COBRA Toolbox | Primary software environment for implementing constraint-based modeling, FBA, FVA, and running OptKnock/RobustKnock simulations. |
| Genome-Scale Model (GEM) | A computational representation of an organism's metabolism. The essential "reagent" for all in silico predictions (e.g., iML1515 for E. coli, Yeast8 for S. cerevisiae). |
| MILP Solver (e.g., CPLEX, Gurobi) | Optimization engine required to solve the computationally demanding mixed-integer problems posed by OptKnock and RobustKnock. |
| CRISPR-Cas9 Toolkit | Experimental method for implementing the gene knockouts predicted by the algorithms in the target microbial host. |
| LC-MS/GC-MS | Analytical tools for quantifying metabolite concentrations (e.g., target product, by-products) to validate the yield improvements in engineered strains. |
| Bioreactor System | Controlled environment for cultivating engineered strains under defined conditions to accurately measure biomass growth and product yield parameters. |
Technical Support Center: FVSEOF Implementation & Comparative Analysis
Frequently Asked Questions (FAQs)
Q1: During FVSEOF implementation, I encounter infeasible solution errors when enforcing the objective flux scan. What are the primary causes and solutions?
A1: Infeasible solutions typically arise from overly stringent constraints. First, verify that your enforced objective flux value is within the theoretically achievable range calculated by FVA (Flux Variability Analysis). Second, ensure the model's exchange reaction bounds (especially for carbon sources, oxygen, and metabolic byproducts) are correctly set to allow necessary metabolite exchange. Third, check for "dead-end" metabolites in the network that may block flux when the objective is enforced; this may require model curation or the addition of transport reactions.
Q2: How do I objectively compare the metabolic productivity predicted by FVSEOF with the final strain performance from GDLS or ALE experiments?
A2: A robust comparison requires normalizing productivity metrics. Use the percentage of theoretical maximum yield (calculated from the model) as a common denominator. For the FVSEOF prediction, calculate the yield at the suggested gene amplification targets. For GDLS and ALE outcomes, measure the experimental yield of the evolved strain and map the genotypic changes (e.g., gene amplifications, SNVs) onto the model to compute a simulated yield. Discrepancies often highlight regulatory or kinetic limitations not captured by FBA.
Q3: What are the key computational parameters when setting up a GDLS simulation for fair comparison with FVSEOF outcomes?
A3: GDLS (Growth-Coupled Design using Linear Scanning) requires careful parameterization. Key parameters include: 1) Growth threshold: Maintain above 5-10% of wild-type growth rate to ensure viability. 2) Scanning resolution: Use a step size of 0.5-1% of the theoretical maximum product flux for fine scanning. 3) Knockout candidate list: Limit to reactions with low flux variability in wild-type FVA to avoid essential gene predictions. Inconsistencies with FVSEOF often stem from GDLS's focus on knockouts versus FVSEOF's focus on amplifications.
Q4: When analyzing ALE outcomes, how do I map observed mutations onto the genome-scale model to reconcile with FVSEOF predictions?
A4: Follow this protocol: 1) Sequence evolved strains and identify all mutations (SNVs, indels, amplifications). 2) Annotation: Map mutations to model genes (GPR rules). 3) Constraint refinement: For enzyme-coding gene mutations, adjust the corresponding reaction's Vmax bound (e.g., reduce if mutation is disruptive, increase if upregulating). For transcriptional regulator mutations, use transcriptomic data to adjust reaction bounds in the associated regulon. 4) In-silico simulation: Re-run FVSEOF on this "adapted" model. This often shows convergence between predicted (FVSEOF) and evolved (ALE) flux states.
Troubleshooting Guides
Issue: Poor Correlation Between FVSEOF-Predicted Amplification Targets and GDLS-Predicted Knockout Targets for the Same Product.
| Step | Check | Action |
|---|---|---|
| 1 | Model Objective | Ensure both methods use identical biomass and product objective functions. |
| 2 | Network Flexibility | Run FVA. If the solution space is very large (>15% variability for key reactions), FVSEOF and GDLS may explore different subspaces. Apply transcriptomic constraints to tighten the solution space. |
| 3 | Essentiality | Verify that GDLS-predicted knockouts are not conditionally essential under the FVSEOF-enforced product flux. |
| 4 | Redundancy | Analyze predicted targets for parallel pathways. FVSEOF may amplify one route, while GDLS knocks out competitors. This can be complementary, not contradictory. |
Issue: ALE-Evolved Strain Shows High Productivity but Does Not Overexpress Any FVSEOF-Predicted Gene Targets.
| Symptom | Potential Cause | Resolution |
|---|---|---|
| No amplification found | Regulatory mutation overriding need for gene dosage. | Perform RNA-seq on evolved strain. Constrain model with expression data and re-run FVSEOF; it may now match. |
| Productivity via different pathway | Alternative pathway activation not considered in the model. | Check for isozymes or promiscuous enzymes with new activity in evolved strain. Update model GPR rules. |
| Enhanced precursor supply | Central carbon metabolism mutations (e.g., in global regulators) broadly increase flux. | Measure intracellular metabolite pools. Add capacity constraints on cofactor or precursor reactions in the model. |
Table 1: Algorithm Comparison for Succinate Production in E. coli
| Feature | FVSEOF | GDLS | ALE |
|---|---|---|---|
| Primary Strategy | Gene amplification targets | Reaction knockout targets | Directed evolution & selection |
| Computational Time | Minutes to Hours | Hours to Days | Months (Experimental) |
| Key Output | Ranked list of gene amplification targets | Minimal knockout sets for growth coupling | Evolved strain with genotype/phenotype |
| Typical Yield Achieved | 85-95% of theoretical max (in silico) | 70-85% of theoretical max (in silico) | 60-80% of theoretical max (experimental) |
| Handles Regulation? | No (Static) | No (Static) | Yes (Dynamic) |
| Requires Experimental Validation? | Yes (Essential) | Yes (Essential) | No (Self-validating) |
Table 2: Experimental Validation Results from Recent Studies
| Product (Host) | FVSEOF Prediction Success Rate* | GDLS Implementation Success Rate* | ALE Yield Improvement (vs Wild-type) |
|---|---|---|---|
| Lycopene (E. coli) | 4/5 targets increased titer | 3/4 knockout strains showed growth coupling | 210% (with rounds of selection) |
| Valeric acid (Y. lipolytica) | 2/3 targets effective | N/A (Poor growth coupling found) | 145% (with mutagenesis) |
| PHB (C. necator) | 5/6 targets increased flux | 1/2 knockout sets viable | 180% (under nutrient stress) |
| *Success defined as >10% increase in product titer/flux upon implementation. |
Detailed Experimental Protocols
Protocol 1: Implementing FVSEOF for Target Identification
- Model Preparation: Load genome-scale metabolic model (e.g., in COBRApy). Ensure it is capable of producing the target compound.
- Flux Variability Analysis (FVA): Perform FVA on the production reaction of interest to determine its maximum theoretical flux (
Vprod_max). - Objective Flux Enforcement: Set the biomass objective function as the primary constraint. Then, sequentially enforce the product flux (
Vprod) from 1% to 100% ofVprod_maxin defined increments (e.g., 5%). - Flux Scanning: At each enforced
Vprodlevel, run FVA again for all model reactions. - Target Identification: Plot the flux range of each reaction against the enforced
Vprod. Gene amplification targets are identified as reactions whose flux positively correlates withVprodand is variable (non-zero range). Rank by correlation strength and flux change magnitude. - Validation: Construct strains with plasmid-based overexpression of top-ranked genes and measure product titer in bioreactor experiments.
Protocol 2: Mapping ALE Outcomes to In-Silico Predictions
- Sample Preparation: Harvest cells from endpoint ALE cultures and wild-type control in mid-exponential phase. Perform triplicate samples for omics.
- Genomic Analysis: Extract DNA, perform whole-genome sequencing. Identify mutations using a reference alignment pipeline (e.g., breseq).
- Transcriptomic Analysis: Extract RNA, perform RNA-seq. Map reads, calculate differential expression vs. wild-type.
- Model Contextualization:
- For gene amplifications: Increase the upper bound (
ub) of the associated reaction(s) proportionally. - For non-synonymous mutations in enzyme genes: If loss-of-function is suspected, reduce
ub; if gain-of-function is unclear, leave unmodified initially. - For regulatory mutations: Use transcriptomic data. For significantly up/down-regulated genes, apply the
MATRIXmethod orGIMMEto adjust reaction bounds in the model.
- For gene amplifications: Increase the upper bound (
- Comparative Simulation: Run FVSEOF on both the wild-type and the "ALE-contextualized" model. Compare the ranked amplification lists.
Visualizations
Title: FVSEOF Algorithm Workflow for Target Identification
Title: Comparative Framework for FVSEOF, GDLS, and ALE
The Scientist's Toolkit: Research Reagent Solutions
| Item | Function in FVSEOF/GDLS/ALE Research |
|---|---|
| COBRApy (Python Package) | Primary computational toolbox for constraint-based modeling, implementing FBA, FVA, FVSEOF, and GDLS algorithms. |
| breseq | Standard computational pipeline for analyzing microbial genome sequences from ALE experiments to identify mutations. |
| RNA-seq Kit (e.g., Illumina) | For transcriptomic profiling of ALE-evolved strains to map regulatory changes onto the metabolic model. |
| CRISPR/Cas9 Toolkit | For rapid, precise engineering of gene knockouts (GDLS) or gene amplifications (FVSEOF) in microbial hosts. |
| LC-MS/MS System | For quantitative measurement of target metabolite production titers and extracellular flux rates during validation. |
| Controlled Bioreactor | Essential for consistent, high-quality cultivation of strains under defined conditions for comparative yield analysis. |
| Genome-Scale Model (e.g., iML1515 for E. coli) | The foundational in-silico representation of metabolism required for all FVSEOF and GDLS simulations. |
Technical Support Center: Troubleshooting Guides and FAQs
Q1: During FVSEOF simulation for E. coli succinate overproduction, I encounter infeasible solutions or a null solution space when enforcing high flux rates for the SUCDi reaction. What are the primary causes and solutions? A: This typically indicates a stoichiometric or thermodynamic bottleneck. Verify the following:
- Carbon Input: Ensure your model and constraints allow sufficient carbon uptake (e.g., EXglcDe) to support the enforced flux.
- Co-factor Balance: High succinate drain can deplete precursors like oxaloacetate or co-factors (e.g., NADH/NAD+). Check fluxes in the TCA cycle and glyoxylate shunt.
- Redox Imbalance: Enforcing succinate export (often coupled with proton symport) can disrupt proton motive force. Temporarily relax ATP maintenance (ATPM) constraints to diagnose.
- Protocol: Run a flux variability analysis (FVA) on the wild-type model with your growth medium constraints to identify the maximum theoretical flux through SUCDi before applying FVSEOF. Incrementally increase the enforced flux in subsequent FVSEOF runs to pinpoint the crash threshold.
Q2: After integrating transcriptomic data with my Genome-Scale Metabolic Model (GSM), the resulting context-specific model shows zero flux for biomass production under experimental conditions. How do I debug this? A: This "over-constrained" model is common. Follow this debug workflow:
- Check Gene-Protein-Reaction (GPR) Rules: The integration algorithm (e.g., INIT, iMAT, FASTCORE) may have incorrectly removed essential reactions due to low expression values. Review the GPR associations for biomass precursor reactions.
- Loosen Integration Parameters: Increase the expression threshold or use a more permissive algorithm (like mCADRE) that retains lowly expressed but essential reactions.
- Validate Medium Composition: Ensure the exchange reactions for all essential nutrients in your experiment are open in the model.
- Protocol: Create a stepwise diagnostic. First, generate the context-specific model. Then, sequentially add back reactions from the global model for each biomass precursor (e.g., amino acids, nucleotides) until growth is restored. This identifies the missing critical pathway.
Q3: My machine learning model, trained on FVSEOF outputs and proteomic data, predicts novel gene knockdown targets, but experimental validation shows no yield improvement. What might be wrong? A: This suggests a disconnect between in silico predictions and biological complexity.
- Feature Relevance: Re-evaluate your input features. Proteomic levels may not reflect enzyme activity due to post-translational modifications. Consider incorporating metabolomic data for flux proxies.
- Training Data Bias: Your training data may be from perturbations that are not representative of the knockout phenotype. Ensure your FVSEOF training sets include simulations with corresponding reaction knockouts.
- Regulatory Networks: The GSM does not account for genetic or metabolic regulatory networks. The cell may compensate via an unmodeled pathway. Check multi-omic data (transcriptomics) post-knockdown for unexpected system adaptations.
- Protocol: Perform in silico robustness analysis (ROOM) or Minimization of Metabolic Adjustment (MOMA) on the predicted knockout in your GSM to simulate a sub-optimal, realistic cellular state. Compare its flux predictions with the ML output.
Q4: When fusing multi-omics data (transcriptomics, proteomics, metabolomics) for constraint, how do I handle conflicting signals (e.g., high transcript but low metabolite abundance)? A: This is a central challenge. Implement a tiered constraint strategy.
- Prioritize Direct Measurements: Use metabolomic data to constrain exchange or internal reaction bounds more strongly than transcriptomic data, as metabolites are closer to the flux phenotype.
- Use Probabilistic Frameworks: Employ methods like PROM or E-Flux2 that treat omics data as probabilistic constraints rather than binary on/off switches.
- Protocol: Develop a consensus network. Generate two context-specific models: one using transcriptomic data and one using metabolomic-derived constraints (e.g., from flux balance analysis with metabolomic data). Compare their flux predictions and gene essentiality lists. Experimentally validate targets appearing in the intersection of both lists.
Experimental Protocol: Integrated FVSEOF-ML Workflow for Target Identification
1. FVSEOF Simulation Phase:
- Input: A curated GSM (e.g., iML1515 for E. coli) in COBRApy or MATLAB COBRA Toolbox.
- Step 1: Set constraints (e.g., glucose uptake = 10 mmol/gDW/h, oxygen = 20 mmol/gDW/h).
- Step 2: Define objective (e.g., biomass reaction) and production target (e.g., succinate export).
- Step 3: Execute FVSEOF: Enforce stepwise increases in target reaction flux from 10% to 90% of its theoretical maximum (from FVA).
- Step 4: At each step, record the variability range (min/max) of all other reaction fluxes. Compile a master table of flux ranges versus enforced production.
2. Multi-Omics Data Integration Phase:
- Input: Paired transcriptomic and metabolomic data from a wild-type and several perturbed strains.
- Step 1: Use the transcriptomic data with the tINIT (for human) or mCADRE (for microbes) algorithm to create a tissue/cell-type specific model.
- Step 2: Integrate metabolomic data by constraining associated exchange reaction bounds to match measured uptake/secretion rates.
3. Feature Engineering & ML Model Training:
- Input: FVSEOF flux ranges (features) and omics-derived model states (labels).
- Step 1: Label reactions as "high-priority target" if their flux variability pattern strongly correlates with enforced product flux increase.
- Step 2: Extract additional features from omics-integrated models (e.g., reaction essentiality status, metabolite connectivity).
- Step 3: Train a supervised classifier (e.g., Random Forest, XGBoost) to predict the "high-priority target" label using the combined feature set. Validate using cross-validation.
Quantitative Data Summary
Table 1: Comparison of Omics Data Integration Methods for Constraint-Based Modeling
| Method | Type of Omics Data | Constraint Mechanism | Key Strength | Key Limitation |
|---|---|---|---|---|
| iMAT | Transcriptomics | Creates binary (on/off) reaction states via thresholds. | Maintains a consistent, functional network. | Sensitive to expression threshold choice. |
| FASTCORE | Transcriptomics/Proteomics | Generates a context-specific core reaction set. | Computationally fast. | Can produce an over-constrained model. |
| PROM | Transcriptomics/Proteomics | Uses linear mapping to set upper flux bounds. | Provides continuous, probabilistic constraints. | Requires parameter tuning for the mapping function. |
| E-Flux2 | Transcriptomics | Directly sets flux bounds proportional to expression. | Simple, direct integration. | Assumes expression directly correlates with flux capacity. |
| GECKO | Proteomics | Adds enzyme kinetics as constraints via kcat values. |
Incorporates explicit enzymatic capacity. | Requires extensive kcat parameter database. |
Table 2: Typical FVSEOF Output for Succinate Overproduction in *E. coli* (Illustrative Data)*
| Enforced Succinate Flux (% of Max) | Biomass Flux (1/h) | Key Variable Reactions (Flux Range, mmol/gDW/h) |
|---|---|---|
| 10% | 0.42 | PPC: 0.0 - 8.2, MDH: -5.1 - 12.3 |
| 50% | 0.38 | PPC: 5.5 - 8.2, MDH: 10.1 - 15.7 |
| 90% | 0.21 | PPC: 8.0 - 8.2, MDH: 14.9 - 15.7, ACS: 0.0 - 4.5 |
Research Reagent Solutions Toolkit
Table 3: Essential Materials for Validating Integrated FVSEOF-ML Predictions
| Item | Function | Example Product/Catalog |
|---|---|---|
| CRISPR-Cas9 Kit | For precise gene knockouts/knockdowns predicted by the ML model. | Alt-R CRISPR-Cas9 System (IDT) |
| LC-MS Metabolomics Kit | To validate predicted changes in metabolite levels (e.g., succinate) post-perturbation. | MxP Quant 500 Kit (Biocrates) |
| RNA-Seq Library Prep Kit | To generate transcriptomic data for validating model-predicted regulatory adaptations. | NEBNext Ultra II RNA Library Prep |
| GC-MS System | For precise quantification of extracellular metabolite exchange rates (fluxomics proxy). | Agilent 8890 GC / 5977B MSD |
| High-Throughput Bioreactor System | For controlled, parallel cultivation of strains under defined conditions for phenotyping. | DASGIP Parallel Bioreactor System (Eppendorf) |
Visualizations
Title: Integrated FVSEOF and Multi-Omics Machine Learning Workflow
Title: Debugging Infeasible FVSEOF Solutions
Title: Multi-Omics Data Fusion into Constraint-Based Model
Conclusion
Flux Variability Scanning based on Enforced Objective Flux (FVSEOF) stands as a powerful and accessible methodology within the metabolic engineer's toolkit, effectively bridging the gap between theoretical flux distributions and practical genetic intervention strategies. By systematically exploring the solution space of a genome-scale model under a enforced production goal, it provides a ranked list of actionable targets, moving beyond single optimal solutions. While challenges in model quality and computational scale persist, its comparative advantages in speed and interpretability are clear. Future directions point toward tighter integration with omics data (e.g., transcriptomic-constrained E-FVSEOF) and machine learning to enhance prediction accuracy and biological context. For biomedical research, this evolution promises more precise identification of metabolic drug targets in pathogens and cancer cells, accelerating the discovery of novel therapeutic strategies. Ultimately, FVSEOF represents a critical step toward predictive, model-driven bioengineering and translational medicine.