Rapid Quantification of Fermentation Metabolites: A Modern GC-MS Method for Researchers and Drug Developers
This article provides a comprehensive guide to developing and implementing a rapid GC-MS method for quantifying key fermentation metabolites such as acids (lactic, acetic, succinic), alcohols (ethanol, butanediol), and ketones...
Rapid Quantification of Fermentation Metabolites: A Modern GC-MS Method for Researchers and Drug Developers
Abstract
This article provides a comprehensive guide to developing and implementing a rapid GC-MS method for quantifying key fermentation metabolites such as acids (lactic, acetic, succinic), alcohols (ethanol, butanediol), and ketones (acetoin, acetone). Tailored for researchers and drug development professionals, it covers the foundational principles of selecting target analytes and sample preparation, details a step-by-step optimized methodological workflow, addresses common troubleshooting and optimization challenges, and concludes with robust validation protocols and comparative analysis against traditional techniques like HPLC. The goal is to empower scientists with a reliable, high-throughput analytical tool to accelerate bioprocess development and metabolic engineering.
Understanding the Core: Essential Metabolites and GC-MS Fundamentals for Fermentation Analysis
Why Quantify Fermentation Metabolites? Impact on Bioprocess and Drug Development
Quantification of fermentation metabolites is a critical analytical task in bioprocessing and pharmaceutical development. Accurate metabolite profiles provide a real-time window into cellular physiology, enabling the optimization of yield, titer, and productivity (QTP) for target molecules like recombinant proteins, antibodies, vaccines, and advanced therapy medicinal products (ATMPs). In drug development, metabolite analysis is essential for process characterization, quality by design (QbD) implementation, and ensuring batch-to-batch consistency as per ICH Q11 guidelines. Within the broader thesis on developing a rapid GC-MS method, this application note details the protocols and impact of quantifying key metabolites—organic acids (lactate, acetate, succinate), alcohols (ethanol), and sugars (glucose, glycerol)—on process control and product quality.
Application Notes: Impact Areas and Quantitative Data
Impact on Bioprocess Development
Metabolite concentration shifts directly indicate metabolic burden, substrate utilization efficiency, and the onset of undesirable metabolic states (e.g., lactate or acetate overflow in mammalian and microbial cultures). Recent studies underscore the economic impact: a 2023 analysis showed that implementing real-time metabolite monitoring can reduce process development time by ~30% and increase final product titer by 15-25% in CHO cell cultures.
Impact on Drug Development & Safety
Metabolite profiles are vital for cell line stability studies and identifying process-related impurities. Certain metabolites can impact post-translational modifications of biologics. For instance, elevated ammonium ions (derived from glutamate metabolism) can alter glycosylation patterns, affecting drug efficacy and immunogenicity.
Table 1: Critical Fermentation Metabolites and Their Impact Thresholds
| Metabolite | Typical Quantification Range (mM) | Critical Threshold (mM) | Primary Impact |
|---|---|---|---|
| Lactate | 0 - 40 | >20 (Mammalian Cell) | Culture pH drop, inhibited growth |
| Acetate | 0 - 30 | >10 (CHO Cells) | Reduced cell viability, productivity |
| Glucose | 5 - 35 | <2 | Nutrient limitation, metabolic shift |
| Glutamine | 0 - 8 | <0.5 | Reduced growth rate, apoptosis risk |
| Ammonia | 0 - 6 | >4 | Altered glycosylation, toxicity |
Table 2: GC-MS vs. Other Methods for Metabolite Quantification (2024 Benchmark)
| Method | Sample Prep Time | Analysis Time per Sample | Key Metabolites Covered | Relative Accuracy (%) |
|---|---|---|---|---|
| GC-MS (Derivatized) | 60-90 min | 15-20 min | Organic acids, sugars, alcohols, amino acids | 98-99.5 |
| HPLC-UV/RI | 20-30 min | 25-30 min | Organic acids, sugars | 95-98 |
| Enzymatic Assays | 10-15 min | 5-10 min per metabolite | Specific (e.g., Glucose, Lactate) | 97-99 |
| NMR | 5-10 min | 15-30 min | Broad, untargeted | 90-95 |
Experimental Protocols
Protocol: Sample Preparation for GC-MS Analysis of Culture Broth
This protocol is optimized for rapid quenching and extraction of intracellular and extracellular metabolites.
Materials:
- Cold (-20°C) Methanol:Water:Formic Acid (50:48:2 v/v) quenching solution.
- Derivatization reagents: Methoxyamine hydrochloride (20 mg/mL in pyridine) and N-Methyl-N-(trimethylsilyl)trifluoroacetamide (MSTFA) with 1% TMCS.
- Internal standard solution: Succinic acid-d4, Alanine-d4 (each at 0.1 mg/mL in water).
Procedure:
- Sampling & Quenching: Withdraw 1 mL culture broth and immediately mix with 4 mL of cold quenching solution (-20°C). Vortex for 10 seconds.
- Centrifugation: Centrifuge at 14,000 x g for 10 minutes at -4°C. Carefully separate supernatant (extracellular metabolites) and cell pellet.
- Pellet Extraction: Resuspend cell pellet in 1 mL of cold (-20°C) acetonitrile:water (1:1). Sonicate on ice for 2 minutes (5 sec pulse, 10 sec rest). Centrifuge at 14,000 x g for 10 min. Collect supernatant (intracellular metabolites).
- Pooling and Drying: Combine intracellular and extracellular fractions. Transfer 500 µL to a glass vial. Add 50 µL of internal standard solution. Dry completely under a gentle stream of nitrogen at 40°C.
- Derivatization: a. Add 50 µL of methoxyamine solution. Cap tightly and vortex. Incubate at 40°C for 90 minutes with shaking. b. Add 100 µL of MSTFA + 1% TMCS. Vortex and incubate at 40°C for 45 minutes.
- GC-MS Analysis: Inject 1 µL into the GC-MS system using the method described in 3.2.
Protocol: GC-MS Method for Rapid Quantification
Instrument: Agilent 8890 GC coupled with 5977B MSD. Column: HP-5MS UI (30 m × 0.25 mm × 0.25 µm). Method Parameters:
- Inlet: 250°C, Split ratio 10:1.
- Carrier Gas: Helium, constant flow 1.2 mL/min.
- Oven Program: 60°C hold 1 min, ramp at 20°C/min to 130°C, then at 8°C/min to 300°C, hold 2 min. Total run time: 23.75 min.
- MS Source: 230°C, Quad: 150°C.
- Acquisition Mode: SIM (Selected Ion Monitoring) for target metabolites. Example ions (m/z): Lactate: 261, Acetate: 117, Succinate: 289, Glucose: 319, 205.
Quantification:
- Prepare a 6-point calibration curve for each target metabolite using authentic standards processed identically to samples.
- Use internal standard peak areas for normalization and calculate concentrations via linear regression (R² > 0.995 required).
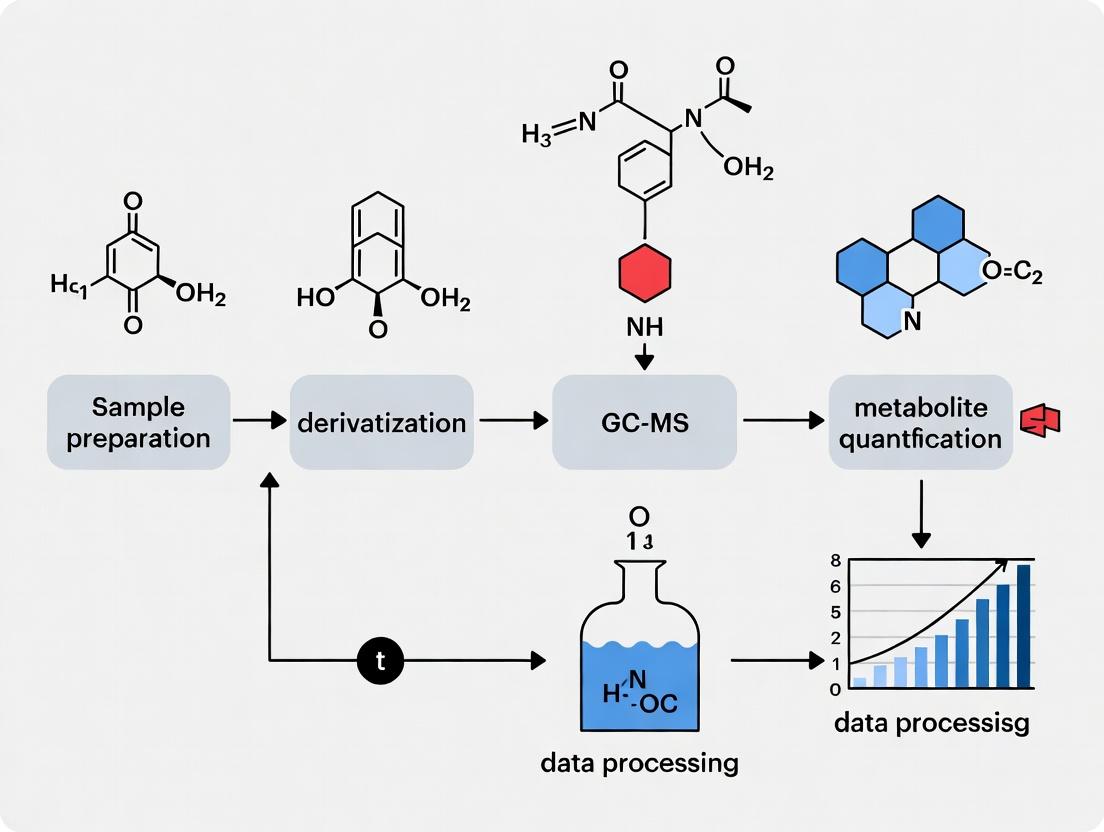
Visualizations
Workflow for Fermentation Metabolite Analysis
Key Metabolic Pathways and Overflow
The Scientist's Toolkit: Key Research Reagent Solutions
Table 3: Essential Materials for Fermentation Metabolite Analysis
| Item / Reagent | Function & Rationale |
|---|---|
| Cold Methanol:Water Quenching Solution | Rapidly halts enzymatic activity, "freezing" the metabolic state at sampling time. |
| Methoxyamine Hydrochloride (in Pyridine) | First-step derivatization agent; protects carbonyl groups (in sugars, keto acids) by forming methoximes. |
| MSTFA with 1% TMCS | Silylation agent; replaces active hydrogens (-OH, -COOH, -NH) with TMS groups, increasing volatility for GC. |
| Stable Isotope-Labeled Internal Standards (e.g., Succinic-d4 acid) | Corrects for sample loss during preparation and matrix effects during MS analysis, ensuring quantification accuracy. |
| HP-5MS UI GC Column | Standard low-polarity stationary phase providing high-resolution separation of a wide range of derivatized metabolites. |
| Authentic Metabolite Standard Mix | Used to create calibration curves for absolute quantification. Must match process-relevant metabolites. |
| Solid Phase Extraction (SPE) Cartridges (C18, HILIC) | Optional for sample clean-up to remove salts and proteins, extending column life and improving MS sensitivity. |
Application Notes
Within the context of developing a robust, rapid GC-MS method for quantifying major fermentation metabolites, profiling acids, alcohols, and ketones is fundamental. These compounds serve as primary indicators of microbial metabolic flux, system health, and product yield. Accurate quantification is critical for optimizing bioprocesses, metabolic engineering, and drug development where microbial systems are used for API production or as therapeutic targets.
The rapid GC-MS method detailed here enables the simultaneous analysis of volatile and semi-volatile metabolites from complex broth matrices. Key applications include:
- Real-time Bioprocess Monitoring: Tracking acetate, lactate, ethanol, butanediol, and acetone formation provides immediate feedback on fermentation progress and microbial stress.
- Metabolic Pathway Elucidation: Quantifying ratios of key metabolites like acetoacetate, 3-hydroxybutyrate, and acetate is essential for mapping flux through pathways such as mixed-acid fermentation or the acetone-butanol-ethanol (ABE) pathway.
- Strain Phenotyping & Engineering: Rapid screening of engineered microbial strains for desired product profiles (e.g., succinate, 2,3-butanediol) versus byproducts (e.g., formate, acetate).
- Drug Mechanism of Action Studies: Profiling metabolite shifts in bacterial pathogens exposed to novel antibiotics can reveal target pathways and metabolic vulnerabilities.
The protocols below are designed for reliability and high-throughput, essential for the iterative research demanded in modern biotechnology and pharmaceutical development.
Protocol 1: Sample Derivatization for GC-MS Analysis
Objective: To prepare filtered microbial fermentation broth samples for GC-MS analysis by converting polar organic acids and alcohols into more volatile derivatives (silylation and oximation).
Materials:
- Filtered, cell-free fermentation broth supernatant (0.22 µm filter).
- Methoxyamine hydrochloride (≥98%) in pyridine (20 mg/mL).
- N-Methyl-N-(trimethylsilyl)trifluoroacetamide (MSTFA) with 1% TMCS.
- Internal Standard Solution: 10 mM Sodium 2-ketovalerate-d6 (or succinic acid-d4) in methanol.
- Anhydrous pyridine.
- GC-MS vials with crimp caps and low-volume inserts.
Procedure:
- Sample Preparation: Transfer 100 µL of filtered supernatant to a clean 1.5 mL microcentrifuge tube.
- Internal Standard Addition: Add 10 µL of the 10 mM deuterated internal standard solution. Vortex for 10 seconds.
- Drying: Evaporate the mixture to complete dryness under a gentle stream of nitrogen gas at 40°C.
- Methoximation: Reconstitute the dried residue with 50 µL of methoxyamine hydrochloride solution (20 mg/mL in pyridine). Vortex vigorously for 1 minute. Incubate at 70°C for 60 minutes with periodic vortexing.
- Silylation: Add 100 µL of MSTFA (+1% TMCS) to the cooled reaction mixture. Vortex for 1 minute. Incubate at 70°C for 60 minutes.
- Final Preparation: Allow the vial to cool to room temperature. Transfer the derivatized sample to a GC-MS vial with insert. Analyze within 24 hours or store at -20°C under anhydrous conditions.
Protocol 2: Rapid GC-MS Analysis for Metabolite Quantification
Objective: To perform the chromatographic separation and mass spectrometric detection of target derivatized metabolites.
Instrumentation: Gas Chromatograph coupled with a Quadrupole Mass Spectrometer (GC-MS).
GC Parameters:
- Column: Mid-polarity column (e.g., DB-35MS, 30 m x 0.25 mm, 0.25 µm film).
- Inlet: Split/Splitless, 250°C, Split ratio 10:1.
- Carrier Gas: Helium, constant flow 1.2 mL/min.
- Oven Program: 70°C (hold 1 min), ramp at 15°C/min to 150°C, then ramp at 25°C/min to 320°C (hold 2 min). Total run time: ~13.5 minutes.
- Transfer Line: 280°C.
MS Parameters:
- Ionization: Electron Impact (EI) at 70 eV.
- Ion Source Temperature: 230°C.
- Quadrupole Temperature: 150°C.
- Data Acquisition: Selected Ion Monitoring (SIM) mode. Acquire data after a 4.5-minute solvent delay.
Quantification:
- Calibration: Prepare a 6-point calibration curve using authentic standards of target metabolites, processed identically to samples (derivatization required). Concentrations should span the expected biological range (e.g., 0.01 mM to 20 mM).
- Data Analysis: Use the peak area ratio of the target analyte to its designated internal standard for quantification. Generate linear regression curves. Use deuterated analogs as internal standards for their closest eluting metabolites (e.g., succinate-d4 for succinate).
Quantitative Data Table: Representative Metabolite Concentrations inE. coliFermentation
Table 1: Concentration ranges of key target metabolites in *E. coli K-12 under varying oxygen conditions (aerobic vs. microaerobic) as quantified by the rapid GC-MS method. Data is presented as mean ± SD (n=3).*
| Metabolite Class | Specific Metabolite | Aerobic (mM) | Microaerobic (mM) | Primary Pathway Involved |
|---|---|---|---|---|
| Acids | Acetate | 0.5 ± 0.1 | 12.5 ± 1.8 | Mixed-Acid Fermentation |
| Lactate | ND* | 8.2 ± 0.9 | Mixed-Acid Fermentation | |
| Succinate | 0.3 ± 0.05 | 2.1 ± 0.3 | TCA Cycle / Reductive Branch | |
| Formate | 0.1 ± 0.02 | 15.0 ± 2.1 | Pyruvate Formate-Lyase | |
| Alcohols | Ethanol | ND* | 10.3 ± 1.5 | Mixed-Acid Fermentation |
| 2,3-Butanediol | ND* | 0.5 ± 0.1 | 2,3-Butanediol Synthesis | |
| Ketones | Acetoin | ND* | 0.8 ± 0.2 | 2,3-Butanediol Synthesis |
| Acetone | ND* | ND* | ABE Pathway (in clostridia) |
ND: Not Detected under these conditions.
The Scientist's Toolkit: Essential Research Reagents & Materials
Table 2: Key reagents and consumables for GC-MS based metabolite profiling.
| Item | Function/Application |
|---|---|
| Methoxyamine HCl | Forms methoxime derivatives of keto-groups (e.g., in pyruvate, acetoacetate), preventing enolization and improving peak shape. |
| MSTFA (+1% TMCS) | Silylation reagent. Replaces active hydrogens in -COOH, -OH groups with trimethylsilyl groups, increasing volatility and thermal stability. |
| Deuterated Internal Standards (e.g., Succinic acid-d4) | Corrects for variability in sample preparation, derivatization efficiency, and instrument performance. Essential for accurate quantification. |
| Anhydrous Pyridine | Serves as a solvent for methoximation, maintaining anhydrous conditions crucial for effective silylation. |
| DB-35MS GC Column | Mid-polarity stationary phase optimal for separating a wide range of derivatized organic acids, sugars, and alcohols. |
| 0.22 µm Syringe Filter (Nylon) | Provides rapid clarification of microbial broth samples, removing cells and particulates that could damage the GC system. |
Visualizations
Title: Microbial Fermentation Pathways to Target Metabolites
Title: GC-MS Metabolite Analysis Workflow
This application note provides a comparative analysis of Gas Chromatography-Mass Spectrometry (GC-MS) and High-Performance Liquid Chromatography (HPLC) within the context of metabolic profiling for fermentation monitoring. The discussion is framed by a thesis research objective: developing a rapid, robust GC-MS method for quantifying major fermentation metabolites (e.g., organic acids, alcohols, sugars) to optimize bioprocess efficiency in drug development.
Core Principles
GC-MS separates volatile and thermally stable compounds via a gaseous mobile phase and a coated capillary column, followed by electron ionization and mass analysis. It requires derivatization for non-volatile metabolites.
HPLC (typically reversed-phase) separates compounds in a liquid mobile phase using a solid stationary phase, with detection via UV/Vis, fluorescence, or mass spectrometry (LC-MS). It is suitable for a broader range of polar and non-volatile compounds without derivatization.
Comparative Advantages for Metabolic Profiling
Table 1: Comparative Analysis of GC-MS and HPLC for Metabolic Profiling
| Feature | GC-MS | HPLC (with UV/Vis or MS detection) |
|---|---|---|
| Optimal Compound Class | Volatile, thermally stable, small molecules (< 650 Da). Post-derivatization: organic acids, sugars, amino acids. | Broad, including non-volatile, polar, thermally labile, and large molecules (e.g., peptides, complex lipids). |
| Separation Principle | Gas-liquid partitioning; high efficiency (theoretical plates). | Liquid-solid partitioning; variety of phases (RP, HILIC, ion-exchange). |
| Detection | Mass spectrometry (EI provides reproducible spectral libraries). | UV/Vis, Fluorescence, or MS (softer ionization like ESI). |
| Sample Preparation | Often requires derivatization (e.g., methoximation/silylation). Can be complex. | Simpler; often direct injection or protein precipitation. |
| Throughput | High (fast run times, especially with short columns). | Moderate to high; depends on method. |
| Quantitative Performance | Excellent linearity and sensitivity for volatiles. Robust with internal standards. | Excellent; requires compound-specific optimization. |
| Major Strength | High resolution, superb for profiling primary metabolites (TCA cycle, glycolysis). | Versatility; direct analysis of diverse secondary metabolites and complex lipids. |
Table 2: Quantitative Performance in Fermentation Metabolite Analysis
| Metabolite (Example) | Typical GC-MS LOD | Typical HPLC LOD (UV/Vis) | Key Advantage for Fermentation Monitoring |
|---|---|---|---|
| Ethanol | 0.1 mg/L | 10 mg/L (RID) | GC-MS: Superior sensitivity for dynamic tracking. |
| Lactic Acid | 0.5 µM (derivatized) | 5 µM | HPLC: Direct analysis, no derivatization delay. |
| Succinic Acid | 1.0 µM (derivatized) | 10 µM | GC-MS: Better separation from matrix in complex broths. |
| Glucose | 5.0 µM (derivatized) | 50 µM (RID) | HPLC: More straightforward for high-concentration samples. |
| Glycerol | 0.8 µM (derivatized) | 20 µM (RID) | GC-MS: Highly sensitive and specific with MS detection. |
Featured Protocol: Rapid GC-MS for Fermentation Metabolites
Objective: Quantify ethanol, acetic acid, lactic acid, succinic acid, and glycerol in filtered fermentation broth.
Sample Preparation (Derivatization):
- Filtration: Centrifuge 1 mL broth at 14,000 x g for 10 min. Filter supernatant through a 0.2 µm nylon membrane.
- Drying: Transfer 100 µL filtrate + 20 µL internal standard (e.g., 2 mM D4-succinic acid) to a glass vial. Dry completely under a gentle stream of nitrogen at 40°C.
- Methoximation: Add 50 µL of methoxyamine hydrochloride in pyridine (20 mg/mL). Vortex vigorously. Incubate at 30°C for 90 min with shaking.
- Silylation: Add 100 µL of N,O-Bis(trimethylsilyl)trifluoroacetamide (BSTFA) with 1% TMCS. Vortex. Incubate at 70°C for 60 min.
- Analysis: Cool, dilute with 200 µL hexane, transfer to a GC vial insert.
GC-MS Conditions:
- GC: Agilent 8890, Column: DB-5MS (30 m x 0.25 mm, 0.25 µm).
- Inlet: Split (10:1), 250°C.
- Carrier Gas: Helium, constant flow 1.2 mL/min.
- Oven Program: 60°C (1 min), ramp 10°C/min to 325°C, hold 5 min.
- MSD (Agilent 5977B): EI source 230°C, Quad 150°C, Scan mode (m/z 50-600). Solvent delay: 6 min.
- Quantification: Use selective ion monitoring (SIM) for target metabolites and internal standard for calibration curves.
Data Analysis: Integrate peak areas. Calculate concentration using a 5-point internal standard calibration curve for each analyte.
Visualization of Method Selection and Workflow
Title: Analytical Method Selection Workflow for Metabolic Profiling
Title: GC-MS Protocol for Fermentation Metabolites
The Scientist's Toolkit: Key Reagent Solutions
Table 3: Essential Materials for GC-MS Metabolic Profiling Protocol
| Item | Function in Protocol |
|---|---|
| Methoxyamine Hydrochloride | Protects carbonyl groups (in sugars, keto acids) by forming methoximes, preventing multiple peaks during silylation. |
| Pyridine (anhydrous) | Serves as the solvent for methoxyamine; must be dry to prevent reaction interference. |
| N,O-Bis(trimethylsilyl)-trifluoroacetamide (BSTFA) with 1% TMCS | Primary silylation agent; replaces active hydrogens (in -OH, -COOH, -NH) with TMS groups, conferring volatility and thermal stability. |
| Deuterated Internal Standards (e.g., D4-succinate) | Corrects for sample loss during preparation and instrument variability; essential for accurate quantification. |
| DB-5MS or Equivalent GC Column | (5%-Phenyl)-methylpolysiloxane stationary phase; industry standard for metabolomics, providing optimal separation of derivatized metabolites. |
| Filter Vials (0.2 µm, Nylon) | Removes microbial cells and particulate matter from fermentation broth to protect the GC system and column. |
| Retention Index Marker Solution (Alkanes) | Allows alignment of retention times across runs and aids in compound identification via library matching. |
Within a broader thesis focusing on developing a robust GC-MS method for the rapid quantification of major fermentation metabolites (e.g., organic acids, alcohols, sugars), the pre-analytical phase is paramount. Errors introduced during sample collection, quenching, and derivatization are irreversible and compromise all subsequent analytical data. This document details standardized Application Notes and Protocols to ensure metabolic quenching, accurate metabolite extraction, and effective chemical derivatization for reliable GC-MS analysis.
Sample Collection & Quenching Protocol
The primary goal is to instantaneously halt cellular metabolism to preserve an accurate in vivo metabolic snapshot.
2.1 Principle: Rapid cooling of the culture broth in a cryogenic solution (quenching solution) to deactivate enzymatic activity.
2.2 Critical Considerations:
- Osmotic Stress: Quenching solutions (e.g., cold buffered methanol) can cause cell leakage. The composition must be optimized for the specific microbial cell wall.
- Temperature: Must be below -20°C effectively.
- Speed: The process from sampling to full quenching should be <30 seconds.
2.3 Detailed Protocol: Cold Methanol Quenching for E. coli
Materials:
- Culture in bioreactor or shake flask
- Pre-chilled (-40°C) 60% aqueous methanol (v/v) in 0.9% ammonium bicarbonate (pH 7.0) (Quenching Solution)
- Vacuum filtration system with 0.45 μm cellulose nitrate membrane filters
- Liquid nitrogen
- Cold (-20°C) 100% LC-MS grade methanol (Extraction Solvent)
- Pre-cooled forceps and spatulas
Procedure:
- Preparation: Pre-cool the vacuum filtration unit and collection vessel on dry ice.
- Sampling: Rapidly withdraw a known volume (e.g., 10 mL) of fermentation broth using a syringe.
- Quenching: Immediately expel the sample into 20 mL of pre-chilled Quenching Solution (-40°C) in a 50 mL Falcon tube. Vortex vigorously for 10 seconds.
- Biomass Separation: Rapidly filter the quenched suspension under vacuum.
- Wash: Rinse the cell pellet on the filter with 5 mL of pre-chilled (-20°C) 0.9% ammonium bicarbonate solution to remove residual extracellular medium.
- Transfer: Using pre-cooled tools, quickly transfer the filter membrane with the cell pellet to a tube containing 10 mL of cold (-20°C) 100% methanol.
- Storage: Snap-freeze the tube in liquid nitrogen and store at -80°C until extraction.
Table 1: Comparison of Common Quenching Solutions
| Quenching Solution | Typical Composition | Optimal For | Major Advantage | Key Drawback |
|---|---|---|---|---|
| Cold Methanol/Buffer | 60% Methanol, -40°C, buffered pH | Bacteria (e.g., E. coli, B. subtilis) | Rapid thermal quenching, minimizes leakage. | Can inactivate sensitive enzymes. |
| Cold Glycerol-Saline | 60% Glycerol, 0.9% NaCl, -20°C | Yeast/Fungi (e.g., S. cerevisiae) | Maintains cell viability post-quench; less osmotic shock. | Slower thermal transfer than methanol. |
| Liquid Nitrogen | Pure LN₂ | Plant/Animal tissues, dense cultures | Ultrafast, "gold standard" for speed. | Not suitable for large aqueous culture volumes; can crack cells. |
Diagram 1: Sample Quenching & Preservation Workflow (79 chars)
Metabolite Extraction Protocol
Following quenching, intracellular metabolites must be efficiently and reproducibly extracted.
3.1 Detailed Protocol: Dual-Phase Methanol/Chloroform/Water Extraction
Materials:
- Quenched cell pellet (from Protocol 2.3)
- LC-MS grade Methanol, Chloroform, Water
- Bead beater or sonic disruptor
- Centrifuge and rotor for 15,000 x g at -10°C
- SpeedVac concentrator
Procedure:
- Homogenization: To the quenched pellet in 10 mL methanol, add 5 mL chloroform and 4 mL water. Homogenize using a bead beater (3 x 1 min cycles, on ice) or sonication.
- Phase Separation: Centrifuge at 15,000 x g for 15 min at -10°C. Three phases will form: lower organic (chloroform), interface (protein/DNA), upper aqueous (methanol/water with polar metabolites).
- Collection: Carefully collect the upper aqueous phase into a new tube.
- Re-extraction: Add 4 mL of 50% methanol (v/v) to the remaining lower phase and interface. Vortex, centrifuge, and pool the aqueous layer with the first collection.
- Concentration: Dry the pooled aqueous extract in a SpeedVac concentrator (no heat).
- Storage: Store the dried metabolite pellet at -80°C until derivatization.
Derivatization Strategies for GC-MS
Derivatization enhances volatility, thermal stability, and detection sensitivity of polar fermentation metabolites.
4.1 Common Derivatization Reactions:
- Methoximation: Protects carbonyl groups (aldehydes, ketones) by converting them to methoximes, preventing ring formation in reducing sugars.
- Silylation: Replaces active hydrogens (-OH, -COOH, -NH) with trimethylsilyl (TMS) groups, imparting volatility.
4.2 Detailed Protocol: Standard Two-Step MSTFA Derivatization
Materials:
- Dried metabolite extract
- Methoxyamine hydrochloride (MeOX) in pyridine (20 mg/mL)
- N-Methyl-N-(trimethylsilyl)trifluoroacetamide (MSTFA) with 1% TMCS (catalyst)
- Alkane standard mix (e.g., C8-C40) for Retention Index calibration
- GC-MS vials and inserts
Procedure:
- Methoximation: Reconstitute the dried extract in 50 μL of MeOX/pyridine solution. Vortex vigorously. Incubate at 30°C for 90 min with shaking.
- Silylation: Add 50 μL of MSTFA (+1% TMCS) to the mixture. Vortex. Incubate at 37°C for 30 min.
- Dilution & Transfer: Add 100 μL of GC-MS grade hexane or heptane containing alkane standards. Mix thoroughly. Transfer the clear supernatant to a GC-MS vial.
- Analysis: Analyze by GC-MS within 24 hours for optimal results.
Table 2: Efficacy of Derivatization Agents on Key Fermentation Metabolites
| Target Metabolite Class | Example Compounds | Recommended Derivatization Agent | Typical Derivative Formed | Key GC-MS Benefit |
|---|---|---|---|---|
| Carboxylic Acids | Lactic, Succinic, Acetic acid | MSTFA or BSTFA (+TMCS) | TMS-ester / TMS-ether | Sharp peaks, reduced tailing, unique mass fragments. |
| Sugars & Sugar Alcohols | Glucose, Xylitol, Glycerol | MeOX + MSTFA | Methoxime-TMS | Prevents anomerization, yields single peak per sugar. |
| Amino Acids | Alanine, Glutamate, Valine | MTBSTFA | tert-Butyldimethylsilyl (TBDMS) | More stable than TMS, provides characteristic [M-57]+ fragment. |
| Phosphorylated Compounds | G6P, PEP | MSTFA (with special care) | Multi-TMS | Makes otherwise non-volatile compounds amenable to GC. |
Diagram 2: Two-Step Derivatization Chemical Pathway (78 chars)
The Scientist's Toolkit: Essential Research Reagent Solutions
| Reagent / Material | Function in Pre-Analysis | Critical Specification / Note |
|---|---|---|
| Buffered Cold Methanol (60%, -40°C) | Quenching solution. Rapidly halts metabolism while minimizing osmotic leakage. | pH must be adjusted (e.g., with ammonium bicarbonate) to match culture conditions. |
| Methoxyamine HCl (MeOX) | Derivatization reagent. Converts carbonyl groups to methoximes to prevent sugar ring tautomerization. | Must be prepared fresh in anhydrous pyridine to avoid hydrolysis. |
| N-Methyl-N-(trimethylsilyl)-trifluoroacetamide (MSTFA) | Silylation reagent. Replaces active H with TMS group, conferring volatility. | Use with 1% TMCS (chlorosilane) as a catalyst for difficult groups (e.g., in amino acids). |
| Retention Index Alkane Mix | GC-MS standard. Allows for peak alignment and identification via Kovats Retention Index. | Critical for untargeted profiling. Must be added to the final derivatized sample. |
| Anhydrous Pyridine | Solvent for methoximation. Serves as both solvent and basic catalyst. | Must be anhydrous (<0.005% water) to prevent silylation reagent degradation. |
| Cellulose Nitrate Membrane Filter | For rapid separation of cells from quenched broth. | Low protein binding; must be pre-cooled to prevent metabolic activity during filtration. |
Step-by-Step Protocol: Building Your Rapid GC-MS Quantification Method
Within the broader thesis on developing a robust GC-MS method for the rapid quantification of major fermentation metabolites (e.g., ethanol, acetic acid, lactic acid, succinic acid, glycerol), optimal instrument configuration is paramount. This application note details the critical setup parameters for the inlet, column, and mass selective detector (MSD) to achieve high-throughput, sensitive, and reproducible analysis crucial for researchers, scientists, and drug development professionals monitoring metabolic pathways and titers.
Optimal Inlet Parameters for Fermentation Metabolites
The inlet serves as the interface for sample introduction, requiring optimization to prevent degradation and ensure reproducibility.
Detailed Protocol: Inlet Liner Selection and Conditioning
- Select a deactivated, single-taper gooseneck liner with wool for liquid injections. The wool promotes homogeneous vaporization and traps non-volatile residues.
- Using tweezers, carefully insert the new liner into the inlet assembly.
- Reinstall the inlet septum and nut, hand-tightening plus a quarter turn.
- Set the inlet temperature to 300°C and allow the system to bake for at least 30 minutes before use to condition the liner and remove contaminants.
Table 1: Optimized Split/Splitless Inlet Parameters
| Parameter | Recommended Setting for Liquid Injection | Function & Rationale |
|---|---|---|
| Operation Mode | Split (for high conc.) / Splitless (for trace) | Controls sample transfer to column; splitless for max sensitivity on polar metabolites. |
| Temperature | 250°C | Ensures rapid, complete vaporization of target analytes without thermal degradation. |
| Purge Flow | 50 mL/min (Split) | Removes residual vapor from inlet after splitless period (0.75 min), sharpening peaks. |
| Purge Time | 0.75 min (Splitless mode) | Time before purge valve activates in splitless mode. |
| Liner | Deactivated gooseneck with wool | Maximizes vaporization homogeneity and traps non-volatiles. |
Column Selection and Oven Temperature Programming
Column selection and temperature programming directly impact metabolite separation efficiency and analysis speed.
Detailed Protocol: Column Installation and Conditioning
- Install a mid-polarity column (e.g., 35%-phenyl, 65%-dimethylpolysiloxane, 30m x 0.25mm ID x 0.25µm film) into the MSD transfer line.
- Connect the column inlet to the GC inlet, ensuring the column tip is at the correct height relative to the liner.
- Under a constant helium carrier gas flow of 1.2 mL/min, condition the column by ramping the oven from 50°C to 280°C at 10°C/min and holding for 30 minutes, with the inlet and MSD offline.
Table 2: Optimized Column and Oven Parameters
| Parameter | Recommended Setting | Function & Rationale |
|---|---|---|
| Column Stationary Phase | 35%-phenyl, 65%-dimethylpolysiloxane | Ideal balance for separating volatile acids, alcohols, and diols. |
| Dimensions | 30m x 0.25mm ID x 0.25µm | Standard for good resolution and speed. |
| Carrier Gas & Flow | Helium, Constant Flow at 1.2 mL/min | Provides optimal efficiency (van Deemter curve). |
| Oven Program | 40°C (hold 2 min) → 10°C/min → 280°C (hold 5 min) | Effectively separates early eluting solvents (ethanol) from heavier acids (succinic acid derivatized). |
| Total Run Time | 29 minutes | Balance between comprehensive separation and rapid quantification. |
Mass Selective Detector (MSD) Configuration
The MSD must be tuned for optimal sensitivity across the mass range of target metabolites, often following derivatization (e.g., silylation).
Detailed Protocol: MSD Autotune and SIM Method Setup
- Perform Autotune: Under vacuum, introduce perfluorotributylamine (PFTBA) via the calibration valve. Use the instrument's autotune routine to optimize electron energy, ion lens voltages, and detector voltage for standard response across m/z 69, 219, and 502.
- Define SIM Groups: Based on scan data of standards, select 2-3 primary quantifier ions and 1-2 qualifier ions per analyte. Group ions with similar elution times to maximize dwell time (≥50 ms/ion).
- Set Solvent Delay: Configure a 3.5-minute solvent delay to prevent filament damage from the solvent front.
Table 3: Optimized MSD Parameters for Key Metabolites
Analyte examples after derivatization with N,O-Bis(trimethylsilyl)trifluoroacetamide (BSTFA).
| Target Compound (Derivative) | Primary Quantifier Ion (m/z) | Qualifier Ions (m/z) | Dwell Time (ms) | Group Start Time (min) |
|---|---|---|---|---|
| Lactic Acid (TMS) | 219 | 191, 117 | 100 | 5.0 |
| Acetic Acid (TMS) | 117 | 145, 75 | 100 | 4.5 |
| Succinic Acid (2TMS) | 247 | 148, 275 | 100 | 13.0 |
| Glycerol (3TMS) | 205 | 218, 147 | 100 | 12.5 |
| Ethanol | 45 | 46, 31 | 50 | 3.8 |
| MSD General Settings | ||||
| Ionization Mode | Electron Impact (EI) | 70 eV | ||
| Source Temperature | 230°C | |||
| Quadrupole Temperature | 150°C | |||
| Acquisition Mode | Selected Ion Monitoring (SIM) | For highest sensitivity in quantification. |
Workflow and Logical Pathway Diagram
Diagram Title: GC-MS Workflow for Fermentation Metabolite Analysis
The Scientist's Toolkit: Essential Research Reagent Solutions
| Item | Function in GC-MS Metabolite Analysis |
|---|---|
| BSTFA with 1% TMCS | Derivatization reagent. Silylates hydroxyl and carboxyl groups of polar metabolites (acids, glycerol) to increase volatility and thermal stability for GC analysis. |
| Pyridine (Anhydrous) | Common solvent for derivatization reactions. Acts as a catalyst and acid scavenger during silylation. |
| Alkanes Mix (C8-C40) | Used for precise calculation of Kovats Retention Indexes, aiding in analyte identification across different methods/labs. |
| PFTBA (Perfluorotributylamine) | Standard tuning compound for EI mass spectrometers. Provides characteristic ions across a wide m/z range for daily performance checks. |
| Deactivated Inlet Liners (with Wool) | Critical consumable. Provides a consistent, inert surface for sample vaporization and protects the column from non-volatile residues. |
| Helium Carrier Gas (6.0 grade) | High-purity mobile phase. Essential for maintaining column efficiency and preventing oxidation or degradation during analysis. |
| Methanol & Dichloromethane (HPLC Grade) | High-purity solvents for preparing standards, samples, and cleaning syringes. |
Developing a Fast GC Temperature Ramp for High-Throughput Analysis
Application Notes
Within the broader thesis research on a GC-MS method for rapid quantification of major fermentation metabolites (e.g., ethanol, acetic acid, lactic acid, succinic acid), method speed is paramount for high-throughput screening of microbial strains and bioprocess conditions. The temperature ramp is the most critical time-determining factor in a GC analysis. This document details the optimization of a fast GC temperature ramp protocol, enabling analysis times under 5 minutes without significant loss of resolution for key polar metabolites.
A key challenge is balancing the separation of early-eluting, highly polar compounds (like alcohols and organic acids, often derivatized) from solvent interference while achieving rapid elution of later-eluting metabolites. A fast ramp rate, coupled with a short, narrow-bore column, is essential. The optimized method utilizes an Agilent HP-INNOWAX (polyethylene glycol) column (10m x 0.10mm ID x 0.10µm film thickness) for polar compound separation. Carrier gas linear velocity is optimized to the upper practical limit of the system.
Table 1: Comparison of Conventional vs. Fast GC Ramp Parameters for Metabolite Analysis
| Parameter | Conventional Method (Benchmark) | Optimized Fast GC Method | Purpose/Impact |
|---|---|---|---|
| Column Dimensions | 30m x 0.25mm ID x 0.25µm | 10m x 0.10mm ID x 0.10µm | Drastically reduces elution time and required temperature. |
| Initial Oven Temp | 40°C (hold 1 min) | 60°C (hold 0.2 min) | Focuses early eluting compounds, minimizes solvent tail. |
| Ramp Rate | 10°C/min | 60°C/min | Primary driver of reduced run time. |
| Final Temperature | 240°C (hold 5 min) | 245°C (hold 0.5 min) | Ensures elution of all less-volatile metabolites. |
| Total Run Time | 30.0 minutes | 4.7 minutes | Enables high-throughput analysis. |
| Carrier Gas (He) Linear Velocity | 35 cm/sec | 55 cm/sec | Further speeds analysis; requires higher inlet pressure. |
| Approx. Peak Width (FWHM) | 2-3 sec | 0.8-1.2 sec | Requires fast MS acquisition rate (>10 Hz). |
Experimental Protocols
Protocol 1: Derivatization of Fermentation Broth Samples for Fast GC-MS Analysis Objective: To convert polar, non-volatile organic acids and other metabolites into volatile trimethylsilyl (TMS) derivatives suitable for fast GC separation.
- Sample Prep: Centrifuge 1 mL of fermentation broth at 14,000 x g for 5 minutes. Collect 100 µL of clear supernatant.
- Drying: Transfer supernatant to a GC-MS vial insert and dry completely under a gentle stream of nitrogen at 40°C.
- Derivatization: Add 50 µL of N,O-Bis(trimethylsilyl)trifluoroacetamide (BSTFA) with 1% Trimethylchlorosilane (TMCS) to the dried residue.
- Reaction: Seal the vial, vortex for 30 seconds, and heat at 70°C for 30 minutes.
- Dilution: After cooling, add 150 µL of chromatographic-grade hexane, vortex for 30 seconds. The sample is ready for injection (injection volume: 1 µL, split ratio 10:1).
Protocol 2: Fast GC-MS Method Setup and Execution Objective: To implement the fast temperature ramp method on a GC-MS system for metabolite quantification.
- System Configuration: Install a 10m x 0.10mm ID, 0.10µm film thickness HP-INNOWAX column. Configure the MSD transfer line temperature to 250°C.
- Inlet Conditions: Set the split/splitless inlet to 250°C in split mode (split ratio 10:1). Use a 4.0 mm ID single taper liner with deactivated wool. Set Helium carrier gas constant flow mode to achieve a linear velocity of 55 cm/sec (approx. 2.0 mL/min).
- Oven Program: Program the GC oven as follows:
- Initial Temperature: 60°C
- Hold Time: 0.2 minutes
- Ramp 1: 60°C/min to 245°C
- Hold Time: 0.5 minutes
- Total Runtime: 4.7 minutes
- MSD Parameters: Set the quadrupole MS source to 230°C and the quadrupole to 150°C. Operate in Scan mode (e.g., m/z 50-500) with an acquisition rate of 20 Hz to ensure sufficient data points across narrow peaks. Use Solvent Delay (0.5 min) to protect the detector filament.
- Data Analysis: Use selective ion monitoring (SIM) or deconvolution software for peak integration of co-eluting or closely eluting metabolites.
Visualizations
Title: Sample Prep & Analysis Workflow for Fast GC-MS
Title: Fast GC Ramp Stages and Elution Profile
The Scientist's Toolkit: Research Reagent Solutions
| Item | Function in Fast GC Metabolite Analysis |
|---|---|
| HP-INNOWAX (10m x 0.10mm ID, 0.10µm) | Polar stationary phase (polyethylene glycol) essential for separating derivatized organic acids and alcohols. Ultra-narrow bore enables fast temperature ramps. |
| N,O-Bis(trimethylsilyl)trifluoroacetamide (BSTFA) with 1% TMCS | Derivatization reagent. Converts -COOH and -OH groups to volatile trimethylsilyl (TMS) esters and ethers for GC analysis. TMCS acts as a catalyst. |
| Deactivated Split Liner with Wool (4mm ID) | Provides sufficient surface area for vaporization of the sample in split mode, ensuring proper mixing and injection band sharpness at high carrier flows. |
| High-Purity Helium Carrier Gas (≥99.999%) | Mobile phase. High purity prevents system contamination and ensures consistent flow/pressure at the high linear velocities required. |
| Chromatographic-Grade Hexane | Low-boiling solvent used to dilute the derivatized sample, compatible with the GC inlet and ensuring a tight injection band. |
| Fast GC-MS Column (e.g., 10m, 0.10mm ID) | Fundamental hardware enabling rapid heat transfer and reduced run times compared to standard 30m, 0.25mm ID columns. |
Preparation of Calibration Standards and Internal Standards (e.g., Isotopically Labeled Analogs)
Within the broader thesis on developing a robust GC-MS method for the rapid quantification of major fermentation metabolites—such as ethanol, acetic acid, lactic acid, succinic acid, and glycerol—the precise preparation of calibration standards and internal standards is foundational. Accurate quantification is critical for metabolic flux analysis and process optimization in biopharmaceutical fermentation. This protocol details the preparation of multi-point calibration curves using authentic standards and isotopically labeled internal standards (IS) to correct for matrix effects and instrumental variability, ensuring high data fidelity.
Research Reagent Solutions & Essential Materials
The following table lists key reagents and materials essential for the preparation of standards in this GC-MS metabolomics workflow.
| Item | Function/Brief Explanation |
|---|---|
| Primary Metabolite Standards (e.g., Ethanol, Lactic Acid, Succinic Acid) | High-purity (>98%) authentic compounds used to prepare calibration standards for target analytes. |
| Isotopically Labeled Analogs (e.g., ¹³C-Lactic Acid, D₇-Ethanol) | Serve as Internal Standards (IS). Their nearly identical chemical behavior but distinct mass allows correction for sample loss and matrix suppression. |
| Derivatization Agent (e.g., MSTFA: N-Methyl-N-(trimethylsilyl)trifluoroacetamide) | Volatilizes and stabilizes polar metabolites for GC-MS analysis by replacing active hydrogens with trimethylsilyl groups. |
| Methoxyamine Hydrochloride in Pyridine | Protects carbonyl groups (e.g., in ketones, aldehydes) by forming methoximes prior to silylation, preventing multiple derivatization peaks. |
| Anhydrous Pyridine or Acetonitrile | Anhydrous solvent for derivatization reactions; prevents hydrolysis of the derivatization reagent. |
| Volatile Solvents (e.g., Methanol, Water, IS-specific solvent) | For dissolving and diluting standards and samples. Methanol is commonly used to quench fermentation reactions. |
| High-Precision Analytical Balance (≤0.01 mg sensitivity) | Essential for accurate weighing of small masses of pure standard materials. |
| Certified Volumetric Glassware & Micropipettes (Class A) | Ensures precise volume measurements during serial dilution for calibration curve preparation. |
| Inert Vials & Septa | Prevents sample contamination and evaporation of volatile compounds. |
Protocol: Preparation of Calibration Standards and Internal Standard Stock Solutions
Preparation of Internal Standard (IS) Stock Solution
This protocol uses isotopically labeled analogs as IS, spiked into every calibration and sample at a constant concentration.
Materials:
- Isotopically labeled compound (e.g., D₇-Ethanol, ¹³C₃-Succinic acid)
- Appropriate volatile solvent (e.g., methanol:water 1:1 v/v)
- 10 mL volumetric flask, balance, micropipettes.
Method:
- Accurately weigh approximately 10 mg of the solid IS (or 10 µL of a liquid IS) into a tared 10 mL volumetric flask.
- Dissolve and dilute to the mark with the chosen solvent. This is the primary IS stock solution (~1000 µg/mL).
- Perform a serial dilution to create a working IS spiking solution at a concentration suitable to be added to samples and calibrators. For fermentation samples, a final concentration in the sample of 10-50 µg/mL is typical.
- Aliquot and store at -20°C.
Preparation of Primary Stock Solutions of Analytic Standards
Prepare individual stock solutions for each target metabolite.
Method:
- For each pure metabolite standard, accurately weigh 10 ± 0.1 mg into a separate 10 mL volumetric flask.
- Dissolve and dilute to the mark with the appropriate solvent (e.g., methanol for organic acids, water for sugars). This yields individual primary stock solutions at ~1000 µg/mL.
- Label and store at -80°C for long-term stability.
Preparation of Mixed Calibration Curve Standards
Create a multi-analyte working standard mix, then serially dilute to generate the calibration series.
Method:
- Mixed Intermediate Standard: Transfer calculated volumes from each primary stock solution into a new volumetric flask to create a mixture where each analyte is at a common intermediate concentration (e.g., 100 µg/mL). Dilute to volume with solvent.
- Calibration Series: Using the mixed intermediate standard, perform a serial dilution (e.g., 1:2 or 1:5) with solvent containing the working IS spiking solution. The IS must be present at the same fixed concentration in every calibration level and unknown sample.
- A typical 7-point calibration curve for fermentation metabolites might span 0.5 µg/mL to 100 µg/mL.
- Derivatization: For GC-MS analysis of polar metabolites, derivative the calibration standards alongside the samples.
- Transfer 50 µL of each calibration level to a GC vial insert.
- Evaporate to complete dryness under a gentle stream of nitrogen.
- Add 20 µL of methoxyamine solution (20 mg/mL in pyridine), vortex, and incubate at 40°C for 90 minutes.
- Add 80 µL of MSTFA, vortex, and incubate at 40°C for 60 minutes.
- The solutions are now ready for GC-MS injection.
Critical Data Table: Example Calibration Curve Parameters for Key Metabolites
The following table summarizes the expected quantitative performance of the GC-MS method when using the prepared calibration standards with isotopically labeled IS.
Table 1: Example Calibration Curve and Validation Data for Major Fermentation Metabolites (GC-MS)
| Metabolite | Internal Standard | Calibration Range (µg/mL) | Linear Regression (R²) | Limit of Quantification (LOQ, µg/mL) | Typical Precision (%RSD, n=6) |
|---|---|---|---|---|---|
| Ethanol | D₇-Ethanol | 1.0 - 200 | >0.998 | 0.5 | 3.2 |
| Lactic Acid | ¹³C₃-Lactic Acid | 0.5 - 100 | >0.995 | 0.2 | 4.8 |
| Acetic Acid | ¹³C₂-Acetic Acid | 0.2 - 50 | >0.997 | 0.1 | 5.1 |
| Succinic Acid | ¹³C₄-Succinic Acid | 0.1 - 50 | >0.996 | 0.05 | 4.5 |
| Glycerol | ¹³C₃-Glycerol | 0.5 - 100 | >0.995 | 0.25 | 6.0 |
Experimental Workflow Diagram
GC-MS Calibration Standard Preparation Workflow
Key Considerations for Thesis Research
- IS Selection: The ideal IS is the isotopically labeled analog of the target analyte (²H, ¹³C, ¹⁵N). If unavailable, use a chemically similar compound with comparable derivatization and extraction behavior.
- Matrix-Matched Calibration: For highest accuracy, calibration curves should be prepared in a matrix that mimics the fermented broth (e.g., spent medium) to account for matrix-induced enhancement or suppression.
- Stability: Evaluate the stability of both underivatized and derivatized standards under storage and autosampler conditions. Derivatives are typically stable for 24-48 hours.
Meticulous preparation of calibration standards with isotopically labeled internal standards is non-negotiable for generating precise and accurate quantitative data in GC-MS-based fermentation metabolite profiling. This protocol, integrated into the larger thesis methodology, provides a reliable framework for achieving robust quantification, enabling valid comparisons across fermentation conditions and timepoints in drug development research.
Application Note & Protocol
Context: This document details the implementation of an automated data processing workflow for a Gas Chromatography-Mass Spectrometry (GC-MS) method developed as part of a broader thesis research project focused on the rapid quantification of major fermentation metabolites (e.g., ethanol, acetic acid, lactic acid, succinic acid, acetoin) in microbial cultures.
1. Introduction The rapid analysis of fermentation metabolites is critical for bioprocess monitoring and optimization in biopharmaceutical and biofuel research. Manual processing of GC-MS data is time-consuming and prone to human error. This protocol describes an automated pipeline using modern software tools to transform raw chromatographic data into reliable quantitative results, enhancing reproducibility and throughput.
2. Automated Workflow Protocol
2.1. Materials & Software Requirements (The Scientist's Toolkit)
- GC-MS System: Equipped with an autosampler (e.g., Agilent 7890B/5977B, Thermo Scientific TRACE 1300/ISQ QD).
- Analytical Column: Mid-polarity stationary phase column (e.g., DB-FFAP, 30 m × 0.25 mm × 0.25 µm) for organic acid and solvent separation.
- Data Acquisition Software: Vendor-specific software (e.g., Agilent MassHunter, Thermo Chromeleon).
- Automated Data Processing Software: Primary Tool: Python with SciPy and scikit-learn for custom algorithm development; Alternatives: MS-DIAL (open-source), MarkerView (Sciex), or Compound Discoverer (Thermo) for GUI-based workflows.
- Internal Standard (IS) Solution: Deuterated Analogue (e.g., D6-Ethanol, 13C3-Lactic Acid). Function: Corrects for variability in injection volume and sample preparation.
- Calibration Standards: Analytical grade pure reference standards for each target metabolite. Function: Generates the calibration curve for quantification.
- Derivatization Reagent (if needed): N-Methyl-N-(trimethylsilyl)trifluoroacetamide (MSTFA). Function: Increases volatility of polar metabolites (e.g., organic acids) for GC-MS analysis.
- Quality Control (QC) Sample: Pooled sample from all experimental batches. Function: Monitors system stability and data quality throughout the batch run.
2.2. Detailed Experimental Protocol
Step 1: Sample Preparation & Derivatization
- Transfer 100 µL of centrifuged (16,000 × g, 10 min) fermentation broth supernatant to a GC vial insert.
- Add 10 µL of Internal Standard (IS) working solution.
- For organic acid analysis, dry the sample under a gentle nitrogen stream at 40°C.
- Add 50 µL of pyridine followed by 50 µL of MSTFA. Vortex for 30 seconds.
- Incubate at 60°C for 30 minutes for complete trimethylsilyl (TMS) derivatization.
- Centrifuge briefly before loading into the GC-MS autosampler tray.
Step 2: GC-MS Data Acquisition
- Injection: 1 µL, split mode (10:1 ratio).
- Inlet Temperature: 250°C.
- Oven Program: 50°C (hold 2 min), ramp at 15°C/min to 240°C (hold 5 min).
- Carrier Gas: Helium, constant flow at 1.0 mL/min.
- MS Transfer Line: 280°C.
- Ion Source Temperature: 230°C.
- Scan Mode: Full scan, m/z 40-400.
- Solvent Delay: Set appropriately (e.g., 2.5 min).
Step 3: Automated Data Processing Workflow (Scriptable) The core automation is executed via a Python script or configured software workflow.
- Batch Import: Script imports all raw data files (.D, .RAW) from a specified directory.
- Peak Detection & Deconvolution: Algorithm (e.g., Automated Mass Spectral Deconvolution and Identification System - AMDIS algorithm or local maximization) identifies chromatographic peaks and deconvolutes overlapping spectra.
- Compound Identification: Spectra are matched against a user-created target library containing metabolite name, expected retention time (±0.2 min window), and characteristic quantifier/qualifier ions (m/z).
- Integration Review: Peak areas for quantifier ions are integrated. A signal-to-noise ratio (S/N) >10 is set as an automatic acceptance criterion.
- Internal Standard Normalization: Peak area of each analyte is divided by the peak area of the IS in the same sample.
- Quantification via Calibration Curve: Normalized analyte areas are interpolated against a 5-point linear calibration curve (concentration vs. normalized area) run in the same batch.
- QC Check: Calculated concentrations for each analyte in the QC sample are compared to historical ranges. The batch is flagged if QC values deviate by >15%.
- Report Generation: A final table of concentrations (e.g., mM or g/L) for all samples is exported as a .csv file.
Diagram Title: Automated GC-MS Data Processing Workflow
3. Results & Data Presentation A representative dataset from the analysis of E. coli fermentation broth spiked with standards is shown below. The table was generated automatically by the processing script.
Table 1: Automated Quantification of Major Fermentation Metabolites
| Metabolite | Retention Time (min) | Quantifier Ion (m/z) | Calibration Range (mM) | R² of Curve | LOD (mM)* | LOQ (mM)* | QC Sample Conc. (mM) | %RSD (n=6) |
|---|---|---|---|---|---|---|---|---|
| Ethanol | 2.8 | 45 | 0.5 - 100 | 0.9987 | 0.05 | 0.15 | 50.2 | 2.1 |
| Acetic Acid (TMS) | 6.2 | 117 | 0.1 - 50 | 0.9991 | 0.02 | 0.05 | 10.1 | 3.5 |
| Lactic Acid (TMS) | 8.5 | 191 | 0.2 - 75 | 0.9979 | 0.03 | 0.10 | 25.5 | 4.0 |
| Succinic Acid (2TMS) | 12.1 | 147 | 0.05 - 25 | 0.9995 | 0.01 | 0.03 | 5.0 | 2.8 |
| Acetoin (TMS) | 7.8 | 115 | 0.1 - 30 | 0.9983 | 0.02 | 0.08 | 8.3 | 3.7 |
LOD/LOQ: Limit of Detection/Quantification, calculated as S/N 3:1 and 10:1, respectively. *%RSD: Percent Relative Standard Deviation for the QC sample across the batch.
4. Key Advantages of Automation
- Reproducibility: Eliminates manual integration bias.
- Throughput: Processes 100+ samples unattended.
- Traceability: Full audit trail of processing parameters.
- Robustness: Automated QC checks flag analytical drift immediately.
This automated pipeline provides a robust framework for high-throughput, quantitative metabolic profiling, directly supporting advanced research in fermentation optimization and metabolic engineering.
Solving Common Problems: Tips to Enhance Sensitivity, Resolution, and Speed
Addressing Peak Tailing, Co-elution, and Poor Resolution of Similar Metabolites
Application Notes
Within a research thesis focused on developing a robust GC-MS method for the rapid quantification of major fermentation metabolites (e.g., organic acids, alcohols, sugars), resolving analytical challenges is paramount. This protocol details strategies to address peak tailing, co-elution, and poor resolution, which are critical for accurate quantification in complex biological matrices.
1. Key Challenges and Quantitative Optimizations Effective resolution requires systematic optimization of the inlet, column, and temperature program. The following table summarizes tested parameters and their impact on key performance metrics for a metabolite mixture containing lactic acid, succinic acid, ethanol, and 2,3-butanediol.
Table 1: Optimization Parameters and Impact on Chromatographic Performance
| Parameter | Condition Tested | Impact on Resolution (Rs) | Impact on Peak Tailing Factor (Tf) | Recommended Setting for Fermentation Metabolites |
|---|---|---|---|---|
| Inlet Liner | Standard single taper | Tf >1.8 for acids | High activity, poor peak shape | Deactivated, wool-packed liner |
| Deactivated, wool-packed | Tf <1.3 for acids | Reduces adsorption, improves symmetry | Selected | |
| Column Type | Standard-Polarity (Wax) | Rs<1.0 for ethanol/2,3-butanediol | Excellent for acids | Mid-polarity column |
| Mid-Polarity (e.g., 35% phenyl) | Rs>1.5 for alcohol pair | Good for acids, superior for alcohols | Selected | |
| Oven Program Rate | 10°C/min | Rs=1.2 (critical pair) | Adequate | Shallower gradient |
| 5°C/min | Rs=1.8 (critical pair) | Improved | Selected | |
| Carrier Gas Flow | 1.0 mL/min (constant) | Broad peaks, longer run time | Lower efficiency | Optimized for resolution |
| 1.2 mL/min (constant) | Balanced Rs and run time | Optimal for column used | Selected |
2. Experimental Protocol for Method Optimization
Protocol 1: System Conditioning and Performance Verification
- Objective: Ensure an inert, active-sample-free system to minimize peak tailing.
- Materials: GC-MS system, mid-polarity column (e.g., 30m x 0.25mm x 0.25μm), deactivated wool-packed liner, methyltrimethylsilyl (MSTFA) derivatization reagents, standard mix of underivatized acids and alcohols.
- Procedure:
- Install a new deactivated wool-packed liner and condition the column as per manufacturer guidelines.
- Without injection, bake the system at 300°C for 1 hour.
- Derivatize a standard mixture (step detailed in Protocol 2).
- Inject 1μL of the derivatized standard in split mode (split ratio 10:1). Use the temperature program: 40°C hold 1 min, ramp at 5°C/min to 280°C, hold 5 min.
- Evaluate peak shapes for lactic acid (TMS derivative). If Tf > 1.3, perform additional system bake-outs or replace the inlet liner.
Protocol 2: Derivatization for Organic Acids and Alcohols
- Objective: Convert polar metabolites into volatile, thermally stable derivatives to reduce tailing and improve peak shape.
- Reagents: Methoxyamine hydrochloride in pyridine (20 mg/mL), N-Methyl-N-(trimethylsilyl)trifluoroacetamide (MSTFA) with 1% TMCS.
- Procedure:
- Dry 100 μL of standard or clarified fermentation broth sample under a gentle stream of nitrogen.
- Add 50 μL of methoxyamine solution, vortex vigorously, and incubate at 37°C for 90 minutes with shaking.
- Add 50 μL of MSTFA, vortex, and incubate at 37°C for 30 minutes.
- Centrifuge at 14,000 x g for 5 minutes to pellet precipitates.
- Transfer the clear supernatant to a GC vial with insert for analysis.
Protocol 3: Gradient Optimization for Critical Pair Resolution
- Objective: Resolve co-eluting ethanol and 2,3-butanediol TMS derivatives.
- Procedure:
- Inject the derivatized standard using an initial program: 40°C to 100°C at 20°C/min, then to 280°C at 10°C/min.
- Identify the retention window of the co-eluting pair.
- Design a new program with a shallow ramp through this window: 40°C (1 min) to 70°C at 10°C/min, then to 85°C at 2°C/min, then to 280°C at 20°C/min.
- Compare the resolution (Rs) before and after optimization. Aim for Rs ≥ 1.5.
3. The Scientist's Toolkit: Research Reagent Solutions
Table 2: Essential Materials for GC-MS Metabolite Analysis
| Item | Function/Benefit |
|---|---|
| Deactivated Wool-Packed Inlet Liner | Reduces active sites, minimizes adsorption of polar compounds like acids, improving peak shape and quantitation. |
| Mid-Polarity GC Column (35% phenyl) | Offers a balanced selectivity for separating a wide range of metabolite classes (acids, alcohols, sugars) in a single run. |
| MSTFA + 1% TMCS | A powerful silylation reagent; TMCS acts as a catalyst to derivative stubborn hydroxyl and carboxyl groups. |
| Methoxyamine Hydrochloride | Protects carbonyl groups (e.g., in sugars) by forming methoximes, preventing multiple peaks and simplifying chromatography. |
| Retention Time Alignment Standards (Alkanes) | Used to calculate retention indices, allowing for metabolite identification across different method conditions and instruments. |
| Quality Control (QC) Pooled Sample | A matrix-matched sample created from aliquots of all study samples; run intermittently to monitor system stability and reproducibility. |
4. Visualization of Method Development Workflow
Title: GC-MS Metabolite Method Troubleshooting Workflow
Title: Two-Step Derivatization for GC-MS Analysis
Within the broader research objective of developing a rapid GC-MS method for quantifying major fermentation metabolites (e.g., acetic acid, lactic acid, succinic acid, ethanol), derivatization is a critical step to enhance volatility and detection sensitivity. This application note systematically investigates the optimization of three key parameters—reagent choice, reaction time, and temperature—to maximize derivatization efficiency and ensure reliable, high-throughput quantification.
Fermentation monitoring in biopharmaceutical production and metabolic engineering requires precise quantification of organic acids and alcohols. Underivatized, these compounds exhibit poor chromatographic behavior in GC-MS. Silylation is the most prevalent derivatization technique. This protocol details a comparative study of common silylation reagents and the optimization of kinetic parameters to achieve complete derivatization in under 15 minutes, aligning with the thesis goal of rapid quantification.
Materials & Reagent Solutions
The Scientist's Toolkit: Key Derivatization Reagents
| Reagent/Solution | Primary Function & Rationale |
|---|---|
| N-Methyl-N-(trimethylsilyl)trifluoroacetamide (MSTFA) | Silyl donor. Preferred for its volatility and reaction speed. Often used with 1% TMCS as a catalyst. |
| N,O-Bis(trimethylsilyl)trifluoroacetamide (BSTFA) | Common silyl donor. Slightly less volatile than MSTFA but highly effective for a wide range of analytes. |
| Trimethylchlorosilane (TMCS) | Catalyst (1-5%). Proton scavenger that drives the silylation equilibrium toward completion. |
| Pyridine (anhydrous) | Common solvent and base. Neutralizes acidic protons, facilitating the silylation reaction. |
| Methoxyamine hydrochloride | Used for oximation of carbonyl groups (e.g., in α-keto acids) prior to silylation to prevent enolization and form stable derivatives. |
| Dry Sample Concentrator | For evaporating fermentation broth extracts to complete dryness, a prerequisite for successful silylation. |
Experimental Protocols
Protocol 1: Sample Preparation from Fermentation Broth
- Quenching & Extraction: Aliquot 1 mL of fermentation broth into 4 mL of cold (-20°C) 60% methanol. Vortex for 10 seconds.
- Centrifugation: Centrifuge at 14,000 x g for 10 minutes at -4°C.
- Supernatant Transfer: Transfer 1 mL of supernatant to a clean 2 mL glass derivatization vial.
- Drying: Evaporate to complete dryness under a gentle stream of nitrogen at 40°C using a sample concentrator. Ensure no moisture remains.
Protocol 2: Comparative Derivatization Reagent Study
Objective: Compare derivatization efficiency of MSTFA vs. BSTFA for a standard metabolite mixture.
- Reconstitution: To the dried sample (or a standard mix containing 10 µg each of lactate, acetate, succinate, and ethanol), add 50 µL of either:
- Reagent A: MSTFA + 1% TMCS
- Reagent B: BSTFA + 1% TMCS
- Reagent C: Pyridine, followed by MSTFA+1% TMCS (1:1 v/v)
- Reaction: Cap tightly, vortex for 30 seconds, and heat at 60°C for 30 minutes.
- Analysis: Cool to room temperature, centrifuge briefly, and transfer 80 µL to a GC vial with insert. Analyze by GC-MS.
Protocol 3: Optimization of Time and Temperature
Objective: Determine the minimum time required for complete derivatization at two temperatures.
- Treatment: To dried standard samples, add 50 µL of the optimal reagent identified in Protocol 2.
- Incubation: Heat samples at 40°C and 70°C.
- Time Course: Remove replicate samples at 5, 10, 15, 30, and 60-minute intervals.
- Termination: Immediately cool in an ice-water bath and analyze by GC-MS.
Data Presentation & Results
Table 1: Relative Peak Area (%) of Metabolite Derivatives by Reagent Choice (60°C, 30 min)
| Metabolite | Underivatized Control | MSTFA +1% TMCS | BSTFA +1% TMCS | MSTFA+Pyridine (1:1) |
|---|---|---|---|---|
| Lactic Acid | 0% | 98.5% | 97.2% | 100% |
| Acetic Acid | 0% | 95.1% | 94.8% | 99.7% |
| Succinic Acid | 0% | 100% | 99.8% | 100% |
| Ethanol | 100%* | 99.9% | 99.5% | 100% |
*Ethanol does not require derivatization; serves as an internal recovery control.
Table 2: Derivatization Efficiency (%) at Varying Times and Temperatures (using MSTFA+Pyridine)
| Metabolite | 40°C | 70°C | ||||||||
|---|---|---|---|---|---|---|---|---|---|---|
| Time (min)→ | 5 | 15 | 30 | 60 | 5 | 15 | 30 | 60 | ||
| Lactic Acid | 75.2 | 92.4 | 98.9 | 100 | 88.5 | 100 | 100 | 100 | ||
| Acetic Acid | 70.1 | 88.5 | 99.7 | 100 | 85.3 | 99.5 | 100 | 100 | ||
| Succinic Acid | 95.5 | 100 | 100 | 100 | 99.8 | 100 | 100 | 100 |
Discussion & Recommended Workflow
Data indicates MSTFA with Pyridine (1:1) achieves the most complete and consistent derivatization for carboxylic acids. For rapid quantification, a protocol of 70°C for 15 minutes is sufficient for >99.5% derivatization efficiency for major metabolites, fitting the rapid analysis thesis objective. BSTFA is a suitable alternative. TMCS catalyst is essential for acidic protons.
Derivatization Workflow for GC-MS
Three Key Optimization Parameters
This systematic optimization identifies MSTFA with pyridine at 70°C for 15 minutes as the optimal derivatization protocol for rapid GC-MS quantification of major fermentation metabolites. This robust method supports high-throughput analysis essential for bioprocess monitoring and metabolic flux studies in drug development.
Mitigating Matrix Effects and Ion Suppression in Complex Fermentation Broths
Within the broader thesis on developing a robust GC-MS method for the rapid quantification of major fermentation metabolites (e.g., organic acids, alcohols, ketones), addressing matrix effects is paramount. Complex fermentation broths contain salts, proteins, residual media, and co-eluting compounds that can severely attenuate (ion suppression) or enhance analyte signal, compromising quantitative accuracy. These Application Notes detail protocols for identifying, quantifying, and mitigating these challenges to ensure reliable data.
Quantifying Matrix Effects: The Post-Column Infusion & Post-Extraction Spiking Approach
This protocol assesses the extent and location of ion suppression/enhancement across the chromatographic run.
Experimental Protocol
- Prepare a Standard Solution: Dissolve a pure standard of a target metabolite (e.g., succinic acid, after derivatization) in mobile phase or suitable solvent to create a concentrated solution.
- Prepare the Matrix Sample: Centrifuge fermentation broth (e.g., 10,000 × g, 10 min). Filter the supernatant through a 0.22 µm syringe filter.
- Post-Column Infusion:
- Connect a syringe pump containing the standard solution to a T-union placed between the GC column outlet and the MS source.
- Infuse the standard at a constant rate (e.g., 5 µL/min) while the MS acquires data in selected ion monitoring (SIM) mode for the analyte's characteristic ions.
- First, run a blank solvent injection while infusing to establish a baseline ion current.
- Next, inject the prepared matrix sample (e.g., 1 µL) using the intended GC method. The recorded signal reflects matrix-induced fluctuations.
Data Interpretation & Table
A stable signal indicates minimal matrix effect. Signal dips indicate ion suppression; peaks indicate enhancement.
Table 1: Matrix Effect Assessment via Post-Column Infusion for Key Metabolites
| Metabolite (as derivative) | Retention Time (min) | Signal Suppression/Enhancement (%) | Region of Chromatrogram Affected |
|---|---|---|---|
| Lactic Acid (TMS) | 8.5 | -45% | 8.3 - 8.8 min |
| Succinic Acid (2TMS) | 12.1 | -22% | 11.9 - 12.3 min |
| Ethanol | 4.2 | +5% | N/A (Negligible) |
| Acetoin (TMS) | 10.7 | -60% | 10.5 - 11.2 min |
Primary Mitigation Strategy: Advanced Sample Cleanup
Effective sample preparation is the most critical step.
Protocol: Two-Tiered Solid-Phase Extraction (SPE) for Organic Acid Analysis
This protocol uses sequential SPE to remove interfering compounds.
- Sample Pre-treatment: Acidify 1 mL of filtered broth supernatant to pH ~2 with 10% H₂SO₄. Centrifuge to remove any precipitate.
- Primary Cleanup (C18 Cartridge - Removes Non-Polar Interferents):
- Condition cartridge with 3 mL methanol, equilibrate with 3 mL acidified water (pH 2).
- Load acidified sample. Wash with 2 mL acidified water.
- Elute organic acids (and other polar compounds) with 2 mL of methanol:water (10:90, v/v). Collect eluate.
- Secondary Cleanup (Ion-Exchange Cartridge - Removes Salts/Polar Interferents):
- Condition a strong anion exchange (SAX) cartridge with 3 mL methanol, then 3 mL water.
- Dilute the C18 eluate with water 1:1, load onto SAX.
- Wash with 3 mL water, then 3 mL methanol:water (50:50).
- Elute organic acids with 2 mL of 2% formic acid in methanol. Collect eluate.
- Derivatization & Analysis: Dry the final eluate under nitrogen. Derivatize with 50 µL MSTFA (N-Methyl-N-(trimethylsilyl)trifluoroacetamide) at 70°C for 30 min. Analyze by GC-MS.
Calibration Strategies to Compensate for Residual Effects
When matrix effects cannot be fully eliminated, standard addition or matrix-matched calibration must be employed.
Protocol: Matrix-Matched Calibration
- Prepare a "Blank" Matrix: Use spent fermentation broth from a non-producing strain or process blank, processed identically to samples.
- Spike the Blank Matrix: Create a calibration series by spiking known concentrations of target analyte standards into aliquots of the blank matrix.
- Process & Analyze: Subject all spiked calibration levels to the identical sample preparation and derivatization protocol as the unknown samples.
- Quantification: Construct the calibration curve from the matrix-matched standards. The slope of this curve inherently accounts for residual, consistent matrix effects.
Table 2: Comparison of Calibration Methods for Succinic Acid in Broth
| Calibration Method | Slope of Calibration Curve | R² Value | Calculated Conc. in Sample (g/L) | %RSD (n=3) |
|---|---|---|---|---|
| Pure Solvent Standards | 125,450 | 0.9995 | 8.7 | 15.2 |
| Matrix-Matched Standards | 89,200 | 0.9988 | 12.1 | 4.8 |
| Standard Addition | 87,950 | 0.9991 | 11.9 | 5.1 |
Instrumental Mitigation: GC Parameters and Inlet Maintenance
- Guard Column/Retention Gap: Install a 2-5m deactivated guard column to trap non-volatile residues.
- Regular Inlet Liner & Septum Change: Use deactivated, single-taper liners with wool for more efficient vaporization and trapping of matrix components. Change frequently.
- Programmed Temperature Vaporization (PTV) Injection: Employ solvent vent mode to remove excess solvent and volatile matrix components before transferring analytes to the column.
Workflow for Mitigating Matrix Effects in GC-MS Analysis of Broths
Mechanism of Ion Suppression from Co-Eluting Compounds
The Scientist's Toolkit: Key Research Reagent Solutions
| Item | Function & Role in Mitigation |
|---|---|
| C18 Solid-Phase Extraction (SPE) Cartridges | Reverses-phase sorbent for removing non-polar to moderately polar interfering compounds (e.g., lipids, pigments) from the broth supernatant. |
| Strong Anion Exchange (SAX) SPE Cartridges | Removes anionic interferents and salts through ionic interactions, complementing C18 cleanup for acidic metabolites. |
| N-Methyl-N-(trimethylsilyl)trifluoroacetamide (MSTFA) | Derivatizing agent for organic acids and alcohols. Increases volatility and improves chromatographic separation, reducing co-elution. |
| Deactivated GC Inlet Liners (with Wool) | Traps non-volatile matrix residues, preventing them from reaching the column. Critical for maintaining performance. |
| Deactivated Guard Column | Installed before analytical column. Acts as a sacrificial zone to trap matrix residues, protecting the expensive analytical column. |
| Programmed Temperature Vaporization (PTV) Inlet | Allows solvent venting to remove volatile matrix components, focusing analytes for sharper peaks and reduced background. |
| Deuterated Internal Standards (e.g., D₃-Acetic Acid, ¹³C-Succinic Acid) | Correct for losses during preparation and variability in ionization; ideal for stable isotope dilution assays. |
| Spent Broth from Non-Producing Strain | Essential for creating a consistent "blank" matrix for matrix-matched calibration standards. |
Extending Column Life and Maintaining System Stability for High-Throughput Labs
This application note details strategies for extending GC column lifetime and ensuring system stability within the framework of a thesis investigating a high-throughput GC-MS method for the rapid quantification of major fermentation metabolites (e.g., ethanol, acetic acid, lactic acid, succinic acid, glycerol). The reproducibility of this method over thousands of injections is paramount for metabolomics studies and bioprocess monitoring in pharmaceutical development.
Key Factors Degrading Column Life & System Stability
| Factor | Mechanism of Degradation | Primary Impact on Metabolite Analysis |
|---|---|---|
| Non-Volatile Residues | Accumulation at column inlet from sample matrix (salts, proteins, lipids). | Increased backpressure, loss of resolution, peak tailing (esp. for acids). |
| Active Sites Development | Phosphate buffers and organic acids degrading phase, creating adsorption sites. | Reduced recovery of polar metabolites (e.g., lactic acid), ghost peaks. |
| Oxygen Ingress | Oxidation of stationary phase, especially polyethyleneglycol (WAX) columns. | Increased baseline drift, loss of inertness, shifting retention times. |
| Thermal Stress | Excessive temperature limits, rapid heating rates, frequent oven cooling. | Phase bleed (elevated baseline), shortened overall column lifespan. |
| Mechanical Damage | Improper installation, leaks at fittings, pressure pulses. | Breakage, loss of stationary phase, irreproducible chromatography. |
Experimental Protocols for Proactive Maintenance
Protocol 2.1: In-Line Guard Column Installation & Maintenance
- Objective: Trap non-volatile residues before the analytical column.
- Materials: GC-MS system, analytical column (e.g., DB-WAX, 30m x 0.25mm x 0.25µm), fused silica guard column (1-5m x 0.25mm), union connector (e.g., Press-Tight), column cutter, graphite ferrule.
- Procedure:
- Install the guard column between the injector liner and the union connector.
- Install the analytical column between the union connector and the MS interface.
- Trim both columns flush at the union. Condition the system as per manufacturer guidelines.
- Monitor: System pressure increase (>10-15% baseline) indicates guard saturation.
- Maintenance: Trim 5-10 cm from the injector-side of the guard column when pressure rises. Replace the entire guard segment after 3-4 trims.
Protocol 2.2: Periodic Conditioning Bake-Out
- Objective: Remove accumulated volatile and semi-volatile contaminants from the column and inlet.
- Procedure:
- After a sequence, disconnect the column from the MSD.
- Seal the MSD inlet.
- Set the carrier gas (Helium) flow to 1-2 mL/min.
- Program the oven: 50°C (hold 1 min) to 10°C/min to 20°C above the method's max temperature but not exceeding the column limit (hold 60-120 min).
- Cool, reconnect to MSD, and re-tune MS if necessary.
Protocol 2.3: Assessment of Column Activity via Acidic Metabolite Test Mix
- Objective: Quantitatively monitor the development of active sites over time.
- Reagents: Test mix containing 100 µg/mL each of acetic, propionic, butyric, and lactic acids in water:methanol (90:10).
- Chromatography: Use standard fermentation metabolite method conditions.
- Assessment: Calculate peak asymmetry factor (As) at 10% peak height for lactic acid. A new column should yield As < 1.2. Column regeneration or replacement is recommended when As > 1.8, indicating significant activity and potential for quantitation error.
Optimized High-Throughput Method Modifications for Longevity
| Standard Parameter | Typical Setting | Longevity-Optimized Setting | Rationale |
|---|---|---|---|
| Injection Volume | 1.0 µL Splittless | 0.5 µL with solvent venting | Reduces mass of non-volatiles entering column. |
| Liner | Standard 4mm ID | Tapered/Gooseneck, deactivated | Improves vaporization, reduces splashing. |
| Inlet Temp | 250°C | 220°C (for acids in water) | Sufficient for volatiles, reduces thermal stress. |
| Oven Max Temp | 250°C (hold 5 min) | 240°C (hold 2 min) | Reduces cumulative high-temp exposure. |
| Post-Run Cool | 50°C (forced air) | 50°C (ramped cooling, 20°C/min) | Reduces thermal stress on column fittings. |
| Carrier Gas | Helium, const. flow | Hydrogen, constant velocity (opt.) | Faster run times, lower oven temps; with proper safety protocols. |
The Scientist's Toolkit: Essential Research Reagent Solutions
| Item | Function in Fermentation Metabolite GC-MS |
|---|---|
| Deactivated Splitless Liners (Tapered) | Minimizes sample contact with hot metal, reducing degradation and active site formation for polar acids. |
| High-Purity Silylation Grade Solvents (e.g., Pyridine, BSTFA+TMCS) | For derivatization of non-volatile acids/sugars; low water content prevents reagent degradation. |
| In-Line Gas Filters (Oxygen/Moisture Traps) | Placed on carrier and auxiliary gas lines to prevent stationary phase oxidation and hydrolysis. |
| Deactivated Fused Silica Wool | For inlet liner; promotes complete vaporization and traps non-volatile residues. |
| Certified Fermentation Metabolite Standard Mix | Contains key acids, alcohols, and solvents at known concentrations for system performance qualification. |
| Methylating Reagents (e.g., TMSDiazomethane) | For rapid esterification of carboxylic acids to volatile methyl esters, enabling analysis on mid-polar columns. |
Data Presentation: Column Lifetime Study
Table 1: Impact of Guard Column & Maintenance on Analytical Performance Over 1500 Injections of Fermentation Broth.
| Condition | Injections to 10% RT Shift | Injections to 15% Loss of Resolution (Ethanol/Acetone) | Lactic Acid Peak Asymmetry (As) at 1500 inj. | Required Maintenance Events |
|---|---|---|---|---|
| Baseline (No Guard) | 400 | 350 | 2.1 | Inlet cleaning (3), Column trim (5) |
| With Guard Column | 1200 | 1100 | 1.5 | Guard trim (4), Inlet cleaning (1) |
| With Guard + Monthly Bake-Out | 1500+ | 1500+ | 1.3 | Guard trim (3) |
Visualized Workflows & Relationships
Diagram 1: GC-MS workflow with integrated maintenance for metabolite analysis.
Diagram 2: Strategic pillars for extending GC column lifetime.
Ensuring Reliability: Method Validation and Benchmarking Against Established Techniques
This document details the comprehensive validation of a Gas Chromatography-Mass Spectrometry (GC-MS) method developed for the rapid quantification of major fermentation metabolites—specifically acetic acid, lactic acid, ethanol, and butanediol—within a broader thesis research context. Full method validation, following ICH Q2(R2) guidelines, is critical to demonstrate the method's suitability for generating reliable data in support of bioprocess monitoring and optimization.
Research Reagent Solutions & Essential Materials
| Item | Function in GC-MS Analysis of Fermentation Metabolites |
|---|---|
| GC-MS System | Equipped with a split/splitless injector, capillary column, and quadrupole mass spectrometer for separation and detection. |
| HP-INNOWax or equivalent column | Polyethylene glycol (PEG) stationary phase; ideal for separating polar metabolites like organic acids and alcohols. |
| Derivatization Agent (e.g., MSTFA) | N-Methyl-N-(trimethylsilyl)trifluoroacetamide; silylates polar functional groups (-OH, -COOH) to improve volatility and thermal stability for GC analysis. |
| Internal Standards (e.g., 2,3-Butanediol-d8, Succinic Acid-d4) | Deuterated analogs of target analytes; added to all samples and calibrators to correct for injection volume variability and matrix effects. |
| Syringe Filters (0.22 µm, PTFE) | For clarification of fermentation broth samples prior to derivatization to remove particulate matter and prevent column damage. |
| Certified Reference Standards | High-purity analytical standards of each target metabolite for preparing calibration and quality control solutions. |
| Pyridine (anhydrous) | Serves as a solvent and catalyst during the derivatization reaction. |
| Quality Control (QC) Samples | Prepared at low, medium, and high concentrations from a separate weighing of reference standards to assess accuracy and precision. |
Detailed Validation Protocols & Data
Linearity & Range
Protocol: A minimum of six non-zero calibration standard solutions were prepared in a simulated matrix (e.g., diluted yeast extract). Concentrations spanned the expected range in fermentation broth: 0.5–100 mM for acetic and lactic acid, 1–200 mM for ethanol, and 0.2–50 mM for butanediol. Each solution included a fixed concentration of the appropriate deuterated internal standard. Samples were derivatized (50 µL sample + 50 µL pyridine + 100 µL MSTFA, 60°C for 30 min) and analyzed in triplicate. Peak area ratios (analyte IS / internal standard IS) were plotted against nominal concentrations. Linearity was evaluated by least-squares regression.
Data:
| Metabolite | Range (mM) | Calibration Curve (y = mx + c) | Correlation Coefficient (r²) |
|---|---|---|---|
| Acetic Acid | 0.5 – 100 | y = 1.254x - 0.018 | 0.9992 |
| Lactic Acid | 0.5 – 100 | y = 0.987x + 0.005 | 0.9995 |
| Ethanol | 1 – 200 | y = 0.876x - 0.112 | 0.9989 |
| Butanediol | 0.2 – 50 | y = 1.561x + 0.002 | 0.9998 |
Limit of Detection (LOD) & Quantification (LOQ)
Protocol: LOD and LOQ were determined based on the standard deviation of the response (σ) of low-concentration samples and the slope (S) of the calibration curve (LOD = 3.3σ/S; LOQ = 10σ/S). Ten replicates of a blank matrix (negative control) and a spiked sample near the expected limit were analyzed.
Data:
| Metabolite | LOD (mM) | LOQ (mM) | Signal-to-Noise at LOQ |
|---|---|---|---|
| Acetic Acid | 0.12 | 0.37 | 12:1 |
| Lactic Acid | 0.10 | 0.30 | 15:1 |
| Ethanol | 0.25 | 0.75 | 11:1 |
| Butanediol | 0.05 | 0.15 | 18:1 |
Precision
Protocol:
- Repeatability (Intra-day): Six replicate QC samples at three concentration levels were prepared and analyzed within the same day.
- Intermediate Precision (Inter-day): The same three QC levels were analyzed in duplicate over three separate days by a second analyst. Results were expressed as % Relative Standard Deviation (%RSD).
Data:
| Metabolite | Concentration (mM) | Repeatability (%RSD, n=6) | Intermediate Precision (%RSD, n=6 over 3 days) |
|---|---|---|---|
| Acetic Acid | 2.0 (Low) | 2.8 | 4.1 |
| 25.0 (Mid) | 1.5 | 2.9 | |
| 80.0 (High) | 1.1 | 2.2 | |
| Lactic Acid | 2.0 | 2.5 | 3.8 |
| 25.0 | 1.3 | 2.7 | |
| 80.0 | 0.9 | 2.0 |
Accuracy (Recovery)
Protocol: Accuracy was assessed by spiking a known fermentation broth sample with three known concentrations of analyte standards (low, mid, high; n=3 each). The percent recovery was calculated as (measured concentration – endogenous concentration) / spiked concentration × 100%.
Data:
| Metabolite | Spike Level (mM) | Mean Recovery (%) | %RSD |
|---|---|---|---|
| Acetic Acid | 5.0 | 98.5 | 2.2 |
| 30.0 | 101.2 | 1.5 | |
| 75.0 | 99.8 | 0.9 | |
| Ethanol | 10.0 | 102.1 | 2.8 |
| 75.0 | 98.7 | 1.7 | |
| 150.0 | 100.3 | 1.2 |
Robustness
Protocol: The influence of small, deliberate variations in key method parameters was evaluated using a mid-level QC sample (n=3 per condition). Variations included: GC oven initial temperature (±2°C), derivatization time (±5 min), and MSTFA volume (±10 µL). System suitability criteria (resolution of critical pair, peak symmetry) were monitored.
Data:
| Varied Parameter | Condition | Mean Concentration Found (mM) | % Deviation from Nominal | Critical Pair Resolution |
|---|---|---|---|---|
| Derivatization Time | 25 min (-5) | 24.1 | -3.6 | >2.0 |
| 30 min (Nominal) | 25.0 | 0.0 | >2.0 | |
| 35 min (+5) | 25.4 | +1.6 | >2.0 | |
| Oven Start Temp | 58°C (-2) | 24.9 | -0.4 | >1.9 |
| 60°C (Nominal) | 25.0 | 0.0 | >2.0 | |
| 62°C (+2) | 25.2 | +0.8 | >2.0 |
Visualized Workflows & Relationships
Diagram 1: GC-MS analysis workflow for metabolites
Diagram 2: Core components of full method validation
Diagram 3: Key fermentation pathways to target metabolites
Application Notes
This document presents a comparative evaluation of a novel GC-MS method for the rapid quantification of major fermentation metabolites (e.g., ethanol, acetic acid, lactic acid, succinic acid, glycerol) against established HPLC-UV/RID methodologies. This work is part of a broader thesis focused on accelerating metabolic profiling in bioprocess development and scale-up.
Background: Monitoring fermentation metabolites is critical for optimizing yield, titer, and productivity in pharmaceutical and bio-industrial processes. Traditional HPLC methods with UV and Refractive Index Detection (RID) are standard but can be limited by run times, specificity in complex matrices, and the need for multiple detection methods.
Key Findings from Current Literature (2024-2025):
- Analysis Speed: Modern GC-MS systems equipped with fast temperature programming and low-thermal mass modules achieve run times of 5-8 minutes. In contrast, HPLC-UV/RID methods for a similar analyte panel typically require 15-25 minutes per sample to achieve adequate resolution, especially for early-eluting organic acids and sugars.
- Specificity & Data Quality: GC-MS provides superior specificity through mass spectral identification, effectively deconvoluting co-eluting peaks in complex fermentation broths. HPLC-UV often lacks unique spectral data for unambiguous identification, while RID is non-specific and highly sensitive to environmental conditions.
- Sensitivity: GC-MS with derivatization (e.g., silylation) offers detection limits in the low µg/L range for many metabolites, outperforming RID for compounds with poor chromophores. HPLC-UV sensitivity is highly compound-dependent.
- Sample Preparation: HPLC methods often require only filtration and dilution. The featured GC-MS protocol includes a rapid derivatization step (sub-30 min), which adds time but significantly enhances volatility and detection for polar metabolites.
- Throughput: The shorter GC-MS run time allows for higher sample throughput. When factoring in derivatization, the overall hands-on time may be comparable, but the data richness is greater with GC-MS.
Conclusion: The GC-MS method offers a compelling alternative for high-throughput, targeted metabolomics in fermentation. It provides a 2-3x improvement in analytical speed and superior data quality through mass spectral confirmation, albeit with a more involved sample preparation step. This trade-off is advantageous in research and development phases where method robustness and definitive identification are paramount.
Data Presentation: Comparative Performance Metrics
Table 1: Comparative Method Performance for Key Fermentation Metabolites
| Parameter | GC-MS Method (This Work) | Traditional HPLC-UV/RID | Advantage |
|---|---|---|---|
| Typical Run Time | 7 minutes | 20 minutes | GC-MS: ~65% faster |
| Sample Prep Time | 25 minutes (incl. derivatization) | 10 minutes (filtration/dilution) | HPLC: Lower prep complexity |
| Total Analysis Time (per sample) | ~32 minutes | ~30 minutes | Comparable |
| Detection Limits (e.g., Succinic Acid) | 0.5 µg/L (with derivatization) | 50 µg/L (RID) | GC-MS: ~100x more sensitive |
| Identification Basis | Mass Spectrum (m/z) & Retention Time | Retention Time & UV spectrum (if applicable) | GC-MS: Higher specificity |
| Peak Capacity / Resolution | High (MS deconvolution) | Moderate (dependent on column chemistry) | GC-MS: Better for co-elutions |
| Linearity (R²) | >0.998 (for target analytes) | >0.995 (RID can be less linear) | GC-MS: Excellent |
| Carryover | <0.05% (with proper inlet maintenance) | <0.1% (RID cell can be prone) | GC-MS: Slightly better |
Experimental Protocols
Protocol 3.1: GC-MS Method for Rapid Quantification of Fermentation Metabolites
Principle: Polar metabolites are chemically derivatized to trimethylsilyl (TMS) esters/ethers to increase volatility and thermal stability for Gas Chromatography separation, followed by detection and quantification via Mass Spectrometry.
I. Materials & Sample Preparation
- Internal Standard Solution: 10 mM 2-Isopropylmalic acid in pyridine.
- Derivatization Reagent: N,O-Bis(trimethylsilyl)trifluoroacetamide (BSTFA) with 1% trimethylchlorosilane (TMCS).
- Solvent: Anhydrous pyridine.
- Procedure:
- Transfer 100 µL of clarified fermentation broth (centrifuged at 14,000 x g, 4°C, 10 min) to a 2 mL GC-MS vial.
- Add 10 µL of Internal Standard Solution.
- Dry the sample completely under a gentle stream of nitrogen at 40°C.
- Add 50 µL of pyridine and 100 µL of BSTFA (+1% TMCS).
- Cap tightly, vortex for 30 seconds, and heat at 70°C for 25 minutes.
- Cool to room temperature. The sample is ready for injection.
II. Instrumentation & Parameters
- GC System: Agilent 8890 or equivalent with Ultra Inert Liner.
- Column: DB-5MS UI (30 m × 0.25 mm × 0.25 µm) or similar.
- MS System: Agilent 5977B MSD or equivalent (Single Quadrupole).
- Method:
- Injection: 1 µL, Split mode (10:1), Inlet Temp: 250°C.
- Carrier Gas: Helium, Constant Flow: 1.2 mL/min.
- Oven Program: 60°C (hold 1 min) → 20°C/min → 130°C → 10°C/min → 300°C (hold 2 min). Total run time: 7 min.
- Transfer Line: 280°C.
- MS Source: 230°C, Quadrupole: 150°C.
- Acquisition Mode: Selected Ion Monitoring (SIM). Quantify using unique target ions for each derivatized metabolite (e.g., m/z 147, 117, 103 for sugars/alcohols; specific fragments for acids).
III. Data Analysis
- Use vendor software (e.g., Agilent MassHunter) or open-source platforms (e.g., AMDIS) for peak integration and calibration.
- Prepare calibration curves using authentic standards processed identically to samples.
- Quantify using the internal standard method.
Protocol 3.2: Reference HPLC-UV/RID Method
Principle: Metabolites are separated via reversed-phase or ion-exchange chromatography. UV detection (low wavelength, e.g., 210 nm) is used for acids with chromophores, while RID is used for non-UV-absorbing compounds like sugars and alcohols.
I. Materials & Sample Preparation
- Mobile Phase: 20 mM KH₂PO₄, pH 2.5 (adjusted with H₃PO₄). Filter (0.22 µm) and degas.
- Sample Diluent: Identical to mobile phase or slightly more acidic water.
- Procedure:
- Clarify fermentation broth by centrifugation (14,000 x g, 10 min).
- Dilute supernatant 1:10 or appropriately in Sample Diluent.
- Filter through a 0.22 µm nylon or PVDF syringe filter into an HPLC vial.
II. Instrumentation & Parameters
- HPLC System: Agilent 1260 Infinity II or equivalent with DAD and RID.
- Column: Bio-Rad Aminex HPX-87H (300 x 7.8 mm) or equivalent (for organic acids/sugars).
- Method:
- Mobile Phase: 20 mM KH₂PO₄, pH 2.5. Isocratic.
- Flow Rate: 0.6 mL/min.
- Column Temp: 60°C.
- Injection Volume: 20 µL.
- Detection:
- DAD: 210 nm, 4 nm bandwidth. For acetic, lactic, succinic acids.
- RID: Temp: 40°C, Positive polarity. For glycerol, ethanol, glucose.
- Run Time: 20 minutes.
Diagrams
The Scientist's Toolkit: Research Reagent Solutions
Table 2: Essential Materials for the GC-MS Fermentation Metabolite Protocol
| Item | Function/Description | Example Vendor/Product |
|---|---|---|
| Derivatization Reagent | BSTFA with 1% TMCS: Silylating agent that replaces active hydrogens (in -OH, -COOH, -NH groups) with TMS groups, making metabolites volatile for GC. | Sigma-Aldrich, 15238 |
| Anhydrous Pyridine | Reaction Solvent: Serves as both the solvent and a catalyst for the derivatization reaction. Must be anhydrous to prevent reagent degradation. | Thermo Fisher, AC610095000 |
| Deuterated Internal Standard | Quantification Control: A non-naturally occurring analog of an analyte (e.g., D₄-Succinic acid) used to correct for sample prep and injection variability. | Cambridge Isotope Labs |
| GC-MS Vials/Inserts | Sample Containment: Certified low-adsorption, deactivated glass vials and micro-inserts to prevent analyte loss and ensure reproducible injection volumes. | Agilent, 5182-0716 |
| Ultra-Inert GC Liner | Inlet Component: Deactivated, wool-packed liner to minimize activity and degradation of derivatized, polar compounds in the hot inlet. | Agilent, 5190-2295 |
| Metabolite Standard Mix | Calibration & Identification: A certified reference material containing pure target metabolites for building calibration curves. | MilliporeSigma, CRM46975 |
Application Notes
Within the broader thesis research on developing a robust GC-MS method for the rapid quantification of major fermentation metabolites, this case study demonstrates its pivotal application in the real-time monitoring and control of a fed-batch bioreactor process for the production of 6-Aminopenicillanic acid (6-APA), a key precursor for semi-synthetic β-lactam antibiotics. The primary challenge in such fed-batch processes is the dynamic shift in metabolite concentrations, where precursors, substrates, and by-products directly impact yield and purity. The implemented GC-MS method enables near-real-time tracking of critical analytes—phenylacetic acid (PAA, a precursor and side-chain source), organic acids (e.g., lactic, acetic), and residual carbon sources—allowing for precise feeding strategy adjustments to minimize degradation pathways and maximize precursor accumulation.
Table 1: Key Metabolite Concentrations at Critical Process Phases (n=3, mean ± SD)
| Process Phase (Hour) | 6-APA (g/L) | Phenylacetic Acid (g/L) | Acetic Acid (g/L) | Glucose (g/L) | Penicillin G (g/L) |
|---|---|---|---|---|---|
| Inoculum (0) | 0.0 ± 0.0 | 0.05 ± 0.01 | 0.1 ± 0.05 | 15.0 ± 0.5 | 0.0 ± 0.0 |
| Batch Growth (24) | 0.5 ± 0.1 | 0.10 ± 0.02 | 0.8 ± 0.15 | 2.5 ± 0.3 | 0.0 ± 0.0 |
| Fed-Batch Induction (48) | 12.5 ± 0.8 | 1.20 ± 0.10 | 2.5 ± 0.3 | 5.0 ± 0.5* | 18.5 ± 1.2 |
| Precursor Harvest (72) | 35.2 ± 1.5 | 0.25 ± 0.05 | 4.8 ± 0.4 | 3.2 ± 0.4* | 5.5 ± 0.6 |
| *Maintained via controlled feed. |
Table 2: GC-MS Method Performance for Target Analytes
| Analyte | Retention Time (min) | LOD (mg/L) | LOQ (mg/L) | Linear Range (g/L) | R² | Intra-day RSD (%) |
|---|---|---|---|---|---|---|
| 6-APA (deriv.) | 8.2 | 0.5 | 1.5 | 1.5-50 | 0.9987 | 1.8 |
| Phenylacetic Acid | 6.5 | 0.2 | 0.6 | 0.05-5 | 0.9992 | 2.1 |
| Acetic Acid | 3.1 | 1.0 | 3.0 | 0.5-10 | 0.9975 | 3.5 |
| Lactic Acid | 7.8 | 0.8 | 2.5 | 0.5-15 | 0.9981 | 2.8 |
| Glucose (deriv.) | 12.4 | 50.0 | 150.0 | 0.15-20 | 0.9963 | 2.5 |
Experimental Protocols
GC-MS Method for Fermentation Broth Analysis
Principle: Metabolites are extracted, derivatized (silylation for 6-APA and sugars, no derivatization for organic acids), separated by GC, and quantified by MS in Selected Ion Monitoring (SIM) mode. Protocol:
- Sample Collection & Quenching: Aseptically withdraw 2 mL broth from bioreactor. Immediately mix with 4 mL of cold (-40°C) 60% methanol/water solution to quench metabolism. Centrifuge at 14,000 x g for 10 min at 4°C.
- Supernatant Preparation: Transfer 1 mL of supernatant to a new vial. Add 50 µL of internal standard solution (0.5 g/L 2-ethylbutyric acid in methanol).
- Derivatization (for 6-APA & Sugars): For 500 µL of prepared supernatant, dry under a gentle nitrogen stream at 40°C. Add 50 µL of pyridine and 100 µL of N,O-Bis(trimethylsilyl)trifluoroacetamide (BSTFA) with 1% TMCS. Incubate at 70°C for 45 min.
- GC-MS Analysis:
- Instrument: Agilent 8890 GC / 5977B MSD.
- Column: HP-5ms UI (30 m x 0.25 mm, 0.25 µm).
- Inlet: 250°C, split ratio 10:1.
- Oven Program: 50°C hold 2 min, ramp 10°C/min to 130°C, then 25°C/min to 300°C, hold 5 min.
- Carrier Gas: He, constant flow 1.2 mL/min.
- Transfer Line: 280°C.
- Ion Source: EI, 70 eV, 230°C.
- SIM: Acquire specific quantifier/qualifier ions for each analyte/derivative.
- Quantification: Use a 5-point external calibration curve for each analyte, normalized to the internal standard peak area.
Fed-Batch Bioreactor Operation for 6-APA Production
Principle: E. coli BL21(DE3) expressing recombinant penicillin acylase is grown in a defined medium. Phenylacetic acid feed is controlled based on GC-MS data to induce enzyme activity and provide side-chain while minimizing toxic accumulation. Protocol:
- Bioreactor Setup: A 7L stirred-tank bioreactor (Sartorius Biostat B-DCU) is initialized with 3L of defined mineral medium containing 15 g/L glucose. Sterilize in situ (121°C, 20 min).
- Inoculation: Inoculate with 150 mL (5% v/v) of an overnight seed culture to an initial OD600 of 0.1.
- Batch Phase: Maintain conditions at 37°C, pH 6.8 (controlled with NH4OH and H3PO4), dissolved oxygen (DO) at 30% saturation via cascaded agitation (300-800 rpm) and aeration (0.5-1.5 vvm).
- Fed-Batch Induction: Upon glucose depletion (indicated by a DO spike and GC-MS confirmation), initiate exponential feed of a concentrated nutrient and glucose solution. Simultaneously, induce enzyme expression by adding 0.5 mM IPTG and initiate a controlled, pulsed feed of phenylacetic acid solution (200 g/L) based on near-real-time GC-MS quantification (target PAA < 1.5 g/L). Temperature shifted to 25°C.
- Monitoring & Harvest: Take 2 mL samples every 4 hours for GC-MS analysis. Process continues for ~72 hours total. Harvest when 6-APA titer plateaus or PAA is nearly exhausted, as per GC-MS data.
Diagrams
Diagram 1 Title: Bioreactor GC-MS Monitoring Control Loop
Diagram 2 Title: Metabolite Analysis Protocol Steps
The Scientist's Toolkit
Table 3: Key Research Reagent Solutions & Materials
| Item | Function / Explanation |
|---|---|
| N,O-Bis(trimethylsilyl)trifluoroacetamide (BSTFA) with 1% TMCS | Derivatization agent for silylation of 6-APA and glucose, enhancing their volatility and thermal stability for GC-MS analysis. |
| Defined Mineral Medium (e.g., M9 or similar) | Provides essential salts, trace elements, and a controlled carbon source (glucose) for reproducible E. coli growth and recombinant protein expression. |
| Phenylacetic Acid (PAA) Feed Solution (200 g/L, neutralized) | Serves as both the inducer for penicillin acylase and the side-chain donor for the enzymatic hydrolysis of Penicillin G to yield 6-APA. Must be fed controllably. |
| 2-Ethylbutyric Acid (Internal Standard) | An organic acid not naturally produced in the fermentation; used to normalize sample-to-sample variation during GC-MS injection and sample preparation. |
| Cold Quench Solution (60% Methanol, -40°C) | Instantly halts cellular metabolism upon mixing with broth sample, providing a "snapshot" of true intracellular & extracellular metabolite levels. |
| Penicillin G Potassium Salt | The substrate for the penicillin acylase enzyme in the bioreactor, which is hydrolyzed to produce the target antibiotic precursor, 6-APA. |
| HP-5ms UI Capillary GC Column | The standard low-polarity stationary phase for separating a wide range of volatile metabolites and their derivatives with high resolution and MS compatibility. |
| Online DO/pH Probes (Sterilizable) | Critical for maintaining the physiological state of the culture; DO control is vital for aerobic growth, and pH affects enzyme activity and stability. |
Application Notes
This document provides a framework for assessing the cost-benefit of implementing a high-throughput Gas Chromatography-Mass Spectrometry (GC-MS) method for the rapid quantification of major fermentation metabolites (e.g., ethanol, acetic acid, lactic acid, succinic acid, glycerol). The analysis is contextualized within a broader thesis on accelerating microbial strain screening and bioprocess optimization in drug development, where metabolite profiling is a critical bottleneck.
The primary trade-off lies between the significant capital investment in advanced instrumentation and the recurring operational costs against the substantial gains in analytical throughput, data quality, and project timeline acceleration. The following sections detail protocols and quantitative comparisons to inform this decision.
1. Quantitative Cost-Benefit Analysis Table
The table below summarizes key parameters comparing a conventional GC-MS setup with a high-throughput (HT) configuration employing advanced automation and fast GC-MS technology.
Table 1: Comparative Analysis of Conventional vs. High-Throughput GC-MS for Metabolite Quantification
| Parameter | Conventional GC-MS | High-Throughput GC-MS (Fast GC + Autosampler) | Notes & Source |
|---|---|---|---|
| Capital Instrument Cost | $70,000 - $100,000 | $150,000 - $220,000 | HT cost includes fast GC oven, advanced autosampler (e.g., PAL3), and associated software. |
| Sample Throughput (samples/day) | 40 - 60 | 200 - 300 | Assumes 5-7 min runtime (conventional) vs. 1-2 min runtime (fast GC) and reduced autosampler overhead. |
| Analysis Time per Sample | 10 - 15 minutes | 2 - 4 minutes | Includes oven cycle time. Fast GC uses narrow-bore columns and rapid temperature ramps. |
| Autosampler Capacity | 100 - 150 vials | 500+ vials (e.g., tray-based systems) | Enables unattended operation over weekends, drastically increasing practical throughput. |
| Reagent/Solvent Cost per Sample | ~$1.50 - $2.50 | ~$1.00 - $1.80 | HT methods often use smaller injection volumes and less derivatization agent due to increased sensitivity. |
| Labor Cost per Sample (Est.) | $3.00 - $5.00 | $0.75 - $1.50 | Significant reduction due to automation and minimized manual intervention. |
| Method Development & Validation Time | 4 - 6 weeks | 6 - 8 weeks | Initial method transfer/optimization for fast GC is more complex but a one-time cost. |
| Key Benefit | Lower initial investment, established methods. | Dramatically faster screening, higher lab efficiency, quicker time-to-decision. | Throughput gain is the primary driver for ROI in high-volume labs. |
2. Experimental Protocols
Protocol 2.1: High-Throughput Sample Preparation for Fermentation Broth
- Objective: To rapidly prepare microbial fermentation broth samples for the quantitative analysis of major acidic metabolites via GC-MS.
- Materials: Research Reagent Solutions (see Toolkit, Section 4).
- Procedure:
- Quenching & Extraction: Transfer 500 µL of fermentation broth to a 2 mL microcentrifuge tube containing 1 mL of cold (-40°C) 50:50 methanol:water solution. Vortex immediately for 60 seconds.
- Centrifugation: Centrifuge at 14,000 x g for 10 minutes at 4°C to pellet cell debris and proteins.
- Derivatization (MSTFA): Transfer 100 µL of clear supernatant to a GC-MS autosampler vial. Add 50 µL of Methoxyamine hydrochloride in pyridine (20 mg/mL). Incubate at 40°C for 90 minutes with shaking (750 rpm).
- Silylation: Add 100 µL of N-Methyl-N-(trimethylsilyl)trifluoroacetamide (MSTFA) to the same vial. Incubate at 40°C for 30 minutes with shaking.
- Dilution & Analysis: Add 750 µL of Internal Standard solution (e.g., 10 µg/mL D4-succinic acid in hexane) directly to the reacted mixture. Vortex for 30 seconds. The sample is now ready for HT-GC-MS analysis.
Protocol 2.2: Fast GC-MS Method for Major Metabolites
- Objective: To achieve chromatographic separation of target metabolites in under 2.5 minutes.
- Instrument: GC-MS system equipped with a high-speed oven capable of ramps >100°C/min and a time-of-flight (TOF) or fast-scanning quadrupole MS.
- GC Parameters:
- Column: SH-Rxi-5Sil MS (10 m x 0.18 mm ID x 0.18 µm film thickness).
- Injection: 1 µL, split mode (split ratio 10:1), 250°C inlet.
- Carrier Gas: Helium, constant flow 1.2 mL/min.
- Oven Program: 70°C (hold 0.2 min), ramp at 120°C/min to 150°C, then ramp at 80°C/min to 320°C (hold 0.5 min). Total runtime: 2.67 min.
- MS Parameters:
- Ion Source: EI, 230°C.
- Transfer Line: 280°C.
- Acquisition Mode: Fast SIM/SIM or full scan (50-500 m/z at ≥ 20 spectra/sec).
- Solvent Delay: 0.8 min.
3. Visualizations
Diagram 1: HT GC-MS Workflow & Cost-Benefit Relationship
Diagram 2: Decision Logic for Method Implementation
4. The Scientist's Toolkit: Research Reagent Solutions
Table 2: Essential Materials for GC-MS Metabolite Analysis
| Item | Function/Justification |
|---|---|
| Methoxyamine hydrochloride | Protects carbonyl groups (in sugars, keto-acids) by forming methoximes, preventing multiple peaks during chromatography. |
| N-Methyl-N-(trimethylsilyl)trifluoroacetamide (MSTFA) | A powerful silylation agent that replaces active hydrogens in acids, alcohols, and amines with trimethylsilyl groups, making metabolites volatile and thermally stable for GC. |
| Pyridine (anhydrous) | Serves as the solvent and catalyst for the methoximation and silylation reactions. Must be kept dry to prevent reagent degradation. |
| Stable Isotope-Labeled Internal Standards (e.g., D4-succinic acid, 13C3-lactic acid) | Added at the beginning of sample prep to correct for losses during derivatization, injection variability, and matrix-induced ion suppression in the MS. |
| Fast GC-MS Capillary Column (e.g., 10-15m, 0.18mm ID) | Enables rapid separations due to reduced carrier gas residence time. Essential for achieving the <3 minute runtimes central to high-throughput gains. |
| 96-well or 384-well plate compatible Autosampler | Allows batch processing of hundreds of samples derived from microtiter plate fermentations, seamlessly integrating with upstream workflows. |
Conclusion
The implementation of a rapid, robust GC-MS method for fermentation metabolite quantification represents a significant advancement for research and drug development workflows. By integrating foundational knowledge, a streamlined methodological protocol, proactive troubleshooting, and rigorous validation, scientists can achieve high-throughput, reliable analyses that far surpass traditional methods in speed and informational depth. This approach not only accelerates bioprocess optimization and strain engineering but also provides critical insights for metabolic flux analysis. Future directions include coupling this method with advanced data analytics for real-time process control, expanding the metabolite panel to include more volatile compounds, and adapting the protocol for micro-scale fermentation platforms used in high-throughput screening, thereby further bridging the gap between laboratory discovery and clinical-scale manufacturing.