Seahorse Metabolic Flux Analysis: A Comprehensive Guide to Cellular Bioenergetics in Research and Drug Development
This article provides a comprehensive overview of Seahorse Extracellular Flux Analysis, a key technology for real-time assessment of cellular metabolism.
Seahorse Metabolic Flux Analysis: A Comprehensive Guide to Cellular Bioenergetics in Research and Drug Development
Abstract
This article provides a comprehensive overview of Seahorse Extracellular Flux Analysis, a key technology for real-time assessment of cellular metabolism. Tailored for researchers, scientists, and drug development professionals, it covers foundational principles of simultaneous oxygen consumption rate (OCR) and extracellular acidification rate (ECAR) measurement, diverse methodological applications across biological models from cancer cells to 3D cultures, critical troubleshooting and normalization strategies for data accuracy, and comparative analysis with traditional metabolic assays. The content synthesizes current advancements and practical implementations to empower robust metabolic phenotyping in biomedical research.
Understanding Seahorse Technology: Core Principles and Cellular Energetics Fundamentals
Extracellular flux (XF) analysis represents a transformative methodology in cellular bioenergetics, enabling real-time, simultaneous measurement of mitochondrial respiration and glycolytic activity in living cells. This application note details the core principles of the Seahorse XF Analyzer, which quantifies the Oxygen Consumption Rate (OCR) and Extracellular Acidification Rate (ECAR) as key proxies for oxidative phosphorylation and glycolysis, respectively. We provide foundational knowledge on assay principles, detailed protocols for metabolic stress tests, and data on the platform's diverse applications across biological disciplines, from cancer research to immunology. Framed within the broader context of cellular energetics research, this document serves as an essential guide for researchers and drug development professionals seeking to interrogate metabolic phenotypes and identify potential therapeutic targets.
Cellular metabolic networks are the cornerstone of life-sustaining functions, driving energy production, biosynthesis, redox regulation, and cellular signaling [1]. The major bioenergetic pathways that generate adenosine triphosphate (ATP) are glycolysis and mitochondrial respiration (oxidative phosphorylation) [2]. Traditionally, measuring metabolic parameters involved labor-intensive methods like Warburg manometry or Clark electrodes, which often required large sample sizes, were invasive, and offered limited throughput [1]. The introduction of the Seahorse Extracellular Flux (XF) analyzer addressed these limitations by providing a real-time, non-invasive, and highly sensitive platform for assessing cellular metabolism in live cells [3] [1]. Its ability to simultaneously measure two key metabolic parameters—OCR and ECAR—from a small population of cells has made it an industry standard in metabolic research [4] [2]. This technology has since become instrumental in diverse fields, significantly advancing our understanding of cell biology and the metabolic underpinnings of various diseases [1].
Fundamental Principles of OCR and ECAR Measurements
The Seahorse XF analyzer operates by directly quantifying changes in the concentration of oxygen and protons in the extracellular fluid immediately surrounding live cells. The instrument uses a sensor cartridge equipped with two embedded fluorophores: one quenched by oxygen and another sensitive to changes in pH [3]. During a measurement, the cartridge is lowered to create a transient microchamber over the cell monolayer. Fiber optics excite the fluorophores, and the resulting emissions are measured, allowing for the calculation of the Oxygen Consumption Rate (OCR) and the Extracellular Acidification Rate (ECAR) [3].
- OCR as a Measure of Mitochondrial Respiration: Oxidative phosphorylation is the process where ATP is synthesized using energy derived from the electron transport chain (ETC). Oxygen acts as the final electron acceptor at complex IV of the ETC and is continuously consumed during this process. Therefore, quantifying the OCR provides a direct proxy for mitochondrial respiratory activity [1].
- ECAR as a Measure of Glycolytic Activity: Glycolysis converts glucose to pyruvate, resulting in the net production of ATP and lactate. The export of lactate and protons (H⁺) into the extracellular environment acidifies the media. Consequently, measuring the rate of this acidification (ECAR) serves as a strong indicator of glycolytic flux in the cell [2] [1].
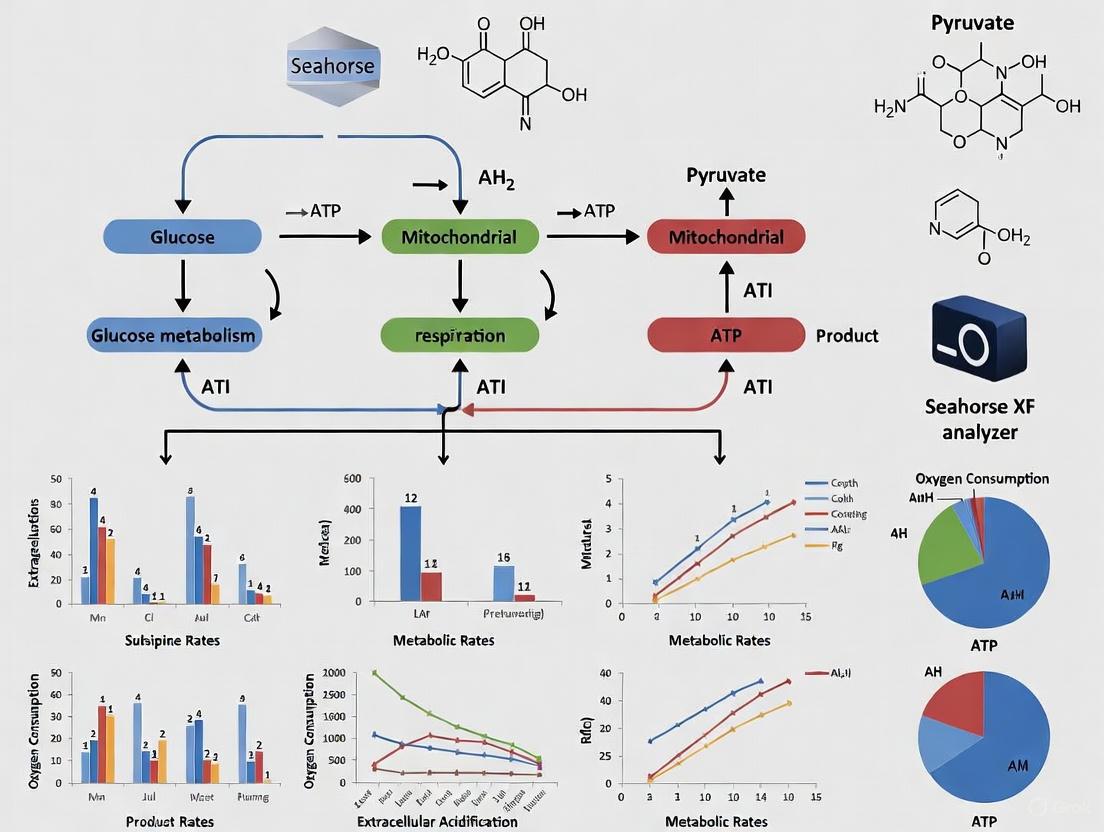
The following diagram illustrates the core metabolic pathways measured by the XF analyzer and how they relate to the OCR and ECAR parameters.
Core Metabolic Assays: Protocols and Workflows
The Mitochondrial Stress Test
The Mitochondrial Stress Test provides a comprehensive profile of mitochondrial function by sequentially injecting compounds that target specific components of the electron transport chain [3] [1]. The standard workflow is as follows:
- Cell Preparation: Plate cells in a specialized XF cell culture plate and allow them to adhere and stabilize for 24 hours. Prior to the assay, replace the growth medium with unbuffered XF assay medium (e.g., DMEM without sodium bicarbonate, pH 7.4) and incubate the plate in a non-CO₂ incubator for 45-60 minutes to equilibrate temperature and pH [3].
- Calibration: Load the sensor cartridge with calibrant solution and calibrate it in the XF analyzer.
- Compound Loading: Load the injection ports of the sensor cartridge with the following mitochondrial inhibitors:
- Port A: Oligomycin (ATP synthase inhibitor)
- Port B: FCCP (mitochondrial uncoupler)
- Port C: Rotenone & Antimycin A (complex I and III inhibitors)
- Assay Execution: Place the cell culture plate in the analyzer and start the assay program. The instrument will measure basal OCR and ECAR, then sequentially inject the compounds from the ports, with measurements taken after each injection.
The resulting OCR profile allows for the calculation of key parameters of mitochondrial function, as summarized in the table below.
Table 1: Key Metabolic Parameters Derived from the Mitochondrial Stress Test
| Parameter | Description | Biological Interpretation |
|---|---|---|
| Basal Respiration | OCR measured before any injections. | The baseline energy demand of the cell under steady-state conditions [1]. |
| ATP-linked Respiration | The drop in OCR after Oligomycin injection. | The portion of mitochondrial respiration used to drive ATP production [1]. |
| Proton Leak | The OCR remaining after Oligomycin. | Respiration not coupled to ATP synthesis, which can indicate mitochondrial inefficiency [1]. |
| Maximal Respiration | The OCR after FCCP injection. | The maximum respiratory capacity of the electron transport chain when it is uncoupled from ATP synthesis [3] [1]. |
| Spare Respiratory Capacity | The difference between Maximal and Basal Respiration. | The cell's ability to respond to increased energy demand, often linked to stress resilience [3]. |
| Non-Mitochondrial Respiration | The OCR remaining after Rotenone/Antimycin A. | Oxygen consumption from cellular processes outside the mitochondrial electron transport chain [1]. |
The Glycolytic Stress Test
This assay provides a detailed look at glycolytic function by sequentially injecting modulators of glycolysis [6]. The protocol is similar to the mitochondrial stress test but uses a different medium and compound set.
- Cell Preparation and Calibration: Follow the same steps as the mitochondrial stress test, but use XF base medium supplemented only with L-glutamine [6].
- Compound Loading: Load the sensor cartridge with:
- Port A: Glucose
- Port B: Oligomycin
- Port C: 2-Deoxy-D-glucose (2-DG), a glucose analog that inhibits glycolysis
- Assay Execution: The analyzer measures basal ECAR/OCR, then injects glucose to reveal the glycolytic response, oligomycin to force maximum glycolytic capacity, and finally 2-DG to confirm that acidification is glycolytic in origin.
Table 2: Key Metabolic Parameters Derived from the Glycolytic Stress Test
| Parameter | Description | Biological Interpretation |
|---|---|---|
| Glycolysis | The increase in ECAR after Glucose injection. | The basal glycolytic capacity of the cells [6]. |
| Glycolytic Capacity | The increase in ECAR after Oligomycin injection. | The maximum rate of glycolysis the cells can achieve when mitochondrial ATP production is inhibited [6]. |
| Glycolytic Reserve | The difference between Glycolytic Capacity and Glycolysis. | The cell's ability to upregulate glycolysis in response to energetic stress. |
| Non-Glycolytic Acidification | The ECAR remaining after 2-DG injection. | Acidification from sources other than glycolysis. |
The following diagram outlines the generalized workflow for performing an extracellular flux assay, from cell preparation to data analysis.
Essential Reagents and Research Toolkit
Successful execution of extracellular flux assays requires careful preparation of specific reagents and media. The following table catalogues key research reagent solutions and their functions.
Table 3: Essential Research Reagent Solutions for Extracellular Flux Assays
| Reagent / Solution | Function and Role in the Assay | Example Preparation |
|---|---|---|
| XF Assay Medium | A bicarbonate-free medium (e.g., DMEM) that allows for precise measurement of pH changes without CO₂ interference. | XF base medium supplemented with 1-25 mM glucose, 1-2 mM L-glutamine, and 1 mM sodium pyruvate for mitochondrial assays [3] [6]. |
| Oligomycin | Inhibits ATP synthase (Complex V). Used to determine ATP-linked respiration and glycolytic capacity. | 10 µM stock solution in DMSO [3] [6]. |
| FCCP | A mitochondrial uncoupler that collapses the proton gradient, forcing the ETC to operate at maximum velocity. Used to measure maximal respiratory capacity. | 5 µM stock solution in DMSO [3]. |
| Rotenone & Antimycin A | Inhibitors of Complex I and III, respectively. They shut down mitochondrial respiration to reveal non-mitochondrial oxygen consumption. | 5 µM stock solutions of each in DMSO, often used in combination [3] [6]. |
| Glucose | The primary substrate for glycolysis. Its injection during the glycolytic stress test reveals the cells' glycolytic response. | 250 mM solution in glycolysis stress test medium, prepared fresh [6]. |
| 2-Deoxy-D-Glucose (2-DG) | A non-metabolizable glucose analog that inhibits glycolysis. Used to confirm the glycolytic origin of acidification. | 500 mM solution in glycolysis stress test medium, prepared fresh [6]. |
Advanced Applications and Model Systems
The versatility of the Seahorse XF analyzer has led to its adoption in a wide range of research areas and biological models, moving far beyond conventional cancer cell line studies.
- Immunology: The metabolic profiles of immune cells are tightly linked to their activation status. Activated T lymphocytes shift to a highly glycolytic state, while activated B cells use a balance of glycolysis and oxidative phosphorylation. Optimized protocols exist for working with fragile primary lymphocytes, even at low cell densities [6].
- Neuroscience: XF analysis is used to study metabolic fluxes in primary neurons and to investigate the role of energy sensors like AMP-activated protein kinase (AMPK) in neurodegenerative diseases [7].
- Three-Dimensional Models: To better recapitulate tumor physiology, optimized workflows have been developed for analyzing the metabolic fluxes of cancer spheroids, allowing for high-resolution characterization and comparison with monolayer cultures [8].
- In Vivo Models: The assay has been adapted for use with complex models like Caenorhabditis elegans, tissues, and isolated mitochondria, providing insights into metabolism in a more physiologically relevant context [4] [1].
Integration with Fluorescent Imaging
A significant advancement in metabolic flux technology is its integration with high-content fluorescence imaging. This combined platform allows researchers to capture bioenergetic and functional data in a single, multifunctional assay [2]. After completing the Seahorse metabolic flux assay, fluorescent dyes can be introduced to measure additional parameters:
- Cell Number Normalization: Hoechst dye stains nuclei, allowing for accurate cell counting to normalize OCR and ECAR data, which is critical for data reliability [2].
- Mitochondrial Content and Morphology: MitoTracker dyes label mitochondria, enabling quantification of mitochondrial mass and analysis of their network structure (e.g., fused vs. fragmented) [2].
- Mitochondrial Membrane Potential (Δψm): TMRE dye accumulation is dependent on the proton gradient, providing a readout of mitochondrial membrane health and function [2].
- Mitochondrial Reactive Oxygen Species (mtROS): MitoSOX Red is a fluorogenic dye specifically targeted to mitochondria that is oxidized by superoxide, allowing for quantification of mitochondrial oxidative stress [2].
This integrated approach generates a richer, more controlled dataset from a single experiment, linking real-time metabolic rates with crucial aspects of mitochondrial biology and cell state [2].
Extracellular flux analysis with the Seahorse XF platform has fundamentally changed how researchers investigate cellular metabolism. Its ability to provide real-time, simultaneous, and non-invasive measurements of the two major energy-producing pathways—mitochondrial respiration and glycolysis—makes it an indispensable tool in modern bioenergetics research. The continued expansion of its applications, from primary immune cells to complex 3D models, and its integration with other modalities like high-content imaging, ensures its role as a cornerstone technology. As our understanding of metabolic dysregulation in disease deepens, the principles and protocols outlined in this document will empower researchers to design robust experiments, generate high-quality data, and contribute to the discovery of novel metabolic therapeutics.
The Agilent Seahorse XF Analyzer represents a pivotal technological advancement in the field of real-time cellular metabolic analysis. This platform enables researchers to move beyond static cellular characterization and gain dynamic, functional insights into cellular bioenergetics. By measuring the two major energy-producing pathways—mitochondrial respiration and glycolysis—in live cells in real time, Seahorse technology provides a clear window into the critical functions driving cell signaling, proliferation, activation, toxicity, and biosynthesis [9]. With over 20,000 genes, 200,000 proteins, and thousands of pathways in a cell, researchers cannot measure everything at once, but they can measure the energy that drives them, making metabolic flux analysis a fundamental tool for understanding cellular function and dysfunction [9].
The core principle of Seahorse technology centers on the simultaneous measurement of the oxygen consumption rate (OCR) as an indicator of mitochondrial respiration and the extracellular acidification rate (ECAR) or proton efflux rate (PER) as an indicator of glycolytic activity [10] [11]. These parameters serve as vital indicators of mitochondrial health, toxicity, glycolysis, and overall cellular function or dysfunction [10]. The ability to monitor these metabolic fluxes in real-time has transformed research in areas ranging from cancer biology to immunology, particularly for investigating metabolic reprogramming in cancer cells [12] and metabolic remodeling during T-cell activation [13].
Seahorse XF Instrument Platforms
Agilent offers several Seahorse XF analyzer models, each designed to address specific research needs and sample types while maintaining the core technological principles. These platforms share common capabilities but differ in their throughput, well format, and specialized applications.
Table 1: Comparison of Seahorse XF Analyzer Platforms
| Analyzer Model | Well Format | Key Features | Primary Applications |
|---|---|---|---|
| Seahorse XF Pro [9] | 96-well | Enhanced precision, pharma-oriented workflows; won 2023 Scientists' Choice Award | High-throughput drug discovery & development, ensuring drug safety |
| Seahorse XF Flex [10] | 24-well | Wide signal dynamic range, dedicated consumables for 3D models | Organoids, tissue materials, 3D study models |
| Seahorse XFe96 [11] [14] | 96-well | Highest capacity at lowest per-sample cost, validated for hypoxia | Maximizing design flexibility and sample throughput |
| Seahorse XFe24 [11] | 24-well | Larger well format, validated for hypoxia | Islets, spheroids, and other specialty sample types |
| Seahorse XF HS Mini [11] | 8-well | Quick and easy setup, minimal sample requirement | Routine energy metabolism measurements of ex-vivo and quantity-limited samples |
The Seahorse XF Pro analyzer is an enhanced metabolic assay platform featuring improved precision and software capabilities, specifically designed to empower scientists in developing next-generation therapeutics and ensuring drug safety [9]. For researchers working with more complex three-dimensional structures, the Seahorse XF Flex analyzer offers optimized workflows and dedicated consumables that enable real-time metabolic analysis of 3D models such as organoids and tissue materials, providing deeper insights and enhancing the translatability of research findings [10]. The Seahorse XFe96 analyzer provides the highest capacity for XF assays at the lowest per-sample cost, making it ideal for laboratories seeking to maximize experimental design flexibility and sample throughput [11]. In contrast, the Seahorse XF HS Mini analyzer is ideal for performing routine energy metabolism measurements on ex-vivo and other quantity-limited samples with its streamlined, eight-well miniplate format [11].
Transient Microchamber Technology: The Core Principle
The revolutionary aspect of Seahorse XF technology lies in its patented transient microchamber system, which enables sensitive, precise, and non-destructive measurements of cell metabolism [11] [14]. This innovative approach allows for real-time metabolic flux analysis without the need for dyes, labels, or reporters, maintaining normal cell physiology throughout the assay [14].
Biosensor Cartridge and Measurement Mechanism
The disposable assay kit consists of two key components: a cell culture microplate and a disposable biosensor cartridge [14]. Embedded in a polymer at the bottom of each cartridge sleeve are two fluorophores that function as biosensors. One fluorophore is quenched by oxygen, enabling measurement of mitochondrial respiration, while the other is sensitive to protons (H⁺), indicating glycolytic activity [14]. During a measurement cycle, fiber optic bundles are lowered to precisely 200 µm above the cell layer, creating a transient, miniaturized environment [14]. This action forms the critical transient microchamber of approximately 200 microns [12] that temporarily isolates a small volume of media directly above the cells, allowing for highly sensitive detection of changes in oxygen and proton concentrations caused by cellular metabolic activity.
Real-Time Measurement Cycle
The measurement process is cyclic and kinetic, providing multiple data points throughout the assay duration. The sensors measure changes in dissolved oxygen and free proton concentrations resulting from cellular oxygen consumption (respiration) and proton excretion (glycolysis) over a period of 2-5 minutes [12]. Once the sensors detect approximately a 10% change in oxygen or a similar change in proton levels, the probes retract, allowing the cellular environment to re-equilibrate to normal levels [14]. This process can be repeated multiple times—typically every 5-8 minutes over 60-90 minutes—to generate kinetic data on metabolic function [12]. The system allows for automatic injection of up to four test compounds (drugs, substrates, or inhibitors) during the assay course, enabling researchers to monitor metabolic responses to perturbations in real-time [11] [14].
Key Metabolic Parameters and Calculations
Seahorse XF Analyzers provide comprehensive metrics for understanding cellular energy metabolism. The core parameters directly measured are the Oxygen Consumption Rate (OCR) and Extracellular Acidification Rate (ECAR) or Proton Efflux Rate (PER), from which more detailed metabolic insights are derived [10] [12].
ATP Rate Assay Calculations
The Seahorse XF Real-Time ATP Rate Assay enables researchers to quantify the relative contributions of mitochondrial oxidative phosphorylation and glycolytic metabolism to total cellular ATP production [12]. This is achieved through a series of sequential compound injections and specific calculations:
The glycolytic ATP production rate is calculated based on the glycolytic proton efflux rate (glycoPER) using the equation: glycoATP Production Rate (pmol/min) = glycoPER (pmol H⁺/min) [12]
The mitochondrial ATP production rate is derived from the oxygen consumption rate associated with ATP synthesis, which is determined as the OCR inhibited by oligomycin (an ATP synthase inhibitor): OCRₐₜₚ (pmol O₂/min) = OCR (pmol O₂/min) - OCRₒₗᵢ𝑔ₒ (pmol O₂/min) [12]
This value is then converted to the mitochondrial ATP production rate using the equation: mitoATP Production Rate (pmol/min) = OCRₐₜₚ (pmol O₂/min) × 2 (pmol O/pmol O₂) × P/O ratio (pmol ATP/pmol O) [12]
where the P/O ratio represents the number of ATP molecules generated per oxygen atom reduced, reflecting the efficiency of oxidative phosphorylation.
The total cellular ATP production rate is then calculated as the sum of both pathways: ATP Production Rate (pmol/min) = glycoATP Production Rate + mitoATP Production Rate [12]
Detailed Experimental Protocols
The following protocols provide detailed methodologies for profiling metabolic fluxes in different cellular models, adapted from current research practices [12].
ATP Rate Assay for Suspension Cells
This protocol has been optimized for examining metabolism in primary or immortalized suspension cancer cells, such as hematopoietic cells [12].
Required Materials:
- Cultured or freshly isolated suspension cells
- Seahorse XF Pro Analyzer and Seahorse XFe96/XF Pro PDL FluxPak
- Seahorse XF RPMI or DMEM medium
- Seahorse XF 1.0 M glucose, 100 mM pyruvate, 200 mM glutamine solutions
- Seahorse XF Real-Time ATP Rate Assay Kit
- 37°C non-CO₂ incubator and CO₂ incubator
- Centrifuge with microplate rotor
- Cell counting equipment [12]
Day Prior to XF Assay:
- Hydrate the sensor cartridge using Seahorse XF Calibrant Solution and incubate overnight at 37°C in a non-CO₂ incubator.
- Culture suspension cells under standard conditions appropriate for the cell type.
- Prepare Seahorse XF assay medium by supplementing base medium with glucose, glutamine, and pyruvate according to manufacturer recommendations. [12]
Day of XF Assay:
- Cell Preparation and Seeding:
- Harvest cells and centrifuge at appropriate speed.
- Resuspend cell pellet in pre-warmed Seahorse XF assay medium.
- Count cells using standard methods (e.g., hemocytometer or automated counter).
- Seed cells into poly-D-lysine coated XF microplates at optimized density (typically 100,000 - 500,000 cells per well for suspension cells).
- Centrifuge the microplate to ensure cell attachment (300-500 × g for 1-5 minutes with minimal braking).
- Incubate seeded plate for 15-45 minutes in 37°C CO₂ incubator to allow for complete attachment.
Sensor Cartridge Loading:
- Prepare drug injection ports in hydrated sensor cartridge:
- Port A: 1.5 µM oligomycin
- Port B: 0.5 µM rotenone/antimycin A
- Carefully load compounds avoiding introduction of air bubbles.
- Prepare drug injection ports in hydrated sensor cartridge:
Calibration and Assay Run:
- Place loaded sensor cartridge into XF Analyzer for calibration.
- Replace calibration plate with cell culture microplate.
- Initiate ATP Rate Assay protocol with predefined measurement cycles. [12]
ATP Rate Assay for Adherent Cells
The protocol for adherent cells shares similarities with the suspension cell protocol but requires modifications in the plating procedure.
Key Modifications for Adherent Cells:
- Cells are typically seeded 18-24 hours prior to the assay to ensure proper attachment and recovery.
- No centrifugation or poly-D-lysine coating is typically required for well-attaching adherent lines.
- Cell seeding densities are optimized based on proliferation rates and experimental goals (typically 4,000-100,000 cells per well).
- On assay day, growth medium is replaced with Seahorse XF assay medium and cells are incubated for 45-60 minutes in a 37°C non-CO₂ incubator prior to assay initiation. [12]
Table 2: Research Reagent Solutions for Seahorse XF ATP Rate Assay
| Reagent/Kit | Catalog Number | Function | Application Notes |
|---|---|---|---|
| Seahorse XF Real-Time ATP Rate Assay Kit | #103592-100 [12] | Provides inhibitors for quantifying ATP production from glycolysis and OXPHOS | Contains oligomycin (Complex V inhibitor) and rotenone/antimycin A (Complex I/III inhibitors) |
| Seahorse XFe96/XF Pro PDL FluxPak | #103798-100 [12] | Includes PDL cell culture microplates, sensor cartridges, and calibrant | Essential consumable pack for each experiment; PDL coating crucial for suspension cells |
| Seahorse XF RPMI Medium | #103576-100 [12] | Assay-specific medium formulation | Optimized for minimal background signal interference |
| Seahorse XF DMEM Medium | #103575-100 [12] | Assay-specific medium formulation | Alternative base medium option |
| Seahorse XF 1.0 M Glucose | #103577-100 [12] | Metabolic substrate supplement | Added to assay medium to ensure substrate availability |
| Seahorse XF 100 mM Pyruvate | #103578-100 [12] | Mitochondrial substrate supplement | Supports mitochondrial function during assay |
| Seahorse XF 200 mM Glutamine | #103579-100 [12] | Metabolic substrate supplement | Essential for both mitochondrial and glycolytic metabolism |
Applications in Cellular Energetics Research
Seahorse XF technology has enabled significant advances in understanding cellular metabolism across diverse research fields. In cancer biology, the platform has been instrumental in characterizing the Warburg effect and other metabolic alterations in tumor cells, with recent research revealing distinct metabolic profiles between suspension and adherent cancer cells [12]. The technology has proven particularly valuable for identifying metabolic switches that confer malignant characteristics such as metastasis and for investigating metabolic heterogeneity within tumors, including cancer stem cell subpopulations [12].
In immunology, Seahorse XF analysis has become a powerful method for measuring fundamental metabolic pathway changes during immune cell activation [13]. Studies of T lymphocytes have revealed that upon activation, T cells undergo a profound reconfiguration of their metabolic profile, transitioning from a quiescent state to a metabolically active state characterized by increases in both aerobic glycolysis and mitochondrial respiration [13]. This metabolic remodeling is essential for supporting the biosynthetic demands of proliferation and effector function.
The technology's application extends to primary cells, established cell lines, spheroids, isolated mitochondria, and small tissue pieces, requiring only a small number of cells (4,000-500,000 per well) and enabling researchers to perform experiments with living cells in multi-well plates without dyes or labels [14]. The non-destructive nature of the measurements allows for subsequent additional assays on the same cells, maximizing the informational yield from precious samples [14].
Advantages and Practical Considerations
Seahorse XF technology offers several distinct advantages that have contributed to its widespread adoption in research and drug development. The platform simultaneously measures the two major metabolic pathways in real-time using living cells, providing a more physiologically relevant assessment compared to endpoint assays [14]. The technology accommodates a broad range of biological samples—from primary cells to 3D models—with minimal cell requirements, making it applicable for studying rare or precious samples [11] [14]. The non-invasive nature of the measurements preserves cellular integrity for subsequent analyses, while the ability to test up to four compounds during a single assay provides valuable flexibility for experimental design [11] [14].
For researchers implementing Seahorse technology, several practical considerations are essential for success. Proper experimental planning is crucial, including mandatory training sessions that typically include an initial consultation and instrument familiarization [14]. Careful selection of cell seeding densities and optimization of assay conditions are required for different cell types, particularly when working with suspension cells that require additional attachment steps [12] [14]. Researchers should also factor in associated costs, including training fees, per-experiment run costs, and consumables such as FluxPaks, which contain the essential sensor cartridges, cell culture microplates, and calibration materials [14].
The integration of advanced software solutions, such as Agilent Seahorse Analytics, has greatly simplified the entire XF assay experience from assay design to data QC and interpretation [10]. These analytical tools enable researchers to extract maximum insight from their metabolic flux data and facilitate comparison across experimental conditions. As the field of cellular metabolism continues to evolve, Seahorse XF technology remains at the forefront, enabling discoveries that advance our understanding of fundamental biological processes and their dysregulation in disease.
Cellular metabolism, encompassing the intricate network of biochemical processes that generate energy and biosynthetic precursors, forms the cornerstone of life-sustaining functions [1]. Within this network, mitochondrial respiration is a critical pathway for adenosine triphosphate (ATP) production, and its detailed assessment is pivotal for understanding cell physiology, disease pathology, and drug effects [1] [15]. The Agilent Seahorse Extracellular Flux (XF) Analyzer has emerged as a industry-standard technology that enables the real-time, simultaneous measurement of two key metabolic rates in live cells: the Oxygen Consumption Rate (OCR), indicative of mitochondrial respiration, and the Extracellular Acidification Rate (ECAR), largely reflective of glycolytic activity [1] [16]. By directly measuring the OCR, the Seahorse XF Cell Mito Stress Test provides a comprehensive method to assess fundamental parameters of mitochondrial function [15]. This application note details the principles, protocols, and significance of four key parameters derived from the Mito Stress Test—Basal Respiration, ATP-linked Respiration, Proton Leak, and Spare Respiratory Capacity—framed within the context of Seahorse metabolic flux analysis for cellular energetics research.
Principles of the Seahorse XF Mito Stress Test
The Mito Stress Test employs a series of compounds that specifically target components of the electron transport chain (ETC) to reveal key parameters of metabolic function [15]. The assay sequentially injects modulators to dissect different components of mitochondrial respiration, providing a dynamic profile of mitochondrial function in live cells [17].
The Electron Transport Chain and Inhibitor Targets
The following diagram illustrates the mitochondrial electron transport chain and the specific sites targeted by the pharmacological inhibitors used in the Mito Stress Test.
Pharmacological Modulators in the Mito Stress Test
Table 1: Key Compounds Used in the Seahorse XF Mito Stress Test and Their Mechanisms of Action
| Compound | Target | Mechanism | Effect on OCR |
|---|---|---|---|
| Oligomycin | Complex V (ATP synthase) | Inhibits ATP synthesis by blocking the proton channel [1]. | Decrease: Reveals ATP-linked respiration [1] [15]. |
| FCCP | Inner mitochondrial membrane | Uncouples respiration by dissipating the proton gradient, allowing electrons to flow through the ETC without ATP production [1] [18]. | Increase: Drives maximum OCR [1] [15]. |
| Rotenone & Antimycin A | Complex I & III | Inhibit electron transfer, shutting down the ETC [1] [15]. | Decrease: Reveals non-mitochondrial respiration [1]. |
Analysis of Key Metabolic Parameters
The sequential injection of the modulators described above generates a characteristic kinetic profile of the Oxygen Consumption Rate (OCR). From this profile, the fundamental parameters of mitochondrial function are calculated.
The Metabolic Profile and Parameter Calculation
The typical OCR trace from a Mito Stress Test is shown below, illustrating the kinetic response to drug injections and how key parameters are derived.
Definition and Biological Significance of Key Parameters
Table 2: Key Metabolic Parameters Measured by the Seahorse XF Mito Stress Test
| Parameter | Definition | Biological Interpretation |
|---|---|---|
| Basal Respiration | The OCR consumed by cells under baseline, non-stimulated conditions [17] [15]. | Reflects the energy demand required to maintain essential cellular functions and ion gradients under normal conditions [1]. |
| ATP-linked Respiration | The portion of basal respiration used to drive ATP production by ATP synthase (calculated as the drop in OCR after oligomycin injection) [1] [15]. | Represents the mitochondrial contribution to cellular ATP production. A decrease can indicate impaired ATP synthesis or a shift to glycolytic metabolism [1]. |
| Proton Leak | The portion of basal respiration not coupled to ATP synthesis (calculated as the OCR remaining after oligomycin, minus non-mitochondrial respiration) [1] [15]. | Can be a sign of mitochondrial damage or inefficiency, but also plays a role in regulating ATP production and mitigating reactive oxygen species (ROS) [1] [17]. |
| Spare Respiratory Capacity | The difference between maximal respiration (post-FCCP) and basal respiration [18] [17] [15]. | A metric of the cell's ability to respond to increased energy demand (e.g., stress, proliferation). Low spare capacity indicates limited bioenergetic flexibility and heightened susceptibility to stress [17]. |
| Maximal Respiration | The maximum OCR achievable by the cell, measured after FCCP-induced uncoupling [1] [17] [15]. | Reflects the maximal functional capacity of the electron transport chain. |
| Non-Mitochondrial Respiration | The OCR remaining after inhibition of complexes I and III by rotenone and antimycin A [1]. | Represents oxygen consumption by non-mitochondrial processes, serving as a background measurement. |
Detailed Experimental Protocol
This section provides a standardized workflow for performing the Seahorse XF Mito Stress Test, from assay preparation to data analysis.
Workflow for the Seahorse XF Mito Stress Test
The following diagram outlines the key steps involved in a typical Mito Stress Test experiment, spanning from the day before the assay to data analysis.
Step-by-Step Protocol
Day Before the Assay
- Sensor Cartridge Hydration: Pipette 1.0 mL of XF Calibrant solution (pH 7.4) into each well of the utility plate. Assemble the cartridge hydration system by placing the hydro-booster, sensor cartridge, and lid onto the utility plate. Hydrate the sensor cartridge in a non-CO₂ incubator at 37 °C for a minimum of 4 hours, preferably overnight [18] [19].
- Cell Seeding and Culture: Seed cells into a Seahorse XF cell culture microplate at an optimized density. The optimal cell number is cell line-dependent and must be determined empirically to ensure a monolayer without over-confluence [19]. Incubate the cell culture plate overnight at 37 °C in a CO₂ incubator under standard growth conditions.
Day of the Assay
- Prepare Assay Medium: On the day of the assay, prepare Seahorse XF Assay Medium. This is typically a bicarbonate-free medium (e.g., XF DMEM or XF RPMI) supplemented with glucose, glutamine, and pyruvate according to the specific experimental requirements [20].
- Replace Cell Culture Medium: Carefully remove the cell culture growth medium from the Seahorse cell culture plate. Gently wash the cells with the pre-warmed Seahorse XF Assay Medium. After washing, add the final volume of assay medium to the wells (e.g., 180 µL for a 96-well plate). Incubate the cell plate in a non-CO₂ incubator at 37 °C for 45-60 minutes to allow temperature and pH equilibration [19] [20].
- Load Compounds: Prepare the mitochondrial modulators in Seahorse XF Assay Medium at the desired working concentrations.
- Port A: Oligomycin (typically 1-2 µM final concentration)
- Port B: FCCP (typically 0.5-2 µM final concentration; must be optimized for each cell type) [19]
- Port C: Rotenone & Antimycin A (typically 0.5 µM each final concentration) Load the compounds into the respective ports of the hydrated sensor cartridge.
- Calibrate the Sensor Cartridge: Place the cell culture plate and the loaded sensor cartridge into the Seahorse XFe96 Analyzer. The instrument will automatically initiate the calibration process, which typically takes 15-30 minutes [19].
- Run the Mito Stress Test: After successful calibration, the assay protocol will begin. A standard protocol involves:
- Basal measurements: 3-4 measurement cycles (approx. 5-8 min each).
- Oligomycin injection: 3-4 measurement cycles.
- FCCP injection: 3-4 measurement cycles.
- Rotenone & Antimycin A injection: 3-4 measurement cycles. The total assay run time is typically 60-90 minutes [20].
Post-Assay Analysis
- Normalization: After the assay, normalize the OCR data to account for well-to-well variability in cell number. Common normalization methods include:
- Data Analysis: Use the Seahorse XF Report Generator to automatically calculate the key parameters of mitochondrial function (Basal Respiration, ATP-linked Respiration, Proton Leak, Maximal Respiration, Spare Respiratory Capacity) from the kinetic OCR data [15]. Results can be exported for further statistical analysis and graphing.
The Scientist's Toolkit: Essential Reagents and Materials
Table 3: Key Research Reagent Solutions for the Seahorse XF Mito Stress Test
| Item | Function / Application |
|---|---|
| Seahorse XF Cell Mito Stress Test Kit | Provides quality-controlled, pre-measured reagents (Oligomycin, FCCP, Rotenone/Antimycin A) and a standard method for conducting the assay [19] [15]. |
| Seahorse XF FluxPak | Includes sensor cartridges, cell culture microplates, and XF Calibrant solution, which are essential for running any XF assay [18] [20]. |
| Seahorse XF Assay Media (e.g., XF DMEM, XF RPMI) | Bicarbonate-free media designed for use in the Seahorse analyzer to maintain a stable pH during measurements without CO₂ buffering [20]. |
| Substrate Supplements (Glucose, Glutamine, Pyruvate) | Added to the assay medium to provide fundamental fuels for mitochondrial respiration and glycolysis [20]. |
| Cell Recovery Reagents (Trypsin, Trypan Blue) | Used for post-assay cell detachment and counting for data normalization [20]. |
| Protein Assay Kit (e.g., BCA Assay) | An alternative normalization method for determining the total protein content per well after the assay is complete [18] [20]. |
Advanced Applications and Integrated Workflows
The core Mito Stress Test can be integrated with other technologies to gain deeper insights into mitochondrial biology. For instance, coupling the assay with high-content fluorescence imaging allows for the simultaneous measurement of bioenergetics and other mitochondrial properties from the same sample of cells [16]. After completing the Mito Stress Test, fluorescent dyes can be introduced to measure parameters such as:
- Mitochondrial content (via MitoTracker dyes)
- Mitochondrial membrane potential (via TMRE)
- Mitochondrial reactive oxygen species (mtROS) (via MitoSOX)
- Cell number and cell cycle distribution (via Hoechst staining) [16]
This integrated approach provides a more complete picture of mitochondrial function and morphology, helping to elucidate the mechanisms underlying changes in respiratory parameters observed in response to genetic manipulations, drug treatments, or disease states [16].
The Seahorse XF Mito Stress Test is a powerful, standardized methodology for the comprehensive assessment of mitochondrial function in live cells. The key parameters of Basal Respiration, ATP-linked Respiration, Proton Leak, and Spare Respiratory Capacity provide invaluable insights into the bioenergetic health and flexibility of cells. When performed according to the detailed protocols outlined herein, this assay delivers robust, quantitative data that can inform studies in fundamental cell biology, disease mechanisms, and drug discovery, particularly in the identification of compounds with potential mitochondrial toxicity [17]. The integration of this technology with other methodologies, such as high-content imaging, further enhances its utility, enabling researchers to build a multi-dimensional understanding of cellular metabolism.
Cellular bioenergetics, the study of energy flow through living systems, is fundamental to understanding cell physiology, signaling, proliferation, and toxicity [21]. Mitochondria serve as the primary bioenergetic factories within cells, generating adenosine triphosphate (ATP) through oxidative phosphorylation while also functioning as biosynthetic centers and regulators of apoptosis [22] [23]. The electron transport chain (ETC), located in the inner mitochondrial membrane, represents the core engine of mitochondrial function, comprising four multi-protein complexes (I-IV) that work in concert to create a proton gradient that drives ATP synthesis [24] [22]. The ETC facilitates the transfer of electrons from donors like NADH and FADH₂ to final acceptance by molecular oxygen, while pumping protons across the mitochondrial membrane to establish the electrochemical gradient that powers ATP synthase (Complex V) [24].
Dysfunctional mitochondria contribute to the pathogenesis of numerous diseases affecting high-energy organs including the brain, heart, and muscles, through alterations in mitochondrial enzymes, increased oxidative stress, impairment of ETC function, or mutations in mitochondrial DNA [23]. The growing recognition of mitochondrial dysfunction in human disease has driven increased research interest, with one in every 154 biomedical papers indexed in PubMed since 1998 being retrieved by the keyword "mitochondria" [22]. Against this backdrop, mitochondrial poisons have emerged as indispensable tools for dissecting ETC function and interrogating cellular bioenergetics in both physiological and pathological contexts [24] [25].
Mitochondrial Poisons as Mechanistic Probes
Classification and Mechanisms of Action
Mitochondrial poisons are chemical compounds that selectively target and disrupt specific components of mitochondrial bioenergetic systems. These agents are categorized based on their precise molecular targets and mechanisms of action within the ETC and oxidative phosphorylation apparatus [24].
Table 1: Classification of Selected Mitochondrial Poisons
| Category | Specific Agents | Primary Target | Mechanism of Action | Effect on Respiration |
|---|---|---|---|---|
| Complex I Inhibitors | Rotenone | Complex I (NADH:ubiquinone oxidoreductase) | Blocks electron transfer from Fe-S centers to ubiquinone | Inhibits NADH-linked respiration [24] [25] |
| Complex II Inhibitors | TTFA (thenoyltrifluoroacetone) | Complex II (succinate dehydrogenase) | Competitive inhibition at succinate binding site | Inhibits succinate-supported respiration [24] [25] |
| Complex III Inhibitors | Antimycin A | Complex III (bc₁ complex) | Binds to Qi site, blocking electron transfer from heme bH to ubiquinone | Halts electron flow through complex III [24] |
| Complex IV Inhibitors | Cyanide | Complex IV (cytochrome c oxidase) | Binds to heme a₃, preventing oxygen reduction | Completely inhibits oxygen consumption (>98% at 1 mM) [24] |
| ATP Synase Inhibitors | Oligomycin | Complex V (ATP synthase) | Blocks proton channel (F₀ subunit) | Inhibits ATP synthesis; prevents State III respiration [24] |
| Uncouplers | FCCP, 2,4-Dinitrophenol (DNP) | Inner membrane | Dissipates proton gradient by acting as proton ionophores | Maximizes electron flow and oxygen consumption without ATP production [24] |
| Substrate-Level Inhibitors | Malonate | Complex II | Competitive inhibitor of succinate dehydrogenase | Inhibits succinate-driven respiration [24] |
Research Applications in Disease Modeling
Mitochondrial poisons enable researchers to model disease-associated mitochondrial dysfunction and investigate subsequent cellular consequences. Inhibitors of complexes I and II, such as rotenone and TTFA, have been demonstrated to induce autophagic cell death mediated by reactive oxygen species (ROS) in transformed and cancer cell lines (HEK 293, U87, HeLa) [25]. This cell death mechanism depends on ROS generation, as treatment with the ROS scavenger tiron or overexpression of manganese-superoxide dismutase (SOD2) significantly reduces autophagy and cell death following poison application [25]. Notably, this response appears selective to transformed cells, as treatment of non-transformed primary mouse astrocytes with the same inhibitors did not significantly increase ROS or autophagy [25]. These findings highlight the potential for targeting mitochondrial function as a therapeutic strategy in cancer while underscoring the importance of mitochondrial poisons as tools for investigating selective vulnerability.
Seahorse Metabolic Flux Analysis: Principles and Applications
The Agilent Seahorse Extracellular Flux (XF) Analyzer has emerged as a standard technology for real-time assessment of cellular bioenergetics, enabling simultaneous kinetic measurements of mitochondrial respiration and glycolysis in living cells [26] [16]. This platform measures the Oxygen Consumption Rate (OCR, a surrogate for mitochondrial respiration) and Extracellular Acidification Rate (ECAR, primarily indicative of glycolytic flux) in multi-well plate formats [21] [16]. The simplicity, convenience, robustness, and sensitivity of the metabolic flux assay has made it a technology of choice for many laboratories investigating cellular metabolism [16]. The Seahorse XF Pro analyzer was recognized with the 2023 Scientists' Choice Award as the best new drug discovery & development product of 2022, highlighting its importance in pharmaceutical research [21].
The power of metabolic flux analysis lies in its ability to provide functional assessment of bioenergetic pathways under baseline and stressed conditions. As stated in the search results, "With over 20,000 genes, 200,000 proteins and thousands of pathways, you can't measure everything in a cell at once, but you can measure the energy that drives them" [21]. This approach moves beyond analyzing what cells are to reveal a clearer measure of what they do, providing critical insights into the functions driving cell signaling, proliferation, activation, toxicity, and biosynthesis [21].
Integrated Multiparameter Assessment
Recent methodological advances have enhanced the utility of metabolic flux technology by coupling it with high-content fluorescence imaging [16]. This integrated approach enables simultaneous normalization of respiration data to cell number while quantifying multiple mitochondrial parameters including content, fragmentation state, membrane potential, and mitochondrial reactive oxygen species (mtROS) [16]. The incorporation of fluorescent dyes such as Hoechst (nuclear staining), MitoTracker Red (mitochondrial content and morphology), TMRE (membrane potential), and MitoSOX (mitochondrial superoxide) directly into the metabolic flux assay generates a more complete dataset of mitochondrial features from a single experiment [16].
This multi-modal platform addresses a critical challenge in mitochondrial research: the dynamic nature of mitochondrial biochemistry, morphology, and physiology. As mitochondria rapidly undergo changes in these parameters, capturing bioenergetic and functional data in a single integrated assay yields greater, more controlled, and more precise mitochondrial information than sequential independent measurements [16]. The integration of nuclei staining is particularly valuable for normalization, as studies have demonstrated that nuclei counting coupled with automated analysis outperforms other normalization methods [16].
Experimental Protocols: Applying Mitochondrial Poisons in Metabolic Flux Analysis
Seahorse XF Mito Stress Test Assay
The Mito Stress Test represents the fundamental protocol for assessing mitochondrial function through sequential injection of specific poisons that target distinct ETC components. This assay provides key parameters of mitochondrial function including basal respiration, ATP-linked respiration, proton leak, maximal respiratory capacity, and spare respiratory capacity [16].
Protocol Workflow:
Cell Preparation: Plate cells in appropriate growth medium in XF assay plates 18-24 hours before assay. Optimal cell densities vary by cell type (typically 3,000-50,000 cells/well for adherent cells in XF96 plates) [16]. Include edge wells with PBS only to minimize edge effects.
Assay Medium Preparation: On day of assay, replace growth medium with XF assay medium (unbuffered DMEM, pH 7.4) supplemented with 1 mM pyruvate, 2 mM glutamine, and 10 mM glucose. Incubate cells for 45-60 minutes in a non-CO₂ incubator at 37°C.
Baseline Measurements: Perform 3-5 baseline measurements of OCR and ECAR to establish basal metabolic rates.
Sequential Inhibitor Injections:
- Port A: Oligomycin (1-2 µM final concentration) to inhibit ATP synthase and measure ATP-linked respiration and proton leak.
- Port B: FCCP (0.5-2 µM final concentration, must be optimized for cell type) to uncouple mitochondria and measure maximal respiratory capacity.
- Port C: Rotenone/Antimycin A (0.5 µM each) to completely shut down mitochondrial respiration by inhibiting complexes I and III.
Data Normalization and Analysis: Following assay completion, normalize data to cell number using protein quantification, DNA content, or preferably, nuclei counting via fluorescent staining [16].
Diagram 1: Seahorse XF Mito Stress Test Workflow. This standardized protocol sequentially injects mitochondrial poisons to dissect specific bioenergetic parameters.
Integrated Fluorescence Imaging Protocol
The combination of metabolic flux analysis with high-content imaging provides a comprehensive assessment of mitochondrial function and properties [16].
Protocol Workflow:
Metabolic Flux Assay Completion: Perform standard Seahorse XF Mito Stress Test as described above.
Fluorescent Staining: Following the final measurement, inject fluorescent dyes via Port D:
- Hoechst 33342 (5-10 µg/mL) for nuclear staining and cell counting
- MitoTracker Red CMXRos (50-100 nM) for mitochondrial content and morphology
- TMRE (50-200 nM) for mitochondrial membrane potential
- MitoSOX Red (2-5 µM) for mitochondrial superoxide detection
Incubation and Washing: Incubate cells with dyes for 20-30 minutes at 37°C. Wash gently with warm PBS if necessary to reduce background fluorescence.
Image Acquisition: Acquire images using a high-content imaging system (e.g., Cytation5) with appropriate filter sets:
- Hoechst: Ex 350 nm, Em 461 nm
- MitoTracker Red/TMRE: Ex 579 nm, Em 599 nm
- MitoSOX: Ex 510 nm, Em 580 nm
Image Analysis:
- Segment nuclei using Hoechst signal for automated cell counting
- Quantify mitochondrial content using MitoTracker Red intensity
- Analyze mitochondrial morphology (fragmentation vs. networking)
- Measure TMRE intensity as indicator of membrane potential
- Quantify MitoSOX fluorescence as measure of mitochondrial superoxide
Data Integration: Normalize OCR and ECAR values to cell number and correlate with mitochondrial parameters.
Optimization and Troubleshooting
Several critical factors require optimization for robust Seahorse assays:
Cell Number Titration: Conduct preliminary experiments with serial dilutions to determine optimal seeding density that maintains linear response while avoiding over-confluence [16].
Inhibitor Concentration Optimization: Particularly for FCCP, titrate concentrations to identify dose that provides maximal uncoupling without inducing toxicity.
Edge Effect Mitigation: Use interior wells for experimental conditions as cells in perimeter wells may distribute unevenly, artifactually lowering OCR measurements [16].
Normalization Strategy Validation: Compare normalization methods (protein, DNA, nuclei count) for your specific cell type to ensure accurate data interpretation [16].
Data Analysis and Interpretation
Key Bioenergetic Parameters
Metabolic flux data, particularly when combined with mitochondrial poisons, yields quantitative parameters that define cellular bioenergetic phenotypes.
Table 2: Key Bioenergetic Parameters Derived from Mitochondrial Poison Studies
| Parameter | Definition | Calculation Method | Biological Interpretation |
|---|---|---|---|
| Basal Respiration | OCR under baseline nutrient conditions | Average of baseline measurements before injections | Total mitochondrial respiration meeting cellular energy demands |
| ATP-Linked Respiration | OCR dedicated to mitochondrial ATP production | Difference between basal OCR and OCR after oligomycin | Fraction of respiration coupled to ATP synthesis |
| Proton Leak | OCR not coupled to ATP synthesis | OCR remaining after oligomycin | Mitochondrial uncoupling and membrane inefficiency |
| Maximal Respiration | Maximum OCR capacity under stress | OCR after FCCP injection | Maximum electron transport chain capacity |
| Spare Respiratory Capacity | Reserve capacity above basal needs | Difference between maximal and basal respiration | Ability to respond to increased energy demands; indicator of bioenergetic health |
| Non-Mitochondrial Respiration | OCR resistant to ETC inhibition | OCR after rotenone/antimycin A | Non-mitochondrial oxygen consumption processes |
Advanced Applications: Cancer Bioenergetics
Mitochondrial poisons have revealed fundamental insights into cancer cell metabolism. The integrated fluorescence-metabolic flux platform has been applied to demonstrate how Rho-GTPases impact mitochondrial dynamics in breast cancer and how PGC1α and PRC1 inhibition alters mitochondrial function in pancreatic cancer [16]. These studies revealed previously unrecognized connections between signaling pathways regulating cancer progression and mitochondrial bioenergetics, highlighting the power of combined metabolic and functional assessment.
Table 3: Research Reagent Solutions for Mitochondrial Bioenergetics Studies
| Category | Specific Reagents | Function/Application | Considerations |
|---|---|---|---|
| ETC Inhibitors | Rotenone, Antimycin A, TTFA, Cyanide | Specific inhibition of electron transport chain complexes | Cyanide requires extreme caution due to high toxicity; concentration-dependent effects must be validated [24] |
| ATP Synthase Inhibitors | Oligomycin | Blocks oxidative phosphorylation | Effects manifest slowly; cannot interrupt established State III respiration immediately [24] |
| Uncouplers | FCCP, 2,4-Dinitrophenol (DNP) | Dissipates proton gradient, maximises electron flow | FCCP is a pure uncoupler; DNP has mixed actions and gradually inhibits electron transport at higher concentrations [24] |
| Fluorescent Probes | Hoechst, MitoTracker Red, TMRE, MitoSOX | Multiparameter imaging of mitochondrial features | TMRE and MitoTracker accumulation dependent on membrane potential; requires careful control of loading conditions [16] |
| Cell Line Models | Cancer lines (HeLa, U87, T3M4), Primary cells (astrocytes), Immune cells | Disease modeling, comparative bioenergetics | Transformed and primary cells may show differential responses to poisons [25] [16] |
| Instrumentation | Agilent Seahorse XF Analyzers, Cytation5 Imager | Metabolic flux measurement, high-content imaging | Proper plate preparation critical for data quality; edge effects must be controlled [21] [16] |
Diagram 2: Mitochondrial Poison Targets in the Electron Transport Chain. Specific inhibitors target discrete sites while uncouplers dissipate the proton gradient across the inner mitochondrial membrane.
Mitochondrial poisons serve as indispensable tools for interrogating cellular bioenergetics, enabling precise dissection of ETC function and oxidative phosphorylation. When combined with Seahorse metabolic flux technology and complementary imaging approaches, these compounds provide unprecedented insights into mitochondrial function in health and disease. The continued refinement of integrated assessment platforms promises to further advance our understanding of mitochondrial biology and accelerate the development of therapies targeting bioenergetic dysfunction in cancer, neurodegenerative disorders, metabolic diseases, and beyond. As mitochondrial research continues to expand—comprising approximately one in every 154 biomedical publications—the sophisticated application of mitochondrial poisons in structured experimental frameworks remains fundamental to progress in cellular bioenergetics.
In the field of cellular energetics research, the ability to accurately capture dynamic biological processes is paramount. Traditional endpoint metabolic assays, which provide a single snapshot in time after a series of incubations and wash steps, have long been the standard despite significant limitations. These methods risk missing critical transient interactions and kinetic changes that occur during cellular metabolic processes [27]. In contrast, real-time kinetic profiling technologies, particularly Seahorse metabolic flux analysis, have emerged as powerful tools that continuously monitor cellular bioenergetics as processes unfold [4] [26]. This Application Note explores the distinct advantages of real-time kinetic profiling over endpoint assessments, with a specific focus on Seahorse technology for evaluating cellular metabolism in research and drug development contexts. We provide detailed protocols and analytical frameworks to help researchers implement these approaches effectively, framed within the broader thesis that kinetic data provides biologically relevant insights that endpoint methods cannot capture.
Theoretical Advantages of Kinetic Profiling
Fundamental Limitations of Endpoint Assays
Endpoint metabolic assays suffer from inherent constraints that can compromise data integrity and biological relevance. These methods typically involve measuring metabolic parameters after fixed incubation periods, requiring multiple washing and processing steps that can disrupt the native state of cellular activity [27]. The most significant limitation is the risk of false-negative results for biomolecular interactions with fast kinetics, as transient interactions may form and dissociate rapidly before detection occurs [27]. Additionally, the single timepoint capture fails to represent the dynamic nature of metabolic processes, potentially missing critical transitions and flux changes that occur between timepoints. Endpoint methods also provide limited mechanistic insight, as they reveal little about the rates of metabolic processes or the kinetic parameters governing molecular interactions [27].
Comparative Advantages of Real-Time Kinetic Profiling
Real-time kinetic profiling addresses these limitations through continuous monitoring of metabolic processes as they naturally occur. Surface Plasmon Resonance (SPR) studies demonstrate that real-time detection reduces false-negative rates by capturing transient interactions that dissociate too rapidly for endpoint detection [27]. In metabolic flux analysis, technologies like the Seahorse XF Analyzer simultaneously measure oxygen consumption rate (OCR) and extracellular acidification rate (ECAR), providing continuous kinetic readouts of mitochondrial respiration and glycolytic activity [4] [26] [28]. This enables researchers to capture metabolic plasticity - the dynamic transitions cells undergo between oxidative phosphorylation and aerobic glycolysis in response to stimuli or environmental changes [29]. The kinetic data obtained allows for calculation of fundamental metabolic parameters including glycolytic capacity, mitochondrial ATP production, and respiratory reserve capacity that are inaccessible through endpoint methods [28].
Table 1: Quantitative Comparison of Endpoint vs. Real-Time Metabolic Assessment Methods
| Parameter | Traditional Endpoint Assays | Real-Time Kinetic Profiling |
|---|---|---|
| Temporal Resolution | Single timepoint | Continuous monitoring (seconds to minutes between measurements) |
| Detection of Transient Interactions | Prone to false negatives for fast-dissociating complexes [27] | Captures interactions with half-lives as short as seconds [27] |
| Data Output | Static snapshot | Kinetic parameters (rates, fluxes) |
| Sample Processing | Multiple wash steps required | Minimal processing, label-free options available |
| Metabolic Pathway Insight | Indirect inference | Direct flux measurement through pathways |
| Assay Duration | Typically 2-5 days for microbial viability [30] | Real-time with results often within hours [30] |
| Measurement Variability | 20-30% for plate counts [30] | Significantly reduced through continuous tracing |
Application Spaces with Demonstrated Superiority
Immunometabolism and PBMC Bioenergetics
Peripheral blood mononuclear cells (PBMCs) serve as accessible biomarkers for systemic bioenergetic health, but their metabolic assessment requires careful methodological consideration [28]. Real-time profiling of PBMCs using Seahorse XF technology has revealed that isolation methods and blood processing time significantly impact metabolic parameters, findings that were inconsistently detected with endpoint approaches [28]. For example, isolation of PBMCs using EasySep Direct versus SepMate yields differential metabolic profiles, while processing delays of 48-72 hours significantly diminish mitochondrial respiration, glycolytic activity, and ATP supply flux [28]. These factors critically affect the reliability of the Bioenergetic Health Index (BHI), a composite parameter derived from mitochondrial function that requires real-time assessment for accurate calculation [28]. The ability to continuously monitor PBMC activation responses to CD3/CD28 stimulation through kinetic profiling provides superior assessment of immunometabolic adaptations compared to endpoint cytokine measurements or proliferation assays [28].
Cellular Therapy Development
In CAR T-cell therapy development, real-time metabolic profiling has revealed critical transitions that determine therapeutic efficacy. Studies using hyperpolarized 13C NMR spectroscopy have demonstrated that CAR T-cells undergo a metabolic transition from oxidative phosphorylation to aerobic glycolysis by day 7 of expansion, followed by a return to oxidative phosphorylation by day 21 [29]. These dynamic shifts correlate with functional persistence and cytotoxicity, with kinetic profiling identifying that glucose depletion occurs predominantly during the first week of expansion [29]. Such temporal resolution enables optimization of expansion protocols to preserve metabolic characteristics associated with therapeutic efficacy, particularly the maintenance of oxidative phenotypes that correlate with enhanced persistence [29]. Endpoint metabolite measurements would miss these critical transitions and their timing, potentially leading to suboptimal manufacturing protocols.
Microbial Biotechnology and Probiotics
In probiotic research and live biotherapeutic products (LBPs), real-time kinetic assessment using isothermal microcalorimetry (IMC) has demonstrated advantages over traditional plate counting for viability assessment [30]. While plate counts require 2-5 days incubation and exhibit 20-30% variability, IMC provides continuous metabolic activity monitoring through heat flow measurements that serve as indicators of microbial viability [30]. This approach has proven particularly valuable for evaluating "viable but non-culturable" (VBNC) organisms that remain metabolically active despite not forming colonies on agar plates [30]. The method's insensitivity to media turbidity and cell clumping further enhances reliability compared to optical density measurements or endpoint viability stains [30].
Integrated Experimental Protocols
Protocol 1: Real-Time Metabolic Profiling of PBMCs Using Seahorse XF Technology
This optimized protocol enables simultaneous assessment of mitochondrial and glycolytic function in PBMCs, addressing key methodological variables identified through kinetic profiling studies [28].
Reagent Preparation
- XF Assay Medium: Seahorse XF RPMI pH 7.4, supplemented with 10 mM glucose, 2 mM L-glutamine, and 1 mM sodium pyruvate
- PBMC Isolation Reagents: EasySep Direct PBMC Isolation Kit or SepMate-15 tubes
- Cell Staining Solutions: Acridine orange and propidium iodide for viability counting
- Mitochondrial Modulators: Oligomycin (ATP synthase inhibitor), FCCP (mitochondrial uncoupler), Rotenone/Antimycin A (ETC inhibitors)
- Activation Reagents: CD3/CD28 beads for T-cell stimulation
Step-by-Step Workflow
Blood Collection and Processing
- Collect venous blood in K2EDTA vacutainer tubes to minimize inter-sample variation
- Process samples immediately (within 2 hours) for optimal metabolic preservation
- Isolate PBMCs using preferred method (EasySep Direct recommended for minimal processing time)
- Count viable cells using automated cell counter with acridine orange/propidium iodide staining
Plate Seeding and Preparation
- Seed PBMCs at optimized density (determined empirically for each cell type, typically 150,000-250,000 cells/well for PBMCs)
- Centrifuge plate at 200 × g for 2 minutes to promote cell attachment
- Incubate seeded plate for 15-30 minutes at 37°C without CO₂
- Replace medium with 180 μL XF Assay Medium
Seahorse XF Assay Configuration
- Load mitochondrial modulators into injection ports:
- Port A: Oligomycin (1.5 μM final concentration)
- Port B: FCCP (1.0 μM final concentration)
- Port C: Rotenone/Antimycin A (0.5 μM each)
- For activation studies, include CD3/CD28 in appropriate ports
- Run assay with measurement cycles of 3 minutes mixing, 2 minutes waiting, and 3-5 minutes measuring
- Load mitochondrial modulators into injection ports:
Data Normalization and Analysis
- Following assay completion, normalize data using nuclear staining (Hoechst) and automated counting
- Calculate key parameters: basal OCR, ATP-linked respiration, maximal respiration, proton leak, basal ECAR, glycolytic capacity, glycolytic reserve
- Compute Bioenergetic Health Index (BHI) from mitochondrial parameters
Figure 1: PBMC Metabolic Profiling Workflow Using Seahorse XF Technology
Protocol 2: Integrated Fluorescent Imaging with Metabolic Flux Analysis
This protocol enhances standard Seahorse assays by incorporating high-content fluorescence imaging to provide simultaneous normalization and functional assessment [16].
Additional Reagents
- Nuclear Stain: Hoechst 33342 (5 μg/mL final concentration)
- Mitochondrial Dyes: MitoTracker Red CMXRos (100 nM) for mitochondrial content and fragmentation
- Membrane Potential Indicator: TMRE (100 nM) for Δψm assessment
- ROS Detection: MitoSOX Red (5 μM) for mitochondrial superoxide
Integrated Workflow
- Perform standard Seahorse XF Mito Stress Test as described in Protocol 1
- Deliver fluorescent dyes through the fourth instrument port post-assay:
- Hoechst for nuclear counting and cell cycle distribution
- MitoTracker Red for mitochondrial content and fragmentation analysis
- TMRE for membrane potential assessment
- MitoSOX for mitochondrial ROS detection
- Wash plates and image using high-content imaging system (e.g., Cytation5)
- Analyze integrated data:
- Normalize OCR/ECAR to cell number from Hoechst counts
- Quantify mitochondrial fragmentation index from MitoTracker signal
- Assess Δψm heterogeneity from TMRE intensity distribution
- Correlate mitochondrial ROS production with metabolic parameters
Table 2: Research Reagent Solutions for Integrated Metabolic Profiling
| Reagent | Function | Working Concentration | Key Applications |
|---|---|---|---|
| Hoechst 33342 | Nuclear staining for cell counting and cycle analysis | 5 μg/mL | Normalization of metabolic data; cell cycle correlation studies [16] |
| MitoTracker Red | Mitochondrial content and morphology assessment | 100 nM | Quantification of mitochondrial mass; fragmentation analysis [16] |
| TMRE | Mitochondrial membrane potential (Δψm) indicator | 100 nM | Assessment of energetic state; detection of depolarized mitochondria [16] |
| MitoSOX Red | Mitochondrial superoxide detection | 5 μM | Correlation of ROS production with metabolic parameters [16] |
| CD3/CD28 Beads | T-cell activation for immunometabolic studies | Manufacturer's recommendation | Assessment of metabolic response to immune stimulation [28] |
| Oligomycin | ATP synthase inhibitor | 1.5 μM | Measurement of ATP-linked respiration [28] |
| FCCP | Mitochondrial uncoupler | 1.0 μM | Determination of maximal respiratory capacity [28] |
| Rotenone/Antimycin A | Electron Transport Chain inhibitors | 0.5 μM each | Measurement of non-mitochondrial respiration [28] |
Advanced Applications and Future Directions
Complementary Technologies for Enhanced Kinetic Profiling
The integration of Seahorse metabolic flux analysis with complementary technologies creates powerful multidimensional assessment platforms. The combination with high-content fluorescence imaging enables simultaneous measurement of bioenergetic function and mitochondrial properties including content, fragmentation state, membrane potential, and reactive oxygen species production [16]. This approach has revealed novel insights, such as how Rho-GTPases impact mitochondrial dynamics in breast cancer and how PGC1α and PRC1 inhibition affects mitochondrial function in pancreatic cancer [16]. Similarly, hyperpolarized 13C-NMR spectroscopy provides real-time flux measurements through entire metabolic pathways, as demonstrated in CAR T-cell studies where glycolytic flux changes of more than 30-fold were detected during expansion [29]. Kinetic Flux Profiling (KFP) with stable isotopes represents another powerful approach, quantifying metabolic fluxes based on the kinetics of cellular incorporation of isotopic label from nutrients into downstream metabolites [31].
Implications for Drug Discovery and Development
Real-time kinetic profiling has significant implications for pharmaceutical development, particularly in addressing off-target toxicity and therapeutic specificity. SPR-based kinetic studies demonstrate that approximately 33% of lead antibody candidates exhibit off-target binding, contributing to an estimated 30% of drug failures due to adverse effects [27]. Kinetic profiling enables detection of these transient off-target interactions that endpoint methods frequently miss, particularly for critical therapeutic modalities like CAR-T cells, antibody-drug conjugates (ADCs), and targeted protein degradation (TPD) platforms [27]. Interestingly, moderate affinity binding (KD = ~50-100 nM) in CAR-T therapies correlates with improved antitumor efficacy, highlighting the importance of kinetic parameter optimization during therapeutic development [27].
Figure 2: Integrated Kinetic Profiling Approaches for Enhanced Research Outcomes
Real-time kinetic profiling represents a paradigm shift in metabolic assessment, offering distinct advantages over traditional endpoint approaches for both basic research and therapeutic development. The ability to continuously monitor cellular bioenergetics as processes naturally unfold provides unprecedented insight into dynamic metabolic transitions, plasticity, and kinetic parameters that determine functional outcomes. Through implementation of the detailed protocols provided for Seahorse XF technology and complementary approaches, researchers can leverage these advantages to advance understanding of cellular energetics in health and disease. As the field continues to evolve, integration of kinetic profiling across discovery and development pipelines promises to enhance predictive power and success rates in translating fundamental metabolic insights into clinical applications.
Practical Applications: From Standard Assays to Advanced Biological Models
Seahorse metabolic flux analysis serves as a cornerstone technology for the real-time assessment of cellular energetics, providing simultaneous measurement of Oxygen Consumption Rate (OCR) and Extracellular Acidification Rate (ECAR) as key indicators of mitochondrial respiration and glycolysis, respectively [26] [32]. The Mitochondrial Stress Test and Glycolysis Stress Test are two foundational protocols that have become the "gold standard" for investigating cellular metabolic phenotypes in diverse research areas, from cancer biology to immunology and drug development [6] [33]. These assays offer a window into the dynamic metabolic adaptations of cells, enabling researchers to probe fundamental bioenergetic pathways and their alterations in disease states. This application note provides a detailed guide to the experimental workflows, reagent preparation, and data interpretation for these essential assays.
The Scientist's Toolkit: Essential Reagents and Materials
The following table catalogs the core reagents and materials required to execute the stress test assays.
Table 1: Key Research Reagent Solutions for Stress Test Assays
| Item | Function/Description |
|---|---|
| Seahorse XF Analyzer | Instrument platform for real-time, simultaneous measurement of OCR and ECAR [33] [32]. |
| XF Assay Medium | Bicarbonate-free medium (e.g., XF Base Medium) essential to prevent pH drift from CO₂ degassing [6]. |
| Oligomycin | Inhibits ATP synthase (Complex V); decreases OCR, revealing ATP-linked respiration [32] [34]. |
| FCCP | Mitochondrial uncoupler that collapses the proton gradient, driving maximal OCR to measure respiratory capacity [33] [32]. |
| Rotenone & Antimycin A | Inhibitors of mitochondrial Electron Transport Chain Complex I and III, respectively; used together to shut down mitochondrial respiration and reveal non-mitochondrial oxygen consumption [33] [34]. |
| Glucose | Primary fuel for glycolysis; its injection during the Glycolysis Stress Test reveals glycolytic capacity [6]. |
| 2-Deoxy-D-Glucose (2-DG) | A non-metabolizable glucose analog that inhibits glycolysis; used to confirm that ECAR is due to glycolytic activity [6]. |
| Cell Culture Microplates | Specialized plates designed for use with the Seahorse analyzer [35]. |
| Compounds for Cell Adhesion | Poly-D-Lysine (PDL) or Poly-L-Lysine (PLL); used to immobilize non-adherent cells like lymphocytes or PBMCs to the assay plate [33]. |
Mitochondrial Stress Test Workflow
The Mitochondrial Stress Test is the widely recognized, well-accepted standard assay for comprehensively assessing mitochondrial function by measuring key parameters including basal respiration, ATP-linked respiration, maximal respiration, and proton leak [35].
Assay Principle and Workflow
The assay sequentially injects modulators into the electron transport chain, and the resulting changes in OCR are used to calculate key parameters [32].
Detailed Experimental Protocol
Reagent Preparation
- Mitochondrial Stress Test Medium: Prepare XF base medium supplemented with 1 mM pyruvate, 2 mM glutamine, and 10 mM glucose (for energy demanding cells) or 25 mM glucose. Adjust pH to 7.4, sterile filter, and warm to 37°C before use [6] [34].
- Inhibitor Stocks: Prepare concentrated stock solutions in DMSO for long-term storage at -20°C [6]:
- Oligomycin: 10 mM stock
- FCCP: Titrate concentration for different cell types (e.g., 0.5-2 µM); prepare a 1-10 mM stock [34]
- Rotenone: 10 mM stock
- Antimycin A: 10 mM stock
- Working Drug Solutions: Dilute stocks in the prepared Mitochondrial Stress Test Medium to the desired final concentration for loading into the sensor cartridge. Final DMSO concentration should typically be ≤0.5% [6].
Cell Seeding and Assay Plate Preparation
- Seed cells in a dedicated Seahorse cell culture microplate at an optimized density. Cell density is critical and must be determined by titration for each cell type.
- For non-adherent cells (e.g., lymphocytes, PBMCs), coat plates with Poly-D-Lysine or Poly-L-Lysine (50 µg/mL) to immobilize cells [6] [33].
- Incubate the seeded assay plate overnight under normal growth conditions (37°C, 5% CO₂).
Sensor Cartridge Hydration and Calibration
- Hydrate the Seahorse XF sensor cartridge in XF calibrant solution in a non-CO₂ incubator at 37°C for at least 12-18 hours (typically overnight) before the assay [33].
- Load the prepared working drug solutions into the designated ports of the hydrated sensor cartridge.
Assay Execution and Data Acquisition
- On the day of the assay, replace the cell culture medium in the assay plate with the prepared Mitochondrial Stress Test Medium.
- Incubate the assay plate in a non-CO₂ incubator at 37°C for 45-60 minutes to allow temperature and pH equilibration [34].
- Calibrate the hydrated, drug-loaded sensor cartridge in the Seahorse Analyzer.
- After calibration, replace the calibration plate with the cell culture microplate and start the automated assay program.
Data Analysis and Key Parameters
The Wave Software (Agilent Technologies) is used to calculate key metabolic parameters from the OCR trace [34]:
Table 2: Mitochondrial Stress Test Parameters and Calculations
| Parameter | Biological Significance | Calculation |
|---|---|---|
| Basal Respiration | The baseline OCR driven by mitochondrial respiration under steady-state conditions. | (Last OCR rate before 1st injection) – (Non-mitochondrial respiration) |
| ATP-linked Respiration | The portion of basal respiration used to drive ATP synthesis. | (Last OCR rate before oligomycin) – (Minimum rate after oligomycin) |
| Proton Leak | The portion of basal respiration not coupled to ATP synthesis, representing energy dissipation. | (Minimum rate after oligomycin) – (Non-mitochondrial respiration) |
| Maximal Respiration | The maximum respiratory capacity the cell can achieve when the electron transport chain is fully stimulated. | (Maximum rate after FCCP) – (Non-mitochondrial respiration) |
| Spare Respiratory Capacity | The extra respiratory capacity available to the cell to respond to stress or increased energy demand. | (Maximal respiration) – (Basal respiration) |
| Non-Mitochondrial Respiration | Oxygen consumption from processes outside the mitochondrial electron transport chain. | Minimum rate after Rotenone/Antimycin A injection |
Glycolysis Stress Test Workflow
The Glycolysis Stress Test provides a dynamic profile of glycolytic function by measuring the ECAR after serial injection of modulators that force cells to rely increasingly on glycolysis [6] [32].
Assay Principle and Workflow
The assay measures the extracellular acidification resulting from lactate production during glycolysis after sequential injection of glucose, oligomycin, and 2-DG [6] [32].
Detailed Experimental Protocol
Reagent Preparation
- Glycolysis Stress Test Medium: Prepare XF base medium supplemented with 2 mM glutamine. Adjust pH to 7.4, sterile filter, and warm to 37°C before use [6]. The absence of bicarbonate is critical for accurate ECAR measurement [6].
- Compound Stocks:
- Glucose: Prepare a 250 mM solution in Glycolysis Stress Test Medium fresh on the day of the experiment [6].
- Oligomycin: Use the same 10 mM DMSO stock as for the Mitochondrial Stress Test [6].
- 2-Deoxy-D-Glucose (2-DG): Prepare a 500 mM solution in Glycolysis Stress Test Medium fresh on the day of the experiment [6].
Cell Seeding and Assay Plate Preparation
- Follow the same cell seeding and plate preparation procedures as for the Mitochondrial Stress Test. The same cell plate can sometimes be used for sequential assays, but this requires careful experimental design.
Sensor Cartridge Hydration and Calibration
- The process is identical to the Mitochondrial Stress Test, except the sensor cartridge ports are loaded with glucose, oligomycin, and 2-DG working solutions.
Assay Execution and Data Acquisition
- Replace cell growth medium with Glycolysis Stress Test Medium and incubate in a non-CO₂ incubator at 37°C for 45-60 minutes.
- Calibrate and run the assay as described for the Mitochondrial Stress Test.
Data Analysis and Key Parameters
Key glycolytic parameters are derived from the ECAR trace:
Table 3: Glycolysis Stress Test Parameters and Calculations
| Parameter | Biological Significance | Calculation |
|---|---|---|
| Glycolysis | The glycolytic rate after the addition of glucose, representing the core glycolytic function of the cell. | (ECAR after glucose injection) – (Basal ECAR) |
| Glycolytic Capacity | The maximum glycolytic rate the cell can achieve when mitochondrial ATP production is inhibited, forcing reliance on glycolysis. | (ECAR after oligomycin injection) – (Basal ECAR) |
| Glycolytic Reserve | The cell's ability to upregulate glycolysis in response to increased energy demand or stress. | (Glycolytic Capacity) – (Glycolysis) |
| Non-Glycolytic Acidification | Acidification from sources other than lactic acid production, such as from CO₂ produced in the TCA cycle. | ECAR rate after 2-DG injection |
Critical Considerations for Assay Optimization
Successful application of these stress tests requires careful optimization for specific experimental models.
- Cell Density Titration: The cell number per well must be optimized for each cell type to ensure signals are within the dynamic range of the instrument. A strong correlation between seeded cell number and basal OCR/ECAR should be established [36].
- Normalization Strategies: Accurate normalization is critical for data integrity. While protein concentration (via BCA assay) is common [34], brightfield image analysis has been shown to effectively reduce both within-subject and between-subject variation for certain primary cells [36].
- Cell-Specific Adhesion: Non-adherent cells like lymphocytes and PBMCs require plate coating with Poly-D-Lysine or Poly-L-Lysine for immobilization. Studies show no statistical difference in effectiveness between PDL and PLL for PBMCs [33].
- Compound Titration: Critical concentrations, particularly for FCCP, must be titrated for different cell types to achieve maximal respiration without inducing toxicity. For example, optimal FCCP concentration varied significantly between different prostate cancer cell lines [34].
The Mitochondrial and Glycolysis Stress Tests are powerful, complementary protocols that provide a comprehensive profile of cellular metabolic function. The detailed workflows and optimization strategies outlined in this application note provide a robust foundation for researchers to implement these core assays, enabling critical insights into cellular bioenergetics across basic research and drug discovery applications.
The metabolic network, an intricate system of biochemical processes, is fundamental to life-sustaining functions, driving energy production, biosynthesis, redox regulation, and cellular signaling [26] [1]. Understanding cellular metabolism dynamics is crucial not only for unraveling fundamental biological principles but also for elucidating the pathophysiology of various diseases and developing novel therapeutic interventions [1]. The Agilent Seahorse Extracellular Flux (XF) Analyzer has emerged as a pivotal technology in this domain, enabling real-time, noninvasive measurement of key metabolic parameters in live cells [1]. This technology provides unprecedented insights into cellular bioenergetics by simultaneously quantifying the Oxygen Consumption Rate (OCR) and Extracellular Acidification Rate (ECAR), which serve as proxies for mitochondrial respiration and glycolytic activity, respectively [12] [1].
The versatility of the Seahorse XF platform allows for comprehensive metabolic phenotyping across diverse biological models, including cancer cells, immunocytes, primary cells, and stem cells [26] [1]. This application note details standardized protocols and considerations for applying Seahorse metabolic flux analysis to these varied cellular models, providing researchers with a framework for investigating metabolic reprogramming in different physiological and pathological contexts within the broader thesis of cellular energetics research.
Principles of Extracellular Flux Technology
Fundamental Measurements and Metabolic Pathways
The Seahorse XF Analyzer operates by monitoring changes in oxygen and proton concentrations in the extracellular microenvironment surrounding live cells [1]. The core measurements obtained are:
- Oxygen Consumption Rate (OCR): An indicator of mitochondrial respiration, representing the rate at which cells consume oxygen, primarily for oxidative phosphorylation [12] [1].
- Extracellular Acidification Rate (ECAR): Primarily a measure of glycolytic flux, representing the rate at which cells acidify their environment through lactic acid production [12] [1].
Glycolysis and oxidative phosphorylation represent the two primary pathways for adenosine triphosphate (ATP) production in most mammalian cells [12] [1]. During glycolysis, glucose is converted to pyruvate, generating ATP and lactate, which acidifies the extracellular environment [1]. In oxidative phosphorylation, electrons from NADH and FADH2 are transferred through the mitochondrial electron transport chain (ETC) to oxygen, generating a proton gradient that drives ATP synthesis [1]. Oxygen serves as the final electron acceptor in this process and is continuously consumed while the ETC is active [1].
Assay Workflow and Core Kits
The typical Seahorse XF assay involves a multi-day workflow with key preparation and execution steps. The general workflow is consistent across different biological models, though specific optimization is required for each cell type.
The platform offers specialized assay kits designed to probe specific metabolic pathways:
- XF Cell Mito Stress Test: Provides a comprehensive assessment of mitochondrial function through sequential injection of modulators targeting ETC components [37] [1].
- XF Glycolysis Stress Test: Evaluates glycolytic function and capacity by measuring the cellular response to glucose, oligomycin, and 2-DG [37].
- XF Real-Time ATP Rate Assay: Quantifies the relative contributions of mitochondrial and glycolytic pathways to total ATP production in real-time [12].
Applications Across Diverse Biological Models
Metabolic Profiling of Cancer Cells
Cancer cells undergo metabolic reprogramming to support rapid proliferation, survival, and growth in challenging microenvironments [38] [39]. The Seahorse XF platform enables detailed characterization of these metabolic alterations, providing insights into tumor biology and potential therapeutic vulnerabilities.
Table 1: Optimized Seeding Densities for Different Cancer Models
| Cell Type | Plate Format | Seeding Density Range (cells/well) | Key Considerations |
|---|---|---|---|
| Adherent Cancer Cells | XFp Miniplate | 5,000 - 40,000 | Achieve 50-90% confluency; optimize for each cell line [40] |
| Suspension Cancer Cells | XFp Miniplate | 50,000 - 200,000 | Higher densities required; centrifuge with microplate rotor [12] [40] |
| Adherent Cells (High Sensitivity) | XF HS Miniplate | 1,000 - 10,000 | 30% seeding area of standard plates [40] |
| Suspension Cells (High Sensitivity) | XF HS Miniplate | 20,000 - 70,000 | Limited cell availability studies [40] |
The metabolic heterogeneity between different cancer models necessitates specific experimental adaptations:
Adherent vs. Suspension Cancer Cells: Research indicates significant metabolic differences between these growth states. Suspension cells often demonstrate higher mitochondrial activity, while adherent cells may show greater dependency on glycolytic turnover [12]. The Agilent Seahorse XF Pro Analyzer can profile both cell types with adjustments to plate type, cell counting, and normalization methods [12].
3D Cancer Models: Organoids and spheroids better replicate the structural and metabolic heterogeneity of in vivo tumors. These models require optimization of cell dissociation protocols and seeding methods to maintain viability and function [26] [39]. Studies on human colorectal cancer organoids have demonstrated the utility of Seahorse technology in evaluating metabolic responses to combination therapies in more physiologically relevant systems [39].
Investigating Immunocyte Metabolism
Immune cell activation, differentiation, and function are tightly coupled to metabolic reprogramming [41]. Extracellular flux analysis provides crucial insights into the metabolic signatures of different immune cell populations and their role in pathological conditions like cancer.
T Cells in Tumor Microenvironment: The immunosuppressive tumor microenvironment disrupts essential metabolic processes in T cells, hindering immunotherapy success [41]. Combined Seahorse and flow cytometry analysis enables correlation of metabolic phenotypes with immune cell function, providing a comprehensive view of metabolic signatures within different cellular compartments of the tumor microenvironment [41].
Protocol Considerations: Primary immune cells often have limited availability and may require immediate analysis post-isolation. The XF HS Miniplate platform facilitates functional analysis with significantly fewer cells, enabling metabolic profiling of rare immune cell populations [40].
Primary Cells and Stem Cells
Primary cells and stem cells present unique challenges for metabolic analysis due to their sensitivity, limited expansion capacity, and specialized growth requirements.
Primary Retinal Photoreceptors: A specialized protocol has been developed for measuring bioenergetics in dissociated mouse retinal photoreceptors [37]. This method involves papain-based dissociation to obtain morphologically intact and viable photoreceptor cells from adult mice, addressing limitations of traditional retinal explant approaches which often respond poorly to metabolic inhibitors [37]. The protocol emphasizes maintaining dark-adapted conditions throughout the process to preserve physiological metabolic states.
Stem Cell Considerations: Pluripotent stem cells and adult stem populations often have distinct metabolic phenotypes that change during differentiation. Special attention must be paid to culture conditions, matrix coatings, and developmental stage when designing experiments with these models.
Detailed Experimental Protocols
ATP Rate Assay for Suspension Cancer Cells
This protocol has been optimized for profiling metabolic fluxes in suspension cancer cells using the Seahorse XF Real-Time ATP Rate Assay [12].
Day Before Assay:
- Sensor Cartridge Hydration:
- Aliquot XF Calibrant (at least 20 mL for 96-well plates) into a conical tube and place in a non-CO₂ 37°C incubator overnight [12].
- Open Extracellular Flux Assay Kit and separate components.
- Fill utility plate wells with XF Calibrant (200 μL for XFp plates) [40].
- Assemble cartridge in utility plate, ensuring sensors are submerged, and incubate in non-CO₂ 37°C incubator for 16 hours [37] [40].
- Cell Preparation:
- Count suspension cells and centrifuge at appropriate speed.
- Resuspend cells in pre-warmed assay medium (Seahorse XF RPMI or DMEM, pH 7.4, supplemented with 10 mM glucose, 1 mM pyruvate, and 2 mM glutamine) [12].
- Seed cells in poly-D-lysine coated XFp PDL cell culture microplates at optimized density (typically 50,000-200,000 cells/well for suspension cells in XFp plates) [12] [40].
- Centrifuge microplates at 200 × g for 1 minute to settle cells evenly onto the plate surface.
- Incubate seeded plates in CO₂ incubator at 37°C for 15-30 minutes to allow cell attachment before transferring to non-CO₂ incubator overnight [12].
Day of Assay:
- Prepare Assay Medium:
Load Modulators:
- Prepare working concentrations of oligomycin (1.5 μM final) and rotenone/antimycin A (0.5 μM final) in assay medium [12].
- Load ports in this order: Port A - oligomycin; Port B - rotenone/antimycin A mixture.
- Ensure precise loading volumes according to plate specifications (typically 25-26 μL for XFp plates).
Equilibrate and Run Assay:
- Remove cell culture medium from seeded plate and replace with 180 μL pre-warmed assay medium.
- Incubate cell culture plate in non-CO₂ 37°C incubator for 45-60 minutes.
- Meanwhile, hydrate sensor cartridge with XF Calibrant and equilibrate for minimum 15-30 minutes.
- Calibrate cartridge in XF Analyzer following instrument-specific protocols.
- Replace utility plate with cell culture plate and initiate ATP Rate Assay program.
Mitochondrial Stress Test for Primary Retinal Photoreceptors
This specialized protocol enables real-time assessment of mitochondrial function in freshly dissociated mouse retinal photoreceptors [37].
Day Before Assay:
- Sensor Cartridge Hydration: Follow standard hydration protocol as described in section 4.1.
- Dark Adaptation: Place mice in new cages with access to food and water in a dark room for 16 hours [37].
- Plate Coating:
- Prepare 0.01 mg/mL Poly-D-lysine solution in sterile water.
- Add 100 μL to each well of Seahorse XF24 cell culture microplate.
- Incubate for 1 hour in cell culture hood, aspirate solution, and air-dry until completely dry [37].
Day of Assay:
- Retina Dissociation (perform under dim red light):
- Euthanize dark-adapted mouse and enucleate eyes.
- Dissect retinas in phosphate buffered saline (PBS), pH 7.4.
- Transfer both retinas to papain solution (pre-equilibrated in cell culture incubator).
- Incubate retinas in papain solution for 20 minutes at 37°C with 5% CO₂.
- Mechanically triturate retinas 10-15 times using P1000 pipette.
- Add ovomucoid inhibitor solution and gently pipette 5 times.
- Pass cell suspension through 35 μm strainer into round-bottom test tube.
- Count cells using hemocytometer or automated cell counter [37].
- Mitochondrial Stress Test Setup:
- Prepare mitochondrial stress test medium (XF base medium supplemented with 10 mM glucose, 1 mM pyruvate, and 2 mM glutamine, pH 7.4) [37].
- Seed dissociated photoreceptors at optimized density in pre-coated Seahorse plate.
- Prepare and load mitochondrial modulators in sequence: Port A - oligomycin (1.5 μM), Port B - FCCP (1.0 μM), Port C - rotenone/antimycin A (0.5 μM each) [37] [1].
- Follow standard equilibration and calibration procedures.
- Run Mitostress Test program with 3 baseline measurements and 3 measurements after each injection.
Table 2: Key Metabolic Parameters from Mitochondrial Stress Test
| Parameter | Calculation Method | Biological Significance |
|---|---|---|
| Basal Respiration | Last baseline measurement before oligomycin - Non-mitochondrial respiration | Energy demand under baseline conditions |
| ATP-linked Respiration | Last baseline measurement - Measurement after oligomycin | Fraction of respiration coupled to ATP production |
| Proton Leak | Measurement after oligomycin - Non-mitochondrial respiration | Capacity not coupled to ATP production |
| Maximal Respiration | Maximum measurement after FCCP - Non-mitochondrial respiration | Reserve capacity of electron transport chain |
| Spare Respiratory Capacity | Maximal respiration - Basal respiration | Ability to respond to increased energy demand |
| Non-mitochondrial Oxygen Consumption | Measurement after rotenone/antimycin A | Oxygen consumption from non-mitochondrial sources |
Metabolic Pathway Mapping and Data Interpretation
Key Metabolic Pathways in Cellular Energetics
The Seahorse XF Analyzer primarily probes two fundamental energy-producing pathways: mitochondrial oxidative phosphorylation and glycolysis. Understanding the interplay between these pathways is essential for accurate data interpretation across different biological models.
Data Normalization and Analysis
Appropriate normalization is critical for generating meaningful and reproducible Seahorse XF data. The optimal normalization method depends on the biological model and experimental question:
- Cell Number Normalization: Most appropriate for homogeneous cell populations where accurate cell counting is feasible. Typically performed using automated cell counters or hemocytometers [12].
- Protein Content: Suitable for samples with potential cell aggregation or when precise cell counting is challenging. Performed using colorimetric assays like BCA following the Seahorse assay [12].
- DNA Content: Optimal for complex primary cultures or tissues with mixed cell populations.
For complex models like tumor organoids or primary tissues, integrated approaches combining Seahorse analysis with other techniques provide the most comprehensive metabolic insights. Combining extracellular flux data with flow cytometry enables correlation of metabolic phenotypes with cell surface markers or functional assays, particularly valuable in heterogeneous samples like tumor microenvironments [41].
Essential Reagents and Research Solutions
Table 3: Key Research Reagent Solutions for Seahorse Assays
| Reagent/Category | Specific Examples | Function/Application |
|---|---|---|
| Assay Media | Seahorse XF DMEM, Seahorse XF RPMI | Base media formulations optimized for extracellular flux assays [12] [40] |
| Metabolic Substrates | Glucose (1.0 M), Pyruvate (100 mM), Glutamine (200 mM) | Provide essential nutrients for basal metabolism [12] [40] |
| Inhibitors/Modulators | Oligomycin, FCCP, Rotenone, Antimycin A | Probe specific mitochondrial functions in stress tests [37] [1] |
| Cell Preparation | Papain Dissociation System, Poly-D-lysine | Isolate viable cells and promote adhesion to microplates [37] |
| Specialized Kits | XF Real-Time ATP Rate Assay, XF Glycolysis Stress Test, XF Mito Stress Test | Comprehensive solutions for specific metabolic pathways [12] |
| Cartridge & Calibration | XF FluxPaks, XF Calibrant Solution | Essential hardware and calibration components [12] [40] |
The Agilent Seahorse XF platform provides a powerful, versatile approach for investigating cellular metabolism across diverse biological models. The protocols and considerations outlined in this application note provide researchers with a foundation for designing and executing robust metabolic flux analyses in cancer cells, immunocytes, primary cells, and stem cells. By adapting standardized methodologies to account for model-specific requirements, researchers can generate reliable, reproducible data that advances our understanding of cellular energetics in health and disease.
The integration of Seahorse technology with complementary approaches like flow cytometry and metabolomics offers exciting opportunities for multi-dimensional metabolic characterization, particularly in complex systems like the tumor microenvironment. As research in cellular metabolism continues to evolve, these methodologies will play an increasingly important role in identifying metabolic vulnerabilities and developing novel therapeutic strategies.
The transition from conventional two-dimensional (2D) cell cultures to three-dimensional (3D) models represents a paradigm shift in biomedical research, particularly for studies investigating cellular metabolism. While 2D cell culture models grown from immortalized cell lines have served as a foundation for disease modeling and drug development for decades, they typically lack biological complexity and physiological relevance [42]. In contrast, 3D cell cultures, including spheroid and organoid cultures, are developed to imitate tissue-like or organ-like characteristics that better replicate the cellular environment in vivo [42]. These models exhibit gene and protein expression signatures closer to those observed in living organisms, making them invaluable for neurobiology, stem cell research, regenerative medicine, and cancer biology [42].
The application of Seahorse extracellular flux (XF) technology to measure metabolic fluxes in real-time has become increasingly important for understanding cellular bioenergetics. This technology simultaneously measures the oxygen consumption rate (OCR) and extracellular acidification rate (ECAR) of cells, enabling researchers to quantitatively dissect the contribution of central metabolic pathways, including glycolysis, mitochondrial respiration, and fatty acid oxidation [43] [26]. When applied to 3D models, Seahorse analysis provides a unique window into the complex metabolic interactions that occur within tissue-like structures, offering insights that are more predictive of in vivo responses [43].
Table 1: Comparison of 2D and 3D Cell Culture Models
| Characteristic | 2D Culture | 3D Culture |
|---|---|---|
| Physiological Relevance | Limited biological complexity | Recapitulates tissue-like properties |
| Cell-Cell Interactions | Primarily monolayer with limited contacts | Enhanced 3D interactions mimicking in vivo conditions |
| Metabolic Environment | Homogeneous nutrient and gas distribution | Heterogeneous gradients (oxygen, nutrients, waste) |
| Gene Expression | Often altered due to plastic substrate | Closer to in vivo expression patterns |
| Drug Response | May overestimate efficacy | More predictive of clinical outcomes |
| Applications | Preliminary screening, basic research | Disease modeling, personalized medicine, drug discovery |
Methodological Approaches for 3D Model Generation
Spheroid Formation Techniques
Multiple established methods exist for generating 3D spheroids, each with distinct advantages and limitations. The choice of methodology depends on the specific research requirements, including throughput, uniformity needs, and available resources.
Low-Attachment Plate Method: This scaffold-free approach utilizes culture plates with an ultra-low attachment hydrophilic polymer coating that prevents protein adsorption and cell adhesion to the vessel surface [44]. Instead, cells aggregate via cell-cell and cell-ECM interactions to form spheroids. The benefits of this method include straightforward protocol implementation, efficient spheroid formation, suitability for multicellular spheroids and co-culture systems, and compatibility with a wide range of tumor cell types [44]. The main limitations include potential lack of uniformity between spheroids, the relatively high cost of coated plates, and difficulties with continuous passage culture and long-term toxicity analyses [44].
Hanging Drop Plate Method: This technique employs open bottomless wells that accommodate droplets of media (typically 10-20 μL) where cells self-aggregate by gravity and surface tension [44]. With no surface for attachment, spheroids form within the suspended media droplets. The key advantages of this approach include the production of highly uniform spheroids, low cost, ease of handling, and suitability for co-culturing and high-throughput testing [43] [44]. Limitations include difficulty with medium changes, incompatibility with different drug treatments at various time periods, and constraints for long-term culture due to small culture volume [44].
Scaffold-Based Methods: These anchorage-dependent techniques employ pre-designed porous membranes and polymeric fabric meshes—termed "scaffolds"—which can be fabricated from natural or synthetic materials [44]. Natural scaffolds include fibronectin, collagen, laminin, gelatin, cellulose, chitosan, glycosaminoglycans, fibroin, agarose, alginate, starch, and human decellularized ECM [44]. The benefits include high similarity to in vivo settings, ability to control composition/elasticity/porosity to achieve better ECM presentation, enhanced biocompatibility, and reduced toxicity [44]. Disadvantages include high cost, time-consuming procedures, complexity that makes large-scale production challenging, and difficulty separating cells from scaffolds for downstream analyses like flow cytometry and confocal imaging [44].
Table 2: Spheroid Formation Methods and Characteristics
| Method | Key Principle | Advantages | Limitations |
|---|---|---|---|
| Low-Attachment Plates | Prevents adhesion via specialized coating | Simple protocol; suitable for co-cultures; works with many cell types | Potential size variability; expensive plates; challenging long-term culture |
| Hanging Drop | Gravity-mediated aggregation in suspended droplets | High uniformity; cost-effective; good for high-throughput | Difficult medium changes; limited drug treatment flexibility; small culture volume |
| Scaffold-Based | Physical 3D support for cell growth | High physiological relevance; tunable properties; excellent biocompatibility | High cost; complex protocol; difficult cell retrieval for analysis |
Organoid Generation from Pluripotent Stem Cells
The generation of organoids from human induced pluripotent stem cells (hiPSCs) represents a significant advancement in 3D culture technology. A notable example is the development of tissue-engineered neuromuscular organoids (t-NMOs) that model the human neuromuscular system [45]. The protocol involves seeding hiPSCs as single cells onto decellularized skeletal muscles (dSkMs) that preserve the structural and topographical features of native tissue, followed by a small molecule-based neuromuscular differentiation protocol [45]. This approach results in 3D multiscale constructs containing compartmentalized neuronal and muscular components that establish functional interactions, allowing muscle contraction after 30 days of differentiation [45]. The incorporation of native ECM components provides environmental imprinting cues that enhance the maturation and functionality of the resulting organoids, making them particularly valuable for disease modeling, as demonstrated by the recreation of Duchenne Muscular Dystrophy patient-specific t-NMOs that recapitulate disease-specific phenotypes like reduced skeletal muscle contraction and altered calcium dynamics [45].
Optimized Workflow for Seahorse Metabolic Analysis of 3D Cultures
Protocol for Metabolic Flux Analysis in Cancer Spheroids
The application of Seahorse XF technology to 3D cultures requires specific optimization to account for the structural and physiological differences compared to 2D cultures. Campioni et al. (2022) established a reliable and reproducible workflow for Seahorse metabolic analysis of cancer spheroids that reduces variability in metabolic parameters among experimental replicates [43]. The optimized protocol encompasses the following key steps:
Spheroid Formation and Culture: Spheroids are generated in U-bottom Ultra-Low Attachment (ULA) 96-well plates to ensure the formation of structures highly regular in shape and homogenous in size [43]. For breast cancer cell lines MCF7 and MDA-MB-231, spheroids are formed in 3D experimental medium consisting of DMEM without phenol red, supplemented with 1% BSA, 10 mM glucose, 2 mM glutamine, 10 μg/mL insulin, 0.5 μg/mL hydrocortisone, 20 ng/mL EGF, 100 ng/mL cholera toxin, 1 mM Na-pyruvate, and antibiotics [43]. The number of plated cells determines the eventual spheroid size, with densities typically ranging from 1,000 to 20,000 cells per spheroid.
Spheroid Transfer to XF Plates: After spheroid formation (typically 3-7 days), individual spheroids are carefully transferred to XF analyzer plates pre-coated with Cell-Tak or another suitable adhesive to prevent movement during measurements [43]. The transfer process requires precision to maintain spheroid integrity and minimize damage.
Metabolic Assay Conditions: The assay medium for Seahorse analysis should be optimized for 3D cultures, typically consisting of XF base medium supplemented with 1-10 mM glucose, 1-2 mM glutamine, and 0.5-1 mM sodium pyruvate, depending on the specific metabolic pathways under investigation [43]. The medium pH should be carefully adjusted to 7.4, and it is recommended to pre-equilibrate the medium to the assay temperature (typically 37°C) before use.
Metabolic Stress Tests: The Mito Stress Test is commonly applied to investigate mitochondrial function through sequential injection of modulators of the electron transport chain: oligomycin (ATP synthase inhibitor), FCCP (mitochondrial uncoupler), and rotenone/antimycin A (complex I and III inhibitors) [43]. The Glycolysis Stress Test, employing glucose, oligomycin, and 2-deoxyglucose, can be used to assess glycolytic function.
Normalization Approaches: A critical aspect of the optimized workflow involves high-resolution imaging of each spheroid followed by calculation of the number of viable cells, enabling normalization of metabolic parameters on a per-cell basis [43]. This approach allows for grouping spheroids as a function of their size and accounts for variability in spheroid cellularity.
Diagram 1: Seahorse Metabolic Analysis Workflow for 3D Cultures
Key Considerations for 3D Metabolic Analysis
Several critical factors must be addressed to ensure reliable and reproducible Seahorse assays in 3D models:
Size Uniformity and Quality Control: Spheroids must be highly regular in shape and homogenous in size to reduce variability in metabolic parameters among experimental replicates [43]. Imaging-based quality control should be implemented before assays to exclude irregularly shaped or damaged spheroids.
Oxygen and Nutrient Gradients: Unlike 2D cultures, 3D models develop concentration gradients for oxygen, pH, and soluble components such as nutrients and waste metabolites, leading to heterogeneous cell phenotypes [43]. These gradients create distinct microenvironments within spheroids, with proliferating cells typically located at the outer layers and quiescent or necrotic cells in the central core due to hypoxic and nutrient-deprived conditions [43]. Researchers must consider how these intrinsic gradients might affect metabolic measurements.
Normalization Strategies: Proper normalization is essential for accurate interpretation of Seahorse data. While protein content normalization is commonly used in 2D cultures, high-resolution imaging followed by calculation of viable cell number per spheroid provides superior normalization for 3D cultures [43]. This approach enables grouping of spheroids by size and normalization of metabolic parameters on a per-cell basis.
Cell Line-Specific Metabolic Phenotypes: Different cell lines exhibit distinct metabolic behaviors in 3D culture. Research has demonstrated that hormone-responsive MCF7 breast cancer cells maintain good metabolic plasticity in both 2D and 3D cultures, while triple-negative MDA-MB-231 cells withstand metabolic stress much better in 2D than in 3D cultures [43]. These differences highlight the importance of validating assays for specific cell models.
The Scientist's Toolkit: Essential Research Reagents and Materials
Successful implementation of 3D culture and metabolic analysis requires specific reagents and materials optimized for these complex models. The following table details essential components and their functions:
Table 3: Essential Research Reagents and Materials for 3D Culture and Metabolic Analysis
| Item | Function/Application | Examples/Specifications |
|---|---|---|
| Ultra-Low Attachment (ULA) Plates | Prevents cell adhesion and promotes spheroid formation via hydrophilic polymer coating | Corning Spheroid Microplates; PerkinElmer ULA 96-well plates |
| Decellularized Extracellular Matrix | Provides biological scaffold with native tissue composition and architecture | Decellularized skeletal muscles (dSkMs); Corning Matrigel matrix |
| Seahorse XF Analyzer | Measures real-time oxygen consumption rate (OCR) and extracellular acidification rate (ECAR) | Agilent Seahorse XFe96; XF Pro analyzer |
| Metabolic Stress Test Kits | Contains optimized drug combinations for assessing specific metabolic pathways | Agilent Mito Stress Test Kit; Glycolysis Stress Test Kit |
| Cell Adhesives | Immobilizes 3D cultures in Seahorse plates during assay | Cell-Tak; Poly-D-Lysine |
| Basal Assay Media | Provides nutrient-controlled environment for metabolic measurements | XF Base Medium; DMEM without phenol red, supplements |
| Metabolic Modulators | Pharmacological agents targeting specific metabolic pathways | Oligomycin, FCCP, Rotenone, Antimycin A, 2-Deoxyglucose |
Advanced Applications and Future Directions
Disease Modeling and Drug Development
Three-dimensional culture systems have become indispensable tools for disease modeling and therapeutic development. In cancer research, 3D models better recapitulate the molecular and physiological aspects of tumor architecture, including the development of heterogeneous microregions with varying proliferative activity, quiescent cell populations, and necrotic areas [43]. This structural complexity enables more accurate studies of tumor metabolism and drug responses. The application of these models extends to neurological disorders, with tissue-engineered neuromuscular organoids successfully modeling Duchenne Muscular Dystrophy, recapitulating disease-specific phenotypes such as reduced skeletal muscle contraction and altered calcium dynamics [45].
In immunotherapy research, particularly for Chimeric Antigen Receptor T-cell (CAR-T) therapy development, 3D co-culture systems serve as attractive intermediate systems between conventional in vitro and in vivo models [46]. Unlike 2D systems, 3D models provide a more physiologically relevant environment that better mimics the tumor microenvironment (TME), tumor heterogeneity, and immune interactions which CAR-T cells must encounter [46]. This capability is especially valuable for solid tumors, where the hostile TME presents significant challenges that traditional 2D culture systems fail to accurately replicate.
Metabolic Pathways in Neural Organoids
The study of metabolism in human brain development represents a particularly promising application for 3D models. Neural organoids differentiated from pluripotent stem cells provide access to human cells that mirror many endogenous tissue-level interactions, organ structure, and gene expression profiles [47]. These models enable investigation of metabolic transitions during neurodevelopment, including the switch from aerobic glycolysis to oxidative phosphorylation as neural progenitors differentiate into neurons [47]. Although neural organoids show great promise for understanding metabolic aspects of neurodevelopment, studies have suggested that metabolic alterations in these models may be atypical of endogenous neurodevelopment, highlighting the need for careful validation against in vivo benchmarks [47].
Diagram 2: Neural Organoid Differentiation and Metabolic Maturation
Emerging Technologies and Methodological Innovations
The field of 3D culture continues to evolve with emerging technologies that enhance physiological relevance and experimental throughput. Microfluidic systems and organ-on-chip technologies integrate dynamic perfusion capabilities, enabling more precise control over microenvironmental conditions and better replication of tissue-tissue interfaces [46]. Bioprinting approaches allow precise spatial organization of multiple cell types within 3D constructs, facilitating the creation of more complex tissue models with reproducible architecture [46].
Advanced imaging techniques, including optical clearing methods combined with high-resolution microscopy, enable detailed morphological analysis of intact spheroids and organoids without the need for sectioning [48]. These techniques, when combined with metabolic flux analysis, provide powerful correlative data linking structure and function in 3D models. Additionally, the development of more sophisticated co-culture systems that incorporate stromal components, immune cells, and vascular elements will further enhance the physiological relevance of 3D models for metabolic studies.
As these technologies mature, standardization of culture protocols and analytical methodologies will be essential for improving reproducibility and enabling broader adoption across research communities [44]. The integration of multi-omics approaches with metabolic flux analysis in 3D models holds particular promise for generating comprehensive understanding of how metabolic pathways regulate development, homeostasis, and disease processes in human tissues.
Metabolic profiling in whole-organism models provides critical insights into cellular energetics, toxicological responses, and aging mechanisms. Within the framework of Seahorse metabolic flux analysis, which measures key parameters of cellular bioenergetics in real-time [49] [26], researchers can investigate metabolic perturbations with exceptional sensitivity. This application note details methodologies and findings from metabolic studies in two pivotal model organisms: zebrafish embryos and C. elegans. These organisms offer complementary advantages for metabolic research, including genetic tractability, physiological complexity, and relevance to human disease and toxicology. We present integrated protocols and data analyses that leverage Seahorse technology and metabolomics approaches to uncover metabolic alterations in response to environmental exposures and genetic interventions.
Metabolic Profiling in Zebrafish Embryos
Protocol: Assessing Persistent Metabolic Effects of Lead Exposure
Experimental Design: Zebrafish embryos were exposed to varying concentrations of lead (Pb-acetate) for 24 hours post-fertilization (hpf), followed by 24 hours of development in Pb-free medium before harvest at 48 hpf [50]. This discontinued exposure model assesses persistent metabolic changes rather than acute effects.
Materials and Reagents:
- Zebrafish embryos (wild-type or transgenic lines)
- Lead acetate solutions (5, 15, 150, and 1500 ppb concentrations)
- Embryo medium
- Mass spectrometry-grade solvents for metabolomics
- Inductively coupled plasma mass spectrometry (ICP-MS) reagents for metal analysis
Methodology:
- Exposure Protocol: Distribute embryos into experimental groups and expose to Pb concentrations (5, 15, 150, 1500 ppb) from 0-24 hpf.
- Recovery Phase: Transfer embryos to clean embryo medium at 24 hpf and continue incubation until 48 hpf.
- Metabolite Extraction: At 48 hpf, harvest embryos and extract metabolites using methanol:acetonitrile:water solvent system.
- Metabolomic Analysis: Perform untargeted metabolomics via liquid chromatography-mass spectrometry (LC-MS).
- Metal Accumulation Assessment: Analyze Pb content via ICP-MS alongside other metals to assess specificity.
- Morphological Assessment: Document heart rate, embryo length, and developmental abnormalities at 48 hpf and 72 hpf.
Pathway Analysis: Utilize multivariate statistical methods (PCA, OPLS-DA) to identify significantly altered metabolic pathways, including biopterin, purine, alanine, and aspartate metabolism [50].
Key Findings and Data Presentation
Zebrafish embryos accumulated Pb in a dose-dependent manner, with significant metabolic perturbations observed even at the lowest exposure level (5 ppb) [50]. The following table summarizes the major metabolic findings:
Table 1: Metabolic Changes in Zebrafish Embryos After Discontinued Lead Exposure
| Pb Exposure Concentration | Pb Accumulation (pg/embryo) | Key Metabolic Alterations | Affected Pathways |
|---|---|---|---|
| 5 ppb | Significant increase | Changes in redox ratios | Biopterin metabolism, Purine metabolism |
| 15 ppb | Significant increase | Changes in redox ratios | Biopterin metabolism, Purine metabolism |
| 150 ppb | Significant increase | Changes in redox ratios | Alanine, aspartate, and glutamate metabolism |
| 1500 ppb | Highest accumulation | Normal redox ratios, distinct metabolite profile | Multiple energy metabolism pathways |
Notably, decreases in oxidation-reduction ratios were observed in the 5-150 ppb exposure groups but not in the 1500 ppb group, suggesting a hormetic effect of Pb concentrations on the developing zebrafish metabolome [50]. No significant morphological differences in heart rate or embryo length were detected, demonstrating that metabolic profiling reveals subtler changes than traditional physiological markers.
Metabolic Profiling in C. elegans
Protocol: Metabolic Analysis of FMO Mutants for Lifespan Studies
Experimental Design: This protocol utilizes C. elegans strains with mutations in flavin-containing monooxygenase (FMO) genes to investigate connections between metabolic profiles and lifespan extension [51] [52].
Materials and Reagents:
- C. elegans wild-type (N2) and mutant strains (fmo-1 KO, fmo-2 KO, fmo-2 OE, fmo-3 KO, fmo-4 KO)
- NMR spectroscopy equipment and solvents
- Nematode Growth Medium (NGM) plates
- Standard C. elegans maintenance reagents
- SYTO 24 green fluorescent nucleic acid stain
Methodology:
- Strain Maintenance: Cultivate C. elegans strains on NGM plates with E. coli OP50 as food source at 20°C.
- Sample Preparation: Synchronize populations by bleaching and collect worms at different developmental stages and ages.
- Metabolite Extraction: Harvest worms and extract metabolites using methanol-chloroform-water extraction protocol.
- NMR Analysis: Acquire 1H NMR spectra of metabolite extracts using standard pulse sequences.
- Data Processing: Process spectra using Chenomx NMR Suite or similar software for metabolite identification and quantification.
- Phenotypic Assessment: Document developmental timing, body length, egg-laying patterns, and lifespan for correlation with metabolic data.
Integrated Seahorse Analysis: For real-time metabolic flux analysis:
- Seed synchronized worms on XF96 cell culture microplates
- Measure extracellular acidification rate and oxygen consumption rate using XF96 extracellular flux analyzer
- Normalize measurements to DNA content using SYTO 24 stain [53]
Key Findings and Data Presentation
Genetic manipulation of FMO genes significantly altered C. elegans metabolomes and extended lifespan through distinct mechanisms [51] [52]. The following table summarizes the phenotypic and metabolic characteristics of FMO mutants:
Table 2: Phenotypic and Metabolic Characteristics of C. elegans FMO Mutants
| Strain/Intervention | Lifespan | Development | Key Metabolic Changes | Other Phenotypes |
|---|---|---|---|---|
| fmo-1 KO | Extended | Normal | No significant metabolite changes detected | Normal development |
| fmo-2 KO | Not reported | Delayed | Not analyzed in study | Shorter length at day 3 |
| fmo-2 OE | Extended | Normal | Increased tryptophan levels | Normal development |
| fmo-3 KO | Extended | Delayed | Increased tryptophan levels | Shorter length at day 3 |
| fmo-4 KO | Extended | Delayed | Increased tryptophan levels | Decreased embryo hatching, bleach sensitivity |
The correlation between increased tryptophan levels and lifespan extension in multiple FMO mutants (fmo-2 OE, fmo-3 KO, fmo-4 KO) suggests a potential mechanism linking tryptophan metabolism to longevity [51]. Interestingly, fmo-1 KO extended lifespan without detectable metabolomic changes, indicating alternative mechanisms [52].
Visualizing Experimental Workflows and Metabolic Relationships
Zebrafish Lead Exposure Metabolomics Workflow
C. elegans FMO Metabolic Pathways in Lifespan
The Scientist's Toolkit: Essential Research Reagents and Solutions
Table 3: Key Research Reagents for Whole-Organism Metabolic Profiling
| Reagent/Equipment | Application | Specific Function | Example Use Cases |
|---|---|---|---|
| XF96 Extracellular Flux Analyzer | Seahorse metabolic flux analysis | Real-time measurement of OCR and ECAR in live cells and organisms | C. elegans metabolic profiling [53], mitochondrial function assessment [26] |
| NMR Spectroscopy | Metabolomics | Quantitative measurement of metabolite profiles in tissue extracts | C. elegans FMO mutant metabolomics [51], aging studies |
| LC-MS Systems | Untargeted metabolomics | Global identification and quantification of metabolites | Zebrafish Pb exposure metabolomics [50] |
| ICP-MS | Metal analysis | Precise quantification of metal accumulation in biological samples | Pb burden assessment in zebrafish embryos [50] |
| Transgenic Zebrafish Lines | In vivo bioassays | Tissue-specific expression of reporter genes (e.g., cyp3a65) | Intestinal metabolic endocrine disruption assessment [54] |
| C. elegans FMO Mutants | Genetic studies | Investigation of gene function in metabolism and aging | Lifespan extension mechanisms [51] [52] |
| Glycolysis Stress Test Kit | Seahorse assays | Sequential measurement of glycolytic function | C. elegans energy metabolism [53] |
| Mito Stress Test Kit | Seahorse assays | Comprehensive assessment of mitochondrial respiration | C. elegans mitochondrial function [53] |
Whole-organism metabolic profiling in zebrafish embryos and C. elegans provides powerful insights into metabolic regulation, toxicological mechanisms, and aging processes. The integration of Seahorse metabolic flux analysis with comprehensive metabolomics approaches enables researchers to connect cellular bioenergetics with broader metabolic network alterations. These protocols demonstrate that metabolic perturbations often precede morphological changes, offering sensitive biomarkers for environmental exposure and genetic interventions. The conserved biological pathways uncovered in these model organisms provide valuable insights relevant to human health, toxicology, and aging research.
The study of cellular energetics is a cornerstone of modern biological research, providing critical insights into physiological functions and disease mechanisms. The Agilent Seahorse XF Analyzer has emerged as an industry standard for profiling cellular metabolism in real-time, simultaneously measuring the Oxygen Consumption Rate (OCR) and Extracellular Acidification Rate (ECAR) to assess mitochondrial respiration and glycolytic activity, respectively [16] [26]. Despite its robustness, a significant limitation of traditional metabolic flux assays has been the challenge of effective data normalization and the inability to concurrently capture multidimensional mitochondrial properties.
To address these limitations, researchers have developed an integrated platform that couples the Seahorse metabolic flux assay with high-content fluorescence imaging [16]. This powerful combination enables the acquisition of a richer dataset from a single experiment, transforming a standard bioenergetic profile into a multi-parameter analysis that includes normalization data, cell cycle distribution, and key mitochondrial functional and morphological parameters. This Application Note details the methodology and experimental protocols for implementing this integrated approach, framed within the broader context of advancing cellular energetics research.
The Integrated Platform: Principles and Workflow
The integrated platform enhances the standard metabolic flux assay by incorporating a suite of fluorescent dyes immediately following the kinetic measurements. This allows for the direct correlation of bioenergetic data with cellular and mitochondrial features visualized through high-content imaging.
Core Measurable Parameters
The parameters quantified through this combined approach are summarized in the table below.
Table 1: Core Parameters Measured in the Integrated Metabolic Flux and Imaging Assay
| Parameter Category | Specific Measurable Parameters | Measurement Technique |
|---|---|---|
| Bioenergetic Flux | Oxygen Consumption Rate (OCR) | Seahorse XF Analyzer [16] [20] |
| Extracellular Acidification Rate (ECAR) | Seahorse XF Analyzer [16] [20] | |
| ATP Production Rates (Glycolytic & Mitochondrial) | Calculated from OCR/ECAR after inhibitor injections [20] | |
| Normalization & Cell Cycle | Cell Number | High-content imaging of Hoechst-stained nuclei [16] |
| Cell Cycle Distribution | High-content imaging of Hoechst-stained nuclei [16] | |
| Mitochondrial Properties | Mitochondrial Content & Morphology | Fluorescence imaging with MitoTracker Red [16] |
| Mitochondrial Fragmentation State | Analysis of MitoTracker Red signal morphology [16] | |
| Mitochondrial Membrane Potential (ΔΨm) | Fluorescence imaging with TMRE dye [16] | |
| Mitochondrial Reactive Oxygen Species (mtROS) | Fluorescence imaging with MitoSOX Red dye [16] |
Experimental Workflow Logic
The following diagram illustrates the sequential and integrated nature of the assay, showing how kinetic measurements and endpoint imaging are combined.
Detailed Experimental Protocol
This protocol is optimized for adherent mammalian cells, such as cancer cell lines, cultured in a Seahorse XF96-well plate.
Pre-Assay Preparation
Materials Required:
- Agilent Seahorse XF Pro Analyzer [55] [20]
- Seahorse XF96 FluxPak: Includes sensor cartridge and cell culture microplate [20]
- Seahorse XF Assay Medium: DMEM or RPMI, without serum or bicarbonate [20]
- Substrate Solutions: 1.0 M Glucose, 100 mM Pyruvate, 200 mM Glutamine [20]
- Mitochondrial Stress Test Inhibitors: Oligomycin, FCCP, Rotenone/Antimycin A [16] [20]
- Fluorescent Dyes: Hoechst 33342, MitoTracker Red CMXRos, TMRE, MitoSOX Red [16]
- Cytation5 Cell Imaging Multi-Mode Reader or equivalent high-content imager [16]
Day 1: Cell Seeding
- Harvest and count cells. Prepare a single-cell suspension.
- Seed cells in the XF96-well plate in complete growth medium. Critical: Seed cells only in the interior 60 wells to avoid the "edge effect," which causes uneven cell distribution and artifactual OCR measurements in perimeter wells [16].
- Incubate the plate overnight at 37°C with 5% CO₂.
Day 2: Metabolic Flux Assay and Staining
Part A: Seahorse XF Assay Setup
- Prepare Assay Medium: On the day of the assay, supplement Seahorse XF Base Medium with 10 mM Glucose, 1 mM Pyruvate, and 2 mM Glutamine. Warm to 37°C [20].
- Hydrate Sensor Cartridge: Add Seahorse XF Calibrant to the sensor cartridge and incubate in a non-CO₂ incubator at 37°C for at least 45 minutes [20].
- Cell Preparation:
- Carefully remove the cell culture growth medium from the XF96 plate.
- Gently wash the cells twice with the pre-warmed, supplemented assay medium.
- Add 180 µL of assay medium to each well.
- Incubate the cell plate in a non-CO₂ incubator at 37°C for 45-60 minutes to allow temperature and pH equilibration.
Part B: Mitochondrial Stress Test Execution
- Load the prepared mitochondrial inhibitors into the designated ports of the hydrated sensor cartridge:
- Start the pre-programmed assay on the Seahorse XF Analyzer. The instrument will sequentially measure baseline OCR/ECAR and after each drug injection.
Part C: Integration of Fluorescent Staining
- Prepare Dye Cocktail: Following the completion of the kinetic measurements, prepare a cocktail of fluorescent dyes in the assay medium. The final working concentrations are typically:
- Hoechst 33342 (for nuclei): 1-5 µg/mL
- MitoTracker Red (for mass): 50-200 nM
- TMRE (for membrane potential): 100-500 nM
- MitoSOX Red (for mtROS): 2-5 µM [16]
- Inject Dyes: Use the fourth, unused injection port on the sensor cartridge to deliver the dye cocktail to the cells.
- Incubate and Wash: Incubate the plate for 15-30 minutes at 37°C to allow dye uptake. Subsequently, wash the cells gently with fresh assay medium to reduce background fluorescence.
High-Content Imaging and Data Analysis
- Image Acquisition: Place the plate in the Cytation5 imager or equivalent. Acquire images using appropriate fluorescence channels for each dye (e.g., DAPI for Hoechst, TRITC for MitoTracker Red and TMRE) [16] [55].
- Image Analysis:
- Use the nuclear (Hoechst) mask to automatically count cell numbers for accurate normalization of OCR/ECAR data [16].
- Quantify mitochondrial content, morphology, and fluorescence intensity of functional probes (TMRE, MitoSOX) in a constrained region around each nucleus (e.g., 10 µm from the nuclei mask) to ensure single-cell resolution [16].
- Data Integration: Normalize all bioenergetic data (OCR, ECAR) to cell number. Correlate these kinetic parameters with the quantitative imaging data (e.g., mitochondrial content, membrane potential) for a comprehensive metabolic and functional profile.
The Scientist's Toolkit: Essential Research Reagents
The following table lists key reagents and their critical functions for successfully executing the integrated assay.
Table 2: Essential Research Reagent Solutions for Integrated Metabolic Flux and Imaging
| Reagent / Kit Name | Function in the Assay | Key Utility |
|---|---|---|
| Seahorse XF Real-Time ATP Rate Assay Kit | Quantifies glycolytic and mitochondrial ATP production rates in real-time. | Provides a direct measure of energetic contribution from two major pathways [20]. |
| Mitochondrial Stress Test Kit | Contains inhibitors to probe distinct aspects of mitochondrial electron transport chain function. | Reveals parameters like basal respiration, ATP-linked respiration, and spare respiratory capacity [16] [20]. |
| Hoechst 33342 | Cell-permeant nuclear counterstain. | Enables accurate cell counting for data normalization and analysis of cell cycle distribution [16]. |
| MitoTracker Red CMXRos | Cell-permeant dye that accumulates in active mitochondria. | Allows quantification of mitochondrial content and analysis of network morphology/fragmentation [16]. |
| TMRE (Tetramethylrhodamine Ethyl Ester) | Cell-permeant, cationic dye that accumulates in active mitochondria proportional to membrane potential (ΔΨm). | Reports on the energetic and functional status of the mitochondrial membrane [16]. |
| MitoSOX Red | Mitochondria-targeted superoxide indicator. | Specifically detects mitochondrial reactive oxygen species (mtROS), a key signaling molecule and stress marker [16]. |
Application Insights and Data Interpretation
The power of this integrated approach is demonstrated by its application in challenging biological models. For instance, in pancreatic cancer cells, this method was used to dissect the mitochondrial functional roles of master regulatory proteins like PGC1α and PRC1, linking specific bioenergetic deficits to changes in mitochondrial content and function [16]. Furthermore, the platform has revealed novel insights, such as the role of Rho-GTPases in regulating mitochondrial dynamics and respiratory capacity in breast cancer cells—a finding that was not apparent from bioenergetic or imaging data alone [16].
The diagram below outlines the logical flow of data integration and interpretation, moving from raw data acquisition to biological insight.
Key Correlation Analyses:
- OCR vs. Mitochondrial Content: Distinguish between changes in respiratory capacity per mitochondrion versus changes driven by the total mitochondrial mass.
- ATP-linked Respiration vs. ΔΨm (TMRE): Assess the coupling efficiency between the proton motive force and ATP synthesis.
- Spare Respiratory Capacity vs. mtROS (MitoSOX): Evaluate the link between a cell's ability to respond to energy demand and the associated oxidative stress.
The integration of metabolic flux analysis with high-content fluorescence imaging represents a significant advancement in the toolkit for cellular energetics research. This multi-parameter approach moves beyond standalone techniques to provide a synchronized, comprehensive profile of cellular metabolism and mitochondrial function within a single, controlled experiment. The detailed protocol outlined in this Application Note provides a framework for researchers to implement this powerful strategy, enabling deeper insights into the metabolic underpinnings of cancer, immunology, and other fields where cellular energetics play a decisive role.
Optimizing Experimental Outcomes: Critical Troubleshooting and Normalization Strategies
In cellular energetics research, accurate assessment of metabolic flux using Seahorse technology relies heavily on proper cell preparation and plating. The fundamental distinction between adherent and suspension cells presents unique challenges and considerations for researchers investigating mitochondrial respiration and glycolytic function. Adherent cells require attachment to a surface for growth, characteristic of cells derived from solid tissues, while suspension cells grow freely floating in culture media, typically derived from hematopoietic lineages [56].
Understanding these differences is crucial not only for cell culture but also for ensuring data quality in metabolic flux analysis. Recent investigations have revealed that adherent and suspension cells demonstrate different metabolic profiles, with some studies suggesting adherent cells show greater dependence on lactic fermentation and glycolytic turnover, while suspension cells may exhibit higher mitochondrial activity [12]. This application note provides detailed protocols and optimization strategies for preparing both cell types specifically for Seahorse metabolic flux analysis, framed within the context of cellular energetics research.
Fundamental Differences Between Adherent and Suspension Cells
Biological and Practical Distinctions
The core difference between adherent and suspension cells lies in their growth requirements, which directly impact experimental design for metabolic studies. Adherent cells, including epithelial, fibroblast, and endothelial cells, necessitate attachment to treated plastic, glass, or extracellular matrix coatings to receive signals essential for survival and function [56]. This anchorage dependence closely mimics in vivo conditions, making adherent cells ideal for studies requiring structured growth and cell-to-cell interactions.
In contrast, suspension cells—such as blood cells, immune cells, and certain adapted cell lines like CHO and HEK293—proliferate freely in liquid medium without surface attachment [56]. This characteristic offers significant advantages in scalability but presents distinct challenges for assays requiring immobilized cells, such as Seahorse analysis.
Table 1: Key Characteristics of Adherent vs. Suspension Cells
| Characteristic | Adherent Cells | Suspension Cells |
|---|---|---|
| Growth Requirement | Requires surface attachment | Grows freely in suspension |
| Common Examples | Epithelial cells, fibroblasts, endothelial cells | Blood cells, immune cells, CHO, HEK293 |
| Scalability | Limited by surface area | Highly scalable in bioreactors |
| Passaging Method | Enzymatic detachment (trypsin, TrypLE) [57] | Direct dilution or centrifugation |
| Metabolic Profile | More dependent on glycolytic turnover [12] | Higher mitochondrial activity [12] |
| Common Applications | Regenerative medicine, cancer research, tissue engineering [56] | Biopharmaceutical production, immunology research [56] |
Metabolic Implications for Energetics Research
The distinction between adherent and suspension cultures extends to fundamental metabolic differences that directly impact Seahorse analysis interpretation. Research indicates that the non-adherent state is associated with higher mitochondrial activity, while adherent cells appear more dependent on lactic fermentation and glycolytic pathways [12]. Suspension cells may also demonstrate decreased glycolytic reserve, reflecting a reduced ability to compensate for increased energy demand through glycolysis [12]. These inherent metabolic differences underscore the importance of cell-type-specific optimization in preparation and plating protocols for accurate metabolic phenotyping.
Cell Preparation Protocols
Adherent Cell Preparation
Proper preparation of adherent cells is critical for obtaining reliable Seahorse data. The following protocol outlines the optimal procedure for subculturing and plating adherent cells specifically for metabolic flux analysis:
Pre-assay Monitoring: Routinely monitor cell viability prior to subculturing. Cells should be passaged at log phase with viability greater than 90% at the time of subculturing [57].
Media Removal and Washing: Remove and discard spent cell culture media from the culture vessel. Wash cells using a balanced salt solution without calcium and magnesium (approximately 2 mL per 10 cm² culture surface area). Add wash solution to the side of the vessel opposite the attached cell layer to avoid disruption. This step removes traces of serum, calcium, and magnesium that would inhibit dissociation reagent action [57].
Cell Detachment: Add pre-warmed dissociation reagent such as trypsin or TrypLE to the side of the flask, using enough reagent to cover the cell layer (approximately 0.5 mL per 10 cm²). Gently rock the container to ensure complete coverage [57].
Incubation and Monitoring: Incubate the culture vessel at room temperature for approximately 2 minutes (actual time varies with cell line). Observe cells under microscope for detachment. If less than 90% detached, increase incubation time incrementally, checking every 30 seconds. Tapping the vessel may expedite detachment [57].
Neutralization and Collection: When ≥90% of cells have detached, add the equivalent of 2 volumes of pre-warmed complete growth medium. Disperse medium by pipetting over the cell layer surface several times. Transfer cells to a conical tube and centrifuge at 200 × g for 5-10 minutes [57].
Resuspension and Counting: Resuspend the cell pellet in a minimal volume of pre-warmed complete growth medium and remove a sample for counting. Determine total cell number and percent viability using a hemocytometer with Trypan blue exclusion or an automated cell counter [57].
Suspension Cell Immobilization
For suspension cells, proper immobilization is essential for Seahorse analysis. The following protocol describes an optimized approach using adhesive compounds:
Coating Preparation: Prepare coating solutions of Poly-D-Lysine (PDL) or Poly-L-Lysine (PLL) at 50 μg/mL in distilled water. Add an appropriate volume to cover the well surface of the Seahorse microplate (typically 50 μL per well for a 96-well plate) [33].
Plate Coating: Incubate the coating solution in the Seahorse microplate at room temperature for at least 1 hour. Following incubation, remove the coating solution and allow the plate to air dry completely in a sterile environment [33].
Cell Preparation: Count suspension cells and adjust concentration to the desired density based on optimization experiments. For PBMCs, densities between 100,000-400,000 cells per well are typically appropriate [33].
Cell Plating: Plate cells in the pre-coated Seahorse microplate in a minimal volume of appropriate assay medium. Centrifuge the plate at 200 × g for 5 minutes with low braking to sediment cells onto the coated surface without excessive force [33].
Pre-assay Incubation: Incubate the plated cells in a non-CO₂ incubator at 37°C for 15-30 minutes to allow initial attachment before commencing the Seahorse assay [33].
Optimization Strategies for Seahorse Analysis
Cell Density Optimization
Determining the optimal cell density is crucial for obtaining high-quality Seahorse data. Insufficient cells yield low signal-to-noise ratios, while over-confluent wells can limit nutrient availability and gas exchange. The table below summarizes recommended seeding densities for various cell types:
Table 2: Recommended Cell Seeding Densities for Seahorse Assays
| Cell Type | Recommended Density | Plate Format | Normalization Method |
|---|---|---|---|
| Standard Adherent (e.g., HEK293) | 20,000-50,000 cells/well | 96-well | Cell number or protein content [12] |
| Primary Adherent (e.g., Fibroblasts) | 15,000-30,000 cells/well | 96-well | Cell number [12] |
| Suspension (PBMCs) | 100,000-400,000 cells/well | 96-well | Cell number [33] |
| Adapted Suspension (e.g., CHO) | 25,000-60,000 cells/well | 96-well | Cell number or protein content [12] |
Coating Substrate Selection
For immobilizing suspension cells, coating substrate selection significantly impacts attachment quality and metabolic function. Research comparing PDL and PLL for PBMC immobilization found no statistical difference in their effectiveness for Seahorse Mito Stress tests [33]. Both compounds create a positively charged surface that enhances electrostatic interactions with negatively charged cell membranes. The choice between them may depend on cell type-specific requirements and availability:
- Poly-D-Lysine (PDL): Resistant to cellular proteases, making it preferred for longer experiments [33]
- Poly-L-Lysine (PLL): Effective alternative when already available in laboratory settings [33]
Media and Assay Condition Considerations
Proper media formulation is essential for accurate metabolic measurements:
Assay Medium Selection: Use Seahorse XF RPMI or DMEM medium supplemented with 10 mM glucose, 1 mM pyruvate, and 2 mM glutamine [12] [33]
Serum Considerations: Serum-free conditions are preferred to minimize acidification from serum components and improve assay reproducibility [12]
pH Stabilization: Equilibrate assay medium in a non-CO₂ incubator at 37°C for at least 30-45 minutes before assay initiation to ensure proper pH stabilization [12]
Experimental Workflow
The following diagram illustrates the comprehensive workflow for preparing and analyzing both adherent and suspension cells using Seahorse technology:
Figure 1: Comprehensive workflow for adherent and suspension cell preparation and analysis via Seahorse technology
The Scientist's Toolkit
Essential Research Reagent Solutions
Successful Seahorse analysis requires specific reagents and materials optimized for each cell type. The following table details essential components:
Table 3: Essential Research Reagents for Seahorse Metabolic Flux Analysis
| Reagent/Material | Function | Adherent vs. Suspension Application | Example Products |
|---|---|---|---|
| Dissociation Reagents | Enzymatically detaches adherent cells from culture surface | Adherent cells only | Trypsin, TrypLE [57] |
| Coating Substrates | Promotes cell adhesion to Seahorse plate surface | Primarily suspension cells | Poly-D-Lysine, Poly-L-Lysine [33] |
| Seahorse Assay Media | Provides optimized environment for metabolic measurements | Both cell types | XF RPMI Medium, XF DMEM Medium [12] [33] |
| Metabolic Modulators | Inhibits specific metabolic pathways for flux measurements | Both cell types | Oligomycin, FCCP, Rotenone/Antimycin A [12] |
| Cell Counting Reagents | Determines cell density and viability for normalization | Both cell types | Trypan Blue, Automated cell counters [57] |
| Seahorse FluxPak | Specialized plates and sensor cartridges for assay | Both cell types | XFe96/XF Pro FluxPak [12] [33] |
Data Normalization and Quality Control
Normalization Strategies
Appropriate data normalization is essential for accurate interpretation of Seahorse results. Two primary methods are recommended:
Cell Number Normalization: Following the assay, normalize OCR and ECAR values to actual cell count determined through parallel plating or post-assay counting [12]. This approach is particularly suitable for homogeneous cell populations.
Protein Content Normalization: As an alternative, normalize metabolic parameters to total protein content measured by spectrophotometric methods such as Bradford or BCA assays [12]. This method is advantageous for heterogeneous cell populations or when precise cell counting is challenging.
Quality Control Measures
Implementing robust quality control measures ensures reproducible and reliable data:
Viability Assessment: Maintain cell viability >90% throughout preparation procedures [57]. Reduced viability significantly impacts metabolic measurements through release of metabolic enzymes from dying cells.
Attachment Verification: For suspension cells, visually confirm uniform attachment following centrifugation and incubation steps. Incomplete attachment may result in cell loss during assay medium exchanges [33].
Baseline Stability: Ensure stable baseline OCR and ECAR measurements before compound injections. Excessive drift (>10-15% between baseline measurements) may indicate poor cell condition or improper assay conditions.
Optimizing cell preparation and plating protocols for adherent versus suspension cells is fundamental to success in Seahorse metabolic flux analysis. The distinct biological requirements and metabolic characteristics of each cell type necessitate tailored approaches throughout experimental workflows. By implementing the detailed protocols, optimization strategies, and quality control measures outlined in this application note, researchers can generate more reliable and reproducible data in cellular energetics research. As the field advances, continued refinement of these methodologies will further enhance our understanding of metabolic regulation in health and disease.
In cellular energetics research, particularly in Seahorse metabolic flux analysis, the accuracy of final data is fundamentally dependent on the initial cell number. Inconsistent cell seeding leads to significant variability in Oxygen Consumption Rate (OCR) and Extracellular Acidification Rate (ECAR) measurements, directly impacting the interpretation of mitochondrial function and glycolytic flux. This application note details the challenges associated with cell counting normalization and provides robust, fluorescence-based protocols to overcome them, ensuring that metabolic data are both reliable and reproducible for critical decision-making in drug development.
The Core Challenge: Traditional Cell Counting and Normalization Variability
The foundational step of normalizing cell number per well is a major source of experimental noise. Manual cell counting using a hemocytometer and trypan blue exclusion is notoriously time-consuming and subject to user bias and pipetting errors [58]. These inconsistencies in the initial cell suspension concentration result in uneven confluency across assay wells. In Seahorse assays, this variability manifests as high well-to-well coefficient of variation (%CV) in basal OCR/ECAR and compromises the sensitivity required to detect subtle metabolic phenotypes or the effects of therapeutic compounds. Automated cell counters address some issues, but challenging samples—such as aggregated cells, co-cultures, or those treated with cytotoxic agents—require more sophisticated solutions [59] [58].
Advanced Solutions: Fluorescence-Based Methods for Superior Normalization
Fluorescence-based cell counting and analysis move beyond simple viability assessment, offering high specificity for complex samples. These methods utilize fluorescent cellular stains or fluorescently tagged cells to distinguish specific cell types or states within a heterogeneous population [59].
Research Reagent Solutions for Fluorescence-Based Analysis
The table below summarizes key reagents and their applications in advanced cell analysis.
Table 1: Essential Research Reagents for Fluorescence-Based Cell Analysis
| Reagent / Assay | Primary Function | Application in Normalization & Metabolic Studies |
|---|---|---|
| ReadyCount Green/Red Viability Stain (AO/PI) [59] | Stains nucleated cells (acridine orange, green) and dead cells (propidium iodide, red). | Provides sensitive and specific viability counts in difficult samples like PBMCs, where trypan blue can alter morphology. |
| Annexin V Assay [58] | Detects phosphatidylserine exposure on the outer leaflet of the plasma membrane. | Identifies early-to-mid stage apoptotic cells, which should be accounted for in normalization as they exhibit altered metabolism. |
| CellEvent Caspase-3/7 Green Detection Reagent [59] | Detects activated caspases-3 and 7, key enzymes in apoptosis. | Used with a viability dye (e.g., SYTOX Red) to multiplex and quantify apoptotic cells for accurate normalization of viable cells in an assay. |
| Mitochondrial Potential Assay (JC-1) [58] | Measures the collapse of the mitochondrial membrane potential. | Flags cells in early apoptosis and provides a direct functional readout of mitochondrial health, complementing OCR data. |
| GFP Transfection Efficiency Assay [58] | Quantifies the percentage of cells expressing a green fluorescent protein reporter. | Critical for normalizing metabolic data from transfection or transduction experiments where only a fraction of cells express the gene of interest. |
| Hoechst 33342 / DAPI [59] [58] | Stains DNA in all nucleated cells. | Used as a universal stain for total cell count in fluorescence-based automated counters. |
| Cell Cycle Analysis Lysis Buffer [58] | Lyses cells and stains nuclear DNA content. | Allows for normalization based on cell cycle distribution, as metabolic flux can vary significantly across phases. |
Detailed Experimental Protocols
Protocol 1: Normalized Cell Seeding for Seahorse Assay using Fluorescent Viability Staining
This protocol uses an automated fluorescence cell counter (e.g., Countess 3 FL or NucleoCounter NC-3000) and AO/PI staining to achieve highly consistent cell seeding [59] [58].
Workflow Overview:
Materials:
- Instrument: Countess 3 FL Automated Cell Counter (or equivalent) [59]
- Consumables: Countess Cell Counting Chamber Slides [59]
- Reagents: ReadyCount Green/Red Cell Viability Stain (or equivalent AO/PI stain) [59]
- Cells: Your cell line of interest
- Standard Cell Culture Reagents: Trypsin/EDTA, complete growth medium, Seahorse microplate
Step-by-Step Method:
- Harvest & Suspend: Harvest cells according to standard laboratory practice. Prepare a single-cell suspension in a culture medium compatible with your staining reagent. Gently homogenize the sample to minimize cell aggregation.
- Stain Cells: Mix 10 µL of the cell suspension with 10 µL of ReadyCount Green/Red Viability Stain (or prepared AO/PI solution) by gentle pipetting [59].
- Load and Count: Pipet 10 µL of the stained cell solution into a counting chamber slide and insert it into the automated cell counter. Select the appropriate fluorescence application (e.g., "Viability with AO/PI").
- Record Data: The instrument will automatically report the total nucleated cell concentration (cells/mL) and percent viability. Record both values.
- Calculate Seeding Volume:
- Viable Cell Concentration = Total Cell Concentration × (% Viability / 100)
- Volume to Seed (µL) = (Target Cell Number per Well) / Viable Cell Concentration
- Seed Cells: Dilute the required volume of cell suspension in the appropriate assay medium to the final volume needed for each well. Seed the cells evenly across the well. Include several background correction wells without cells.
- Quality Control: After cells have adhered, visually inspect each well under a microscope to confirm uniform confluency and the absence of clumps before commencing the Seahorse assay.
Protocol 2: Multiplexed Apoptosis Detection for Metabolic Data Normalization
This protocol uses the NucleoCounter NC-3000 system to identify apoptotic cells, allowing for the normalization of metabolic flux data to the population of healthy, viable cells [58].
Workflow Overview:
Materials:
- Instrument: NucleoCounter NC-3000 with FlexiCyte module [58]
- Assays: Apoptosis assay kits (e.g., Annexin V, caspase 3/7, JC-1) and a compatible viability dye (e.g., PI or SYTOX Red) [58]
Step-by-Step Method:
- Treat and Harvest: Expose cells to the experimental condition (e.g., chemotherapeutic agent). After the desired incubation time, harvest the cells.
- Stain for Apoptosis and Viability: Follow the manufacturer's protocol for the selected apoptosis assay. For example, stain cells with Annexin V conjugated to a fluorophore (e.g., FITC, detected with a GFP light cube) and a viability dye like propidium iodide (PI, detected with a Texas Red or RFP light cube) [59] [58].
- Acquire Data: Load the stained sample into the NC-3000 and run the predefined apoptosis application. The instrument will capture fluorescence images and generate scatter plots.
- Analyze Populations: Using the accompanying software (NucleoView), set gates to distinguish cell populations:
- Viable Cells: Annexin V negative / PI negative.
- Early Apoptotic: Annexin V positive / PI negative.
- Late Apoptotic/Necrotic: Annexin V positive / PI positive.
- Normalize Metabolic Data: After running the Seahorse assay on a parallel plate, apply a normalization factor to the OCR/ECAR data based on the percentage of viable, non-apoptotic cells determined in this assay.
Data Presentation and Analysis
Impact of Normalization on Seahorse Assay Data Quality
The following table summarizes how different counting methods affect key parameters in a typical Seahorse XF Assay, illustrating the value of advanced fluorescence methods.
Table 2: Comparison of Cell Counting Methodologies and Their Impact on Seahorse Assay Outcomes
| Methodology | Reported Outputs | Typical Assay Time | Key Advantages | Impact on Seahorse Data Quality |
|---|---|---|---|---|
| Manual Hemocytometer [58] | Total cell concentration, viability (trypan blue). | 5-10 minutes per sample. | Low cost, readily available. | High well-to-well variability; %CV in basal OCR often >15%. Compromised detection of subtle metabolic shifts. |
| Brightfield Automated Counter [59] | Total cell concentration, viability (trypan blue), average cell diameter. | <30 seconds per sample [59]. | Faster, reduced user bias. | Improved over manual counts, but struggles with complex samples (e.g., PBMCs, aggregates), leading to inconsistent seeding. |
| Fluorescence Automated Counter (Basic Viability) [59] [58] | Total nucleated cell concentration, viable cell concentration, viability (%) (e.g., with AO/PI). | <30 seconds to 3 minutes [59] [58]. | Specificity for nucleated cells; more accurate viability in difficult samples. | Lower well-to-well %CV (<10%); more reliable and reproducible basal metabolic rates. |
| Advanced Fluorescence Cytometry (Multiplexed) [58] | Viable, apoptotic (early/late), necrotic, and transfected cell subpopulations. | 3-5 minutes per sample. | Multiplexing capability; deep phenotypic insight. | Enables normalization to true healthy cell count, revealing drug effects masked by cell death in other methods. |
Robust normalization is not merely a preliminary step but a critical determinant of success in Seahorse metabolic flux analysis. Transitioning from traditional, variable counting methods to modern fluorescence-based techniques directly addresses the core challenge of normalization. By implementing the detailed protocols for fluorescence-based viability and apoptosis assessment, researchers can significantly reduce data variability, enhance sensitivity, and generate more biologically relevant interpretations of cellular energetics. This rigorous approach is essential for confident decision-making in foundational research and drug development pipelines.
Within the framework of a broader thesis on Seahorse metabolic flux analysis for cellular energetics research, this application note addresses three critical technical artifacts. The Agilent Seahorse XF Analyzer has emerged as an industry standard for assessing the bioenergetic state of cells in vitro, providing real-time, simultaneous measurements of the Oxygen Consumption Rate (OCR) and Extracellular Acidification Rate (ECAR) as proxies for mitochondrial respiration and glycolysis, respectively [26] [1]. The sensitivity of this technology to discrete changes in cellular bioenergetics makes it indispensable for studying cell signaling, proliferation, activation, and toxicity [60]. However, the reliability of the data is highly dependent on meticulous experimental design and execution. This document provides detailed protocols and evidence-based strategies to mitigate the confounding effects of physical edge phenomena, compromised cellular barrier integrity, and suboptimal media composition, ensuring the generation of physiologically relevant and reproducible metabolic profiles.
Technical Artifact 1: Edge Effects
Definition and Impact on Seahorse XF Data
Edge effects refer to artifacts arising from wells at the perimeter of a microplate. In Seahorse XF assays, these effects are particularly pronounced due to the instrument's measurement of oxygen concentration in a microchamber close to the center of the well [16]. During plate preparation, centrifugation steps can cause cells in perimeter wells to migrate and accumulate at the well walls. This uneven distribution leads to a lower effective cell density in the central measurement zone, resulting in an artifactual reduction in the measured OCR [16]. One study demonstrated that this phenomenon produces systematic discrepancies in OCR values when comparing edge wells to interior wells, compromising data integrity and statistical power [16].
Recommended Mitigation Protocol
To minimize the impact of edge effects, researchers should adopt the following procedural safeguards:
- Utilize Interior Wells: Reserve the exterior perimeter wells of the Seahorse XF cell culture microplate for background controls (e.g., blank wells without cells). Use only the interior wells for experimental samples [16].
- Pilot Studies: When cell number or material is limited, conduct a preliminary plate map validation to quantify the extent of OCR variance between edge and interior wells for your specific cell model.
- Alternative Normalization: For assays where interior wells are insufficient, implement rigorous post-assay normalization. The integrated fluorescence imaging protocol described in Section 5 is recommended for accurate cell counting directly in the assay well [16].
Table 1: Impact of Well Position on Seahorse XF Data Normalization
| Normalization Method | Well Position | OCR Consistency | Key Observation |
|---|---|---|---|
| Cells Seeded | Edge & Interior | High Variation | Inaccurate due to edge-effect cell redistribution [16] |
| Nuclei Counting (via Imaging) | Edge & Interior | More Consistent | Corrects for seeding variance but not edge-effect measurement artifact [16] |
| Any Method | Interior Wells Only | Most Consistent | Avoids the physical artifact of uneven cell distribution in edge wells [16] |
Visualization of the Edge Effect Artifact
The following diagram illustrates the cause of the edge effect and the recommended mitigation strategy.
Technical Artifact 2: Cell Monolayer Integrity
Relevance to Seahorse XF Assays
Cell monolayers, particularly in models of epithelia and endothelia, form semipermeable barriers that are crucial for compartmentalization. The integrity of these monolayers is a hallmark of proper cellular function and differentiation [61]. In Seahorse XF assays, a compromised monolayer can lead to erroneous metabolic readings. For instance, damage or incomplete junction formation can alter the local extracellular environment in the microchamber by allowing uncontrolled flux of ions, metabolites, and protons, which directly interferes with the accurate measurement of OCR and ECAR [61]. Furthermore, studies investigating the metabolic profile of barrier-forming tissues in pathophysiological states (e.g., cancer, inflammation) require validated in vitro models where barrier function is intact and quantifiable [61] [62].
Methods for Integrity Assessment
It is critical to verify monolayer integrity independently prior to or in parallel with Seahorse XF assays. The two primary quantitative methods are:
- Macromolecular Tracer Flux Assays: This technique measures the passive movement of a fluorescently-labeled molecule, such as FITC-dextran, across a cell monolayer grown on a transwell insert [61]. An increase in the flux rate from the apical to the basolateral compartment is a direct indicator of increased paracellular permeability and reduced barrier integrity [61].
- Transepithelial/Endothelial Electrical Resistance (TEER/TER): TEER is a gold standard, label-free method that measures the electrical resistance across a monolayer, which reports the tightness of intercellular junctions, particularly tight junctions [61] [63]. A high TEER value indicates a tight, intact barrier.
Advanced techniques like Electrochemical Impedance Spectroscopy (EIS) extend beyond TEER by providing additional parameters such as Transepithelial Capacitance (TEC), which can offer insights into membrane-specific properties and cell volume [63].
Integrated Protocol: Validating Monolayer Integrity for Metabolism Studies
This protocol outlines how to culture and validate Caco-2 cells, a common model for the intestinal epithelium, prior to Seahorse XF analysis.
- Cell Culture and Seeding:
- Seed Caco-2 cells at a high density (e.g., 100,000 - 200,000 cells per insert) onto collagen-coated polyester or polycarbonate transwell inserts (e.g., 0.4 μm pore size) placed in a multiwell plate [61] [62].
- Culture the cells for at least 14-21 days to allow for full differentiation and the formation of robust tight junctions, changing the medium every 2-3 days [62].
- TEER Measurement:
- Use a voltohmmeter or an EIS system. Measure the resistance of the monolayer. Subtract the resistance of a blank insert (with coating but no cells) to calculate the net TEER.
- Acceptance Criterion: Proceed to Seahorse analysis only when TEER values exceed 500 Ω·cm², a common benchmark for mature Caco-2 monolayers [63]. EIS can provide a more accurate TER value without the need for background subtraction [63].
- Tracer Flux Validation (Optional Parallel Assay):
- Add a fluorescent tracer (e.g., 10-40 kDa FITC-dextran) to the apical compartment.
- After an incubation period (e.g., 1-2 hours), collect samples from the basolateral compartment and measure fluorescence with a microplate reader [61].
- Acceptance Criterion: A low permeability coefficient for the tracer confirms intact barrier function.
Table 2: Key Reagents for Monolayer Integrity Assessment
| Reagent / Material | Function in Protocol | Example & Notes |
|---|---|---|
| Transwell Inserts | Physical support for polarized cell growth and permeability assays | Polycarbonate (PC) or Polyester (PE), 0.4 μm pore [61] |
| Extracellular Matrix | Coats insert to promote cell adhesion, spreading, and differentiation | Collagen Type I/IV, Fibronectin, Gelatin [61] |
| FITC-Dextran | Fluorescent macromolecular tracer for quantifying paracellular permeability | Typically 4-40 kDa; stable, non-permeable, and not actively transported [61] |
| TEER Measurement System | Measures electrical resistance to validate tight junction formation | e.g., Epithelial Voltohmmeter, or EIS systems [63] |
Technical Artifact 3: Media Composition
Fundamental Principles
The culture medium used during the Seahorse XF assay is not merely a hydration source; it is the biochemical environment that supplies substrates for glycolysis and mitochondrial respiration [1]. Using standard culture media (e.g., DMEM with high glucose and glutamine) during the assay can mask the basal metabolic phenotype because they contain nutrients that force metabolic states. The Seahorse XF assay requires a customized, bicarbonate-free, buffered assay medium to ensure stable pH for accurate ECAR measurements and to prevent confounding acidification from dissolved CO₂ [1].
Substrate Availability and Metabolic Phenotyping
The choice of substrates in the assay medium directly determines which metabolic pathways can be interrogated.
- Glycolysis: Requires the presence of glucose. Its injection allows for the measurement of glycolytic capacity and reserve [1].
- Mitochondrial Respiration: Relies on key substrates like pyruvate and glutamine to feed the tricarboxylic acid (TCA) cycle, generating electron donors for the electron transport chain (ETC) [1].
- Fatty Acid Oxidation (FAO): To probe FAO, cells must be incubated in a substrate-limited medium and then provided with a fatty acid source such as palmitate-BSA during the assay [1].
The absence of a required substrate will lead to an underestimation of the corresponding metabolic pathway's capacity.
Standardized Media Preparation Protocol
The following workflow ensures consistent and physiologically relevant media preparation for a standard Mito Stress Test.
- Pre-Assay Preparation (24 hours prior):
- Replace the standard cell culture medium with a pre-warmed, nutrient-complete growth medium (e.g., DMEM, RPMI-1640 with 10% FBS) and incubate for 24 hours.
- Assay Medium Preparation (Day of assay):
- Use the Agilent Seahorse XF Base Medium, which is minimal and bicarbonate-free.
- Supplement the base medium as follows to create a "complete" assay medium:
- 1 mM Pyruvate
- 2 mM Glutamine
- 10 mM Glucose
- Adjust the pH to 7.4 using NaOH or HCl at 37°C to match physiological conditions.
- Cell Preparation:
- Gently wash the cells in the Seahorse XF plate with 1-2 mL of the pre-warmed, pre-pH-adjusted assay medium.
- Add the desired volume of the same assay medium to the wells (e.g., 175 μL for a 96-well plate).
- Incubate the cell culture plate in a non-CO₂ incubator at 37°C for 45-60 minutes prior to the assay to allow for temperature and pH equilibration.
A Novel Integrated Workflow: Combining Metabolic Flux with Fluorescent Imaging
To simultaneously address normalization challenges (related to edge effects and cell number) and gather deeper biological insights, a powerful integrated workflow combining Seahorse metabolic flux with high-content fluorescence imaging has been developed [16]. This protocol allows for the direct normalization of OCR and ECAR to actual cell number in each well and provides multi-parametric data on mitochondrial morphology and function from the same population of cells.
Post-Assay Fluorescent Staining and Imaging Protocol:
- Run Standard Metabolic Flux Assay: Complete the Seahorse XF assay (e.g., Mito Stress Test).
- Stain Live Cells: Via the fourth injection port of the Seahorse cartridge, inject a cocktail of fluorescent dyes directly into the wells. A typical cocktail may include:
- Hoechst 33342 (1-5 μg/mL): A nuclear stain for automated cell counting and cell cycle analysis [16].
- MitoTracker Red (50-200 nM): A dye that labels mitochondria, allowing for quantification of mitochondrial content and network fragmentation [16].
- TMRE (50-200 nM): A potentiometric dye used to measure mitochondrial membrane potential (Δψm) [16].
- MitoSOX Red (5 μM): A fluorogenic dye for detecting mitochondrial superoxide (mtROS) [16].
- Incubate and Wash: Incubate the plate for 20-30 minutes at 37°C, protected from light. Gently wash the cells with fresh PBS or assay medium.
- Image and Analyze: Image the plate using a high-content imager (e.g., Cytation5). Use automated image analysis software to segment nuclei and cytoplasm, and then quantify:
- Cell Count: For precise normalization of OCR/ECAR.
- Mitochondrial Parameters: Mean MitoTracker intensity (content), texture analysis (fragmentation), TMRE intensity (membrane potential), and MitoSOX intensity (oxidative stress) [16].
This integrated workflow reveals how mitochondrial properties (e.g., content, membrane potential) directly correlate with bioenergetic function, providing a systems-level view of cellular metabolism in a single assay.
The Scientist's Toolkit: Essential Research Reagent Solutions
Table 3: Key Research Reagent Solutions for Seahorse XF and Integrity Assays
| Reagent / Kit | Function | Application Context |
|---|---|---|
| Seahorse XF Glycolysis Stress Test Kit | Measures key parameters of glycolytic function via sequential injection of glucose, oligomycin, and 2-DG. | Pharmacological profiling of glycolytic capacity, reserve, and compensation [1]. |
| Seahorse XF Mito Stress Test Kit | Measures key parameters of mitochondrial respiration via sequential injection of oligomycin, FCCP, and rotenone/antimycin A. | In-depth analysis of ATP-linked respiration, proton leak, and maximal respiratory capacity [1]. |
| MitoTracker Probes (e.g., Red CMXRos) | Fluorescent dyes that stain live-cell mitochondria based on membrane potential, used for content and morphology. | Integrated fluorescence imaging with metabolic flux; quantifying mitochondrial network fragmentation [16]. |
| Fluorescent Tracers (e.g., FITC-Dextran) | Macromolecular probe to quantify paracellular permeability across cell monolayers. | Independent validation of epithelial/endothelial barrier integrity prior to metabolic assays [61]. |
| XF Palmitate-BSA FAO Substrate | Provides fatty acid substrate conjugated to BSA for delivery into cells during the assay. | Measuring fatty acid oxidation (FAO) metabolic pathway dependency [1]. |
| Agilent Seahorse XF Base Medium | A minimal, bicarbonate-free medium used as the base for preparing the assay medium. | Essential for maintaining stable pH during real-time ECAR and OCR measurements [1]. |
The powerful kinetic data generated by Seahorse XF analysis is only as reliable as the techniques underpinning the experiment. This application note has detailed how edge effects, monolayer integrity, and media composition are not merely peripheral concerns but central to experimental validity. By adopting the standardized protocols outlined herein—specifically, the use of interior wells, rigorous pre-validation of monolayer integrity, and careful preparation of physiologically relevant assay media—researchers can significantly reduce technical noise. Furthermore, the integration of high-content fluorescence imaging with metabolic flux presents a cutting-edge methodology that simultaneously controls for cell number and provides a richer, more holistic understanding of the intricate relationships between mitochondrial structure, barrier function, and cellular bioenergetics. Addressing these artifacts systematically is paramount for generating robust, reproducible, and meaningful data in the field of cellular metabolism.
Seahorse metabolic flux analysis is a cornerstone of modern cellular energetics research, providing real-time, dynamic measurements of key metabolic parameters in living cells. This technique is indispensable for elucidating the complex bioenergetic profiles that underpin cellular functions in health and disease. However, standard assay protocols are primarily optimized for conventional two-dimensional (2D) monolayers with robust cell numbers. The evolving landscape of biomedical research increasingly demands analysis of more physiologically relevant but technically challenging sample types, including those with low cell numbers and complex three-dimensional (3D) models. These samples—ranging from rare primary cell populations to intricate spheroids and organoids—present significant obstacles for assay adaptation, including reduced signal intensity, impaired reagent penetration, and heightened sensitivity to environmental perturbations. This application note provides detailed methodologies and structured data to enable researchers to reliably adapt Seahorse metabolic flux assays for these challenging systems, thereby extending the power of cellular energetics research into new frontiers of drug discovery and basic science.
Key Research Reagent Solutions
The following table details essential materials and reagents critical for successfully performing Seahorse metabolic flux analysis on challenging samples. [64]
Table 1: Key Research Reagent Solutions for Seahorse Metabolic Flux Analysis
| Item Name | Function/Application |
|---|---|
| Agilent Seahorse XF Pro Analyzer | An enhanced metabolic assay platform featuring improved precision and pharma-oriented workflows for real-time measurement of cellular bioenergetics in 2D and 3D cell models. [64] |
| XF Assay Media | A bicarbonate-free, serum-free medium optimized for maintaining a stable pH outside a CO~2~ environment during the assay, ensuring accurate measurement of extracellular acidification rate (ECAR). |
| Substrates (e.g., Glucose, Glutamine, Pyruvate) | Compounds provided in the assay media as fuels to support mitochondrial respiration and glycolysis. Their concentration can be adjusted to mimic specific physiological or disease states. |
| Metabolic Modulators (e.g., Oligomycin, FCCP, Rotenone/Antimycin A) | Pharmacologic agents injected from the analyzer's ports during the assay to specifically target components of the electron transport chain, enabling a detailed dissection of metabolic function. |
| Cell Matrix (e.g., Agarose, Basement Membrane Extracts) | Used for embedding 3D models like spheroids to prevent their dislodgement during assay medium exchanges and instrument movement, ensuring sample integrity. |
| XF Assay Kits (e.g., XF Glycolysis Stress Test Kit, XF Mito Stress Test Kit) | Pre-configured, standardized kits that include all necessary modulators and protocols for performing specific, well-established metabolic phenotyping assays. |
Adaptation for Low-Cell-Number Experiments
Core Challenges and Strategic Approach
Assays with low cell counts are inherently more susceptible to stochastic biological noise and analytical variability. The primary challenges include achieving a sufficient signal-to-noise ratio for the optical sensors and ensuring that the measured phenotype is representative and not skewed by the limited population. Recent research underscores that population-level metabolic behaviors can often be characterized effectively even when accounting for cell-to-cell heterogeneity, supporting the feasibility of low-cell-number assays with careful design. [65] The strategic approach involves optimizing seeding conditions, enhancing assay sensitivity, and implementing robust data normalization strategies.
Detailed Protocol for Low-Cell-Number Assays
A. Sample Preparation and Seeding
- Cell Counting and Viability Assessment: Perform precise cell counting using an automated cell counter or hemocytometer. Confirm viability exceeds 95% using Trypan Blue or similar exclusion dyes.
- Surface Coating: To promote weak adhesion and prevent dislodgement of precious samples, coat XF assay microplates with a dilute solution of poly-D-lysine (0.1 mg/mL) or Corning Cell-Tak (22.4 µg/mL in sodium bicarbonate) according to manufacturer instructions. A no-coating control is recommended.
- Precision Seeding: Seed cells in a minimal volume (e.g., 20-50 µL) to ensure a concentrated, localized cell population in the center of the well. Gently tap the plate to distribute cells evenly.
- Cell Adhesion: Allow cells to adhere for 15-30 minutes in a 37°C incubator before carefully adding an additional 150-180 µL of culture medium to bring the total volume to 200 µL. Proceed with normal culture.
B. Assay Optimization and Execution
- Background Correction: Designate at least three wells per microplate as "no-cell" background controls. These wells receive culture medium only and are used to correct for non-cellular acidification and oxygen consumption.
- Assay Medium Equilibration: On the day of the assay, carefully replace the growth medium with 180 µL of pre-warmed XF Assay Medium, pH 7.4.
- Extended Equilibration: Place the microplate in a non-CO~2~ 37°C incubator for a minimum of 60 minutes to allow for full temperature and pH equilibration.
- Analyzer Calibration: Use the Agilent Seahorse XF Pro Analyzer's calibration step with the hydrated sensor cartridge as per standard protocol. [64]
C. Data Acquisition and Normalization
- Run the Assay: Execute the predefined assay program (e.g., Mito Stress Test).
- Post-Assay Normalization: Following the assay, normalize the oxygen consumption rate (OCR) and extracellular acidification rate (ECAR) data to total protein content or DNA content per well, as cell counting is not feasible.
- Protein Normalization: Lyse cells with 0.1M NaOH, then determine protein concentration using a microplate-compatible assay like the Bicinchoninic Acid (BCA) assay.
- DNA Normalization: Lyse cells and use a fluorescent DNA-binding dye (e.g., Hoechst 33258 or PicoGreen) to quantify double-stranded DNA.
Quantitative Parameters for Low-Cell-Number Assays
The table below summarizes key parameters that require adjustment when transitioning from standard to low-cell-number assays.
Table 2: Parameter Comparison for Standard vs. Low-Cell-Number Assays
| Parameter | Standard Assay (Reference) | Low-Cell-Number Adaptation |
|---|---|---|
| Recommended Minimum Cell Seeding Density | 20,000 - 40,000 cells/well (for adherent cell lines) | 2,000 - 8,000 cells/well |
| Assay Medium Equilibration Time | 45 - 60 minutes | 60 - 90 minutes |
| Measurement Cycle Times (Mix, Wait, Measure) | Standard cycle (e.g., 2 min mix, 2 min wait, 3 min measure) | Extended cycle (e.g., 3 min mix, 2 min wait, 4 min measure) |
| Post-Assay Normalization Method | Cell count (preferred) or protein content | Protein content or DNA content (mandatory) |
| Recommended Number of Replicate Wells | 5 - 8 technical replicates | 8 - 12 technical replicates |
Low-Cell-Number Assay Workflow
Adaptation for Complex 3D Models
Core Challenges and Strategic Approach
The transition from 2D monolayers to 3D models (spheroids, organoids) introduces critical challenges related to mass transport, specifically the diffusion of nutrients, oxygen, and metabolic modulators into the core of the structure. This can create nutrient and oxygen gradients, leading to heterogeneous metabolic zones within a single sample. The key adaptation strategy involves ensuring that the assay conditions do not introduce diffusion-limited artifacts and that the measured flux rates accurately reflect the biology of the entire 3D structure.
Detailed Protocol for 3D Model Assays
A. Sample Preparation and Quality Control
- 3D Model Generation: Generate uniformly sized spheroids or organoids using your method of choice (e.g., ultra-low attachment plates, hanging drop, microfluidic devices).
- Size Selection: Prior to the assay, use a sieve or serial sedimentation to select spheroids within a narrow diameter range (recommended 100-200 µm for optimal modulator diffusion). Record the average diameter.
- Viability Staining: Optionally, perform a live/dead stain (e.g., Calcein AM/Ethidium homodimer-1) on a representative sample to confirm core viability.
- Transfer to Microplate: Gently transfer a precise number of pre-selected spheroids (e.g., 10-50 per well, depending on size) into the XF microplate. Allow them to settle.
B. Assay Medium and Modulator Optimization
- Enhanced Substrate Concentration: Consider increasing the concentration of key metabolic substrates (e.g., Glucose to 25 mM) in the XF Assay Medium to ensure saturating conditions throughout the 3D structure during the assay.
- Modulator Penetration Optimization: To ensure complete and rapid penetration of metabolic modulators:
- Increase Concentration: The stock concentration of modulators (Oligomycin, FCCP, Rotenone/Antimycin A) loaded into the drug ports can be increased by 1.5 to 2-fold compared to 2D assay recommendations.
- Validate Efficacy: Perform a pilot assay and validate modulator action by confirming the expected pharmacological response (e.g., maximal OCR after FCCP injection).
C. Assay Execution and Data Normalization
- Immobilization: To prevent spheroid movement during measurements, create a thin, inert bed of 1% agarose in XF Assay Medium at the bottom of the well before transferring spheroids.
- Equilibration and Calibration: Follow the standard 60-minute equilibration in a non-CO~2~ 37°C incubator and sensor cartridge calibration.
- Run the Assay: Execute the assay program. The mixing time may be extended to 3 minutes to ensure thorough mixing of injected modulators around the spheroids.
- Post-Assay Normalization: Following the assay, normalize OCR and ECAR data to the total spheroid volume per well or DNA/protein content.
- Volume Normalization: Calculate total volume per well using the formula: (Number of Spheroids) × (4/3πr³), where r is the average radius.
Quantitative Parameters for 3D Model Assays
The table below outlines critical adaptations for moving from 2D cultures to 3D models in Seahorse assays.
Table 3: Parameter Comparison for 2D vs. 3D Model Assays
| Parameter | 2D Monolayer Assay | 3D Model (Spheroid/Organoid) Assay |
|---|---|---|
| Sample Preparation | Trypsinization and seeding as single cells | Generation, size selection, and transfer of intact structures |
| Sample Immobilization | Typically not required | Required (e.g., 1% Agarose bed) |
| Glucose Concentration in Assay Medium | Standard (e.g., 10 mM) | Enhanced (e.g., 17.5 - 25 mM) |
| Modulator Stock Concentration | Standard (e.g., 10 µM Oligomycin, 10 µM FCCP) | 1.5X to 2.0X Standard Concentration |
| Measurement Cycle Mix Time | Standard (e.g., 2 minutes) | Extended (e.g., 3 minutes) |
| Post-Assay Normalization Method | Cell count or protein content | Spheroid volume, DNA content, or protein content |
3D Model Assay Workflow
Integrated Data Analysis and Troubleshooting
Data Interpretation and Normalization
Accurate interpretation of metabolic data from adapted assays hinges on appropriate normalization. For low-cell-number experiments, protein or DNA normalization corrects for variations in actual material present per well. For 3D models, volume-based normalization is critical as it accounts for the total biomass and is independent of potential variations in cell density within the spheroid core. The choice of normalization method should be dictated by the biological question and the nature of the sample, and must be consistently applied across all experimental groups.
Common Pitfalls and Troubleshooting Guide
- Low Signal-to-Noise Ratio (Low-Cell Assays): Confirm cell viability post-seeding, ensure precise protein/DNA quantification, and increase the number of technical replicates. Verify that background correction from "no-cell" wells is being applied correctly in the analysis software.
- Poor Modulator Response (3D Models): This is a classic sign of impaired diffusion. Systematically increase the concentration of metabolic modulators (especially FCCP) in the drug ports and confirm the use of extended mixing times during the assay cycle. Re-evaluate spheroid size, aiming for diameters at or below 150 µm if possible.
- High Well-to-Well Variability: For low-cell-number assays, ensure homogeneous cell seeding by using pre-coated plates and optimized seeding volumes. For 3D models, rigorously enforce size selection to use spheroids of uniform diameter.
- Drifting Baseline Measurements: Ensure the XF Assay Medium is freshly prepared and at the correct pH (7.4) before the equilibration step. Verify that the non-CO~2~ incubator is maintaining a stable 37°C temperature throughout the equilibration period.
In cellular energetics research, data quality is not an abstract concept but a fundamental requirement for producing valid, reproducible scientific insights. The Agilent Seahorse Extracellular Flux (XF) Analyzer has become a cornerstone technology for providing real-time measurement of key metabolic parameters, including glycolysis, mitochondrial respiration, and fatty acid oxidation [26]. However, the sophistication of this platform demands equally sophisticated approaches to data quality assessment. A data quality assessment establishes whether experimental data is fit for its intended scientific purpose and forms the foundation for improving data quality throughout the research lifecycle [66]. Making an incorrect assessment may lead to wrong conclusions being drawn, ultimately impacting research validity and potential therapeutic development pathways.
Within the context of Seahorse metabolic flux analysis, data quality transcends simple technical replication to encompass the entire experimental workflow—from cell culture and sample preparation to instrument operation and data interpretation. The complex interplay of biological models, assay conditions, and analytical parameters creates multiple potential failure points that must be systematically identified and controlled. This application note provides a comprehensive framework for identifying and correcting common experimental pitfalls in Seahorse metabolic flux analysis to ensure the highest standards of data quality in cellular energetics research.
Common Data Quality Issues in Metabolic Research
Classification of Experimental Pitfalls
Data quality issues in Seahorse metabolic flux analysis can be systematically categorized to facilitate their identification and resolution. Based on analysis of common problems in both data management and experimental execution, we have identified several critical pitfall categories that directly impact data quality:
Incomplete Data: Data becomes incomplete when essential records, attributes, or fields are missing. In Seahorse analysis, this may manifest as missing technical replicates, omitted normalization parameters, or incomplete metadata regarding cell culture conditions [67]. These omissions lead to inaccurate analysis and ultimately incorrect biological interpretations.
Duplicate Data: Duplicate data occurs when the same piece of information is recorded more than once. In metabolic flux analysis, this might involve unintentional duplicate well measurements or redundant data entries that skew statistical analysis by overrepresenting certain experimental conditions [68] [67].
Expired Data: Experimental data can become "expired" when it no longer represents the current state of the biological system being modeled. How quickly data expires depends on the experimental context—cellular metabolic profiles may change significantly with passage number or culture conditions [67]. Expired data is especially problematic because it may have been accurate at the time of collection but no longer reflects the current biological reality.
Inconsistent Data: Inconsistencies arise when the same information is represented differently across measurements. In Seahorse experiments, this might include inconsistent units of measurement, varying normalization methods, or differing cell seeding protocols that introduce unnecessary variability [68]. These inconsistencies accumulate and degrade the usefulness of data if not continually resolved.
Inaccurate Data: Inaccurate data fails to properly represent the underlying biological reality. In metabolic flux analysis, inaccuracies can stem from improper assay calibration, failure to control for environmental variables, or incorrect compound concentrations in stress tests [67]. Unlike incomplete data, inaccurate data may be complete but systematically erroneous.
Irrelevant Data: Data that doesn't contribute to the specific analytical objectives is considered irrelevant. In comprehensive Seahorse experiments, researchers might collect extraneous parameters that distract from core metabolic measurements or retain historical data that no longer serves the experimental purpose [67].
Table 1: Common Data Quality Issues in Seahorse Metabolic Flux Analysis
| Data Quality Issue | Manifestation in Seahorse Experiments | Potential Impact on Research |
|---|---|---|
| Incomplete Data [67] | Missing normalization factors, omitted replicate measurements, incomplete metadata | Compromised statistical power, inability to reproduce findings, biased results |
| Duplicate Data [68] [67] | Repeated measurements of same condition, redundant data entries | Skewed statistical analysis, overrepresentation of certain experimental conditions |
| Expired Data [67] | Using cells beyond recommended passage number, outdated reagent lots | Conclusions based on non-representative biological states, lack of contemporary relevance |
| Inconsistent Data [68] | Varying normalization methods, changing units between experiments | Reduced ability to compare across experiments, introduced measurement variability |
| Inaccurate Data [67] | Improper instrument calibration, incorrect compound concentrations | Systematic measurement errors, fundamentally flawed conclusions |
| Irrelevant Data [67] | Extraneous parameters not related to research question, retained historical data | Distraction from key findings, unnecessary complexity in analysis |
Consequences of Poor Data Quality
The ramifications of poor data quality in metabolic research extend far beyond simple measurement inaccuracies. Making decisions based on poor quality data may lead to incorrect biological interpretations, wasted research resources, and ultimately flawed scientific conclusions [66]. In the context of drug development, where Seahorse assays are increasingly used to investigate metabolic mechanisms of therapeutic action, data quality issues can misdirect entire research programs and delay identification of promising drug candidates.
Furthermore, the cumulative nature of data quality problems means that issues introduced early in the research lifecycle tend to amplify through subsequent analyses. A single inconsistency in cell culture methodology can propagate through assay execution, data collection, and interpretation, ultimately compromising the validity of published findings. This is particularly problematic in metabolic flux analysis, where researchers often compare subtle differences in metabolic phenotypes between experimental conditions [43].
Experimental Protocols for Quality-Assured Metabolic Flux Analysis
Quality-Centered Workflow for Seahorse Analysis
The following workflow diagram outlines a comprehensive quality assurance process for Seahorse metabolic flux analysis, integrating checks at each critical experimental stage to prevent the data quality issues previously described:
Optimized Protocol for 3D Culture Metabolic Analysis
The application of Seahorse technology to three-dimensional (3D) cultures presents unique data quality challenges due to their complex architecture and metabolic heterogeneity. We have adapted an optimized workflow for Seahorse metabolic analysis of 3D cancer spheroids that emphasizes quality control at each step [43]:
Materials and Reagents:
- Appropriate cancer cell lines (e.g., MCF7, MDA-MB-231 for breast cancer models)
- U-bottom Ultra-Low Attachment (ULA) 96-well plates (PerkinElmer)
- Seahorse XF24 or XF96 FluxPak plates
- Seahorse XF Base Medium
- Metabolic stress test compounds (oligomycin, FCCP, rotenone, antimycin A for Mito Stress Test)
- High-resolution live-cell imaging system
Procedure:
- Spheroid Formation (Day 1):
- Prepare single-cell suspensions using trypsin-EDTA and count cells using an automated cell counter.
- Seed cells in ULA 96-well plates at optimized densities (500-5,000 cells/well depending on cell line) in 100-200 μL of appropriate growth medium.
- Centrifuge plates at 300 × g for 5 minutes to enhance cell aggregation at the well bottom.
- Culture plates at 37°C in a humidified atmosphere of 5% CO₂ for 3-5 days to allow spheroid formation.
Spheroid Quality Assessment (Day 3-5):
- Image spheroids using high-resolution microscopy to assess morphology and size distribution.
- Measure spheroid diameter using image analysis software and calculate volume.
- Exclude spheroids with irregular morphology or significant size outliers from subsequent analysis to reduce variability.
Assay Preparation (Day of Assay):
- Prepare Seahorse XF Base Medium supplemented with 10 mM glucose, 1 mM pyruvate, and 2 mM glutamine.
- Adjust pH to 7.4 and warm to 37°C.
- Carefully transfer individual spheroids to Seahorse XF assay plates using wide-bore pipette tips to prevent damage.
- Add 450-500 μL of pre-warmed assay medium to each well.
- Incubate assay plate in a non-CO₂ incubator at 37°C for 45-60 minutes to temperature and gas equilibrium.
Metabolic Flux Analysis:
- Load stress test compounds into injection ports at optimized concentrations.
- Program the Seahorse XF Analyzer with the appropriate assay protocol (typically Mito Stress Test or Glycolytic Stress Test).
- Initiate the assay and monitor real-time oxygen consumption rate (OCR) and extracellular acidification rate (ECAR).
Post-Assay Normalization:
- Following the assay, fix spheroids and stain with appropriate viability dyes.
- Acquire high-resolution z-stack images to determine viable cell number per spheroid.
- Normalize metabolic parameters (OCR, ECAR) to viable cell number rather than total protein or spheroid volume for more accurate cellular comparisons [43].
Quality Control Considerations:
- Include reference spheroids of known size and viability in each assay plate as internal controls.
- Validate compound concentrations for each cell line, as penetration into 3D structures may require optimization.
- Ensure consistent spheroid transfer technique to minimize technical variability between wells.
- Document all procedural deviations and include in data analysis.
Tissue-Specific Metabolic Flux Protocol
Metabolic analysis of ex vivo tissues presents distinct challenges for data quality. The following protocol for corneal tissue analysis demonstrates approaches to overcome these challenges [69]:
Materials and Reagents:
- Mouse corneal punch biopsies (1.5 mm diameter recommended)
- Seahorse XFe24 Analyzer
- Seahorse XF Glycolysis Stress Test Kit
- Custom-made mesh screens or islet capture plates for tissue immobilization
Procedure:
- Tissue Preparation:
- Euthanize mice according to approved institutional protocols.
- Immediately enucleate eyes and place in ice-cold assay medium.
- Obtain corneal biopsies using 1.5 mm biopsy punch within 5 minutes of euthanasia.
- Transfer biopsies to Seahorse assay plates containing pre-warmed XF Base Medium.
Assay Optimization:
- Determine optimal oligomycin concentration for tissue-specific glycolytic assessment (1.5 μmol/L recommended for corneal tissue) [69].
- Ensure consistent tissue orientation (epithelial side up) for reproducible measurements.
- Use mesh screens or islet capture plates to immobilize tissues without restricting diffusion.
Metabolic Flux Measurement:
- Program Seahorse Analyzer with Glycolysis Stress Test protocol.
- Measure basal ECAR followed by sequential injections of glucose, oligomycin, and 2-DG.
- Include tissue-free wells as background controls.
Data Normalization and Analysis:
- Normalize ECAR measurements to tissue protein content or DNA content.
- Calculate key glycolytic parameters: basal glycolysis, glycolytic capacity, and glycolytic reserve.
- Compare experimental groups with appropriate statistical tests accounting for tissue variability.
The Scientist's Toolkit: Essential Research Reagents and Materials
Successful Seahorse metabolic flux analysis requires careful selection and quality control of research reagents. The following table outlines essential materials and their functions in ensuring data quality:
Table 2: Essential Research Reagents and Materials for Quality-Assured Seahorse Assays
| Category | Specific Reagents/Materials | Quality Assurance Function | Implementation Notes |
|---|---|---|---|
| Cell Culture Materials | Ultra-Low Attachment plates [43], Defined culture media, Characterized cell lines | Ensures consistent biological starting material and minimizes experimental variability | Use low-passage cells, document passage number, verify mycoplasma-free status regularly |
| Assay Consumables | Seahorse XF FluxPak plates, Sensor cartridges, Sterile hydration solution | Provides standardized platform for reproducible measurements across experiments | Validate lot numbers, ensure proper storage conditions, avoid freeze-thaw cycles of reagents |
| Metabolic Modulators | Oligomycin [69], FCCP, Rotenone, Antimycin A, 2-DG | Enables specific interrogation of metabolic pathways through targeted inhibition/stimulation | Prepare fresh solutions for each assay, verify compound solubility and stability, optimize concentrations for specific models |
| Normalization Tools | Protein assay kits, DNA quantification reagents, High-content imaging systems [43] | Allows accurate normalization of metabolic data to biological material | Select normalization method appropriate for model system, validate linear range of assays, perform technical replicates |
| Tissue-Specific Tools | Biopsy punches (1.5 mm recommended) [69], Tissue capture screens, Specialized immobilization matrices | Enables analysis of complex tissue samples while maintaining physiological relevance | Standardize tissue collection timing, optimize immobilization method to prevent hypoxia, validate tissue viability throughout assay |
Advanced Applications and Specialized Methodologies
Comparative Metabolic Analysis Across Model Systems
The versatility of Seahorse technology allows for metabolic assessment across diverse biological models, each with specific data quality considerations. Understanding these model-specific requirements is essential for appropriate experimental design and data interpretation:
Table 3: Data Quality Considerations Across Biological Models in Metabolic Flux Analysis
| Biological Model | Key Data Quality Parameters | Normalization Strategies | Specialized Quality Controls |
|---|---|---|---|
| 2D Cell Cultures [26] | Cell confluence, passage number, media composition, mycoplasma status | Cell number, total protein content, DNA content | Include reference cell lines with known metabolic phenotypes, monitor pH drift in media |
| 3D Spheroids/Organoids [26] [43] | Size uniformity, morphology, central necrosis, viability gradient | Viable cell number [43], spheroid volume, DNA content | Image-based quality assessment, exclude outliers based on size/morphology, validate compound penetration |
| Ex Vivo Tissues [70] [69] | Tissue viability, processing time, orientation, regional heterogeneity | Tissue wet weight, protein content, DNA content | Standardize collection-to-assay interval, validate tissue orientation, include viability markers |
| Isolated Mitochondria [26] | Isolation purity, membrane integrity, functional coupling, substrate specificity | Mitochondrial protein content, citrate synthase activity | Assess respiratory control ratio, validate membrane integrity, include substrate controls |
Workflow for Tissue-Specific Metabolic Analysis
The following diagram illustrates the specialized workflow for metabolic analysis of ex vivo tissues, highlighting critical quality control steps unique to tissue-based assays:
Data quality in Seahorse metabolic flux analysis is not achieved through a single protocol or quality check, but through a comprehensive framework of standardized practices, rigorous validation, and continuous monitoring. By implementing the systematic approaches outlined in this application note—from careful experimental planning to model-specific methodological adaptations—researchers can significantly enhance the reliability, reproducibility, and biological relevance of their metabolic data.
The consequences of poor data quality extend beyond individual experiments to impact entire research programs and therapeutic development pipelines. In contrast, robust data quality practices enable confident interpretation of subtle metabolic differences, meaningful cross-study comparisons, and ultimately, accelerated scientific discovery in cellular energetics research. As Seahorse technology continues to evolve and find new applications in increasingly complex biological systems, the principles of data quality assessment described here will remain fundamental to generating scientifically valid and impactful metabolic insights.
Validation and Context: Comparing Seahorse Technology with Metabolic Research Tools
The accurate assessment of cellular metabolic flux is fundamental to advancing our understanding of cellular energetics in health and disease. Researchers commonly face a choice between real-time, functional metabolic phenotyping and detailed, pathway-specific flux quantification. The Agilent Seahorse XF Analyzer, which measures extracellular acidification rate (ECAR) and oxygen consumption rate (OCR) in live cells, has become a cornerstone technology for real-time metabolic analysis [1]. However, its correlation with established gold standard approaches—particularly stable isotope-based metabolic tracing—requires rigorous validation. This Application Note provides a structured framework for validating Seahorse XF metabolic flux data against precise isotope tracing methods, enabling researchers to confidently integrate these complementary approaches in drug development and basic research.
Principles of Metabolic Flux Technologies
Seahorse Extracellular Flux Analysis
The Seahorse XF Analyzer operates by measuring two key parameters in the extracellular environment of live cells: the Oxygen Consumption Rate (OCR), which serves as a proxy for mitochondrial respiration, and the Extracellular Acidification Rate (ECAR), primarily indicative of glycolytic proton efflux [1]. The platform utilizes a cartridge-based sensor system that transiently creates microchambers for highly sensitive measurements. For in-depth analysis, specific metabolic inhibitors are sequentially injected during the assay. The classic "Mitostress Test" employs oligomycin (ATP synthase inhibitor), FCCP (mitochondrial uncoupler), and rotenone/antimycin A (Complex I and III inhibitors) to parse out specific components of mitochondrial function, including ATP-linked respiration, proton leak, maximal respiratory capacity, and non-mitochondrial oxygen consumption [1].
Stable Isotope Tracing and 13C-Metabolic Flux Analysis (13C-MFA)
Stable isotope tracing involves feeding cells nutrients with incorporated non-radioactive heavy isotopes (e.g., 13C-glucose, 13C-glutamine) and tracking their incorporation into downstream metabolites using mass spectrometry (MS) or nuclear magnetic resonance (NMR) spectroscopy [71] [72]. Unlike metabolomics, which provides a static snapshot of metabolite levels, isotope tracing reveals pathway activities and quantitative metabolic fluxes—the rates at which carbon flows through metabolic networks [71]. 13C-Metabolic Flux Analysis (13C-MFA) is considered a gold standard for quantifying intracellular fluxes, as it computational models 13C-labeling patterns to determine absolute metabolic reaction rates in central carbon metabolism [72].
Table 1: Core Principles of Metabolic Flux Assessment Technologies
| Technology | Measured Parameters | Key Outputs | Temporal Resolution | Pathway Coverage |
|---|---|---|---|---|
| Seahorse XF Analyzer | OCR, ECAR | Basal/maximal respiration, glycolytic capacity, ATP production, proton leak | Real-time, minutes | Glycolysis, mitochondrial respiration, fatty acid oxidation [1] |
| Stable Isotope Tracing | 13C/15N incorporation into metabolites | Pathway usage, nutrient contributions to metabolites, relative pathway activities | End-point or time-course (minutes-hours) | Comprehensive central metabolism, including PPP, TCA cycle, anabolic pathways [71] [72] |
| 13C-MFA | 13C-labeling patterns of intracellular metabolites | Absolute quantitative fluxes (nmol/gDCW/h), net and exchange fluxes, pathway reversibility | Typically steady-state (hours) | Genome-scale metabolic models, central carbon metabolism [72] |
Experimental Protocol for Correlative Studies
The following integrated protocol outlines the steps for parallel metabolic assessment using Seahorse XF and stable isotope tracing in a mammalian cell model.
Sample Preparation and Experimental Design
- Cell Culture: Seed cells at a density optimized for both assays (e.g., 20,000-50,000 cells/well for a Seahorse XF96 plate; parallel in 6-well or 10 cm plates for metabolite extraction). Ensure replicate plates are seeded from the same cell suspension for direct comparison [73].
- Experimental Groups: Include appropriate controls (e.g., untreated vs. treated, wild-type vs. genetically modified) and ensure biological replicates (n ≥ 5 for Seahorse; n ≥ 3 for metabolite extraction).
- Tracer Preparation: Prepare culture medium containing 13C-labeled substrates. For studies of glycolysis and TCA cycle, U-13C-glucose (uniformly labeled) is most common. Use a concentration identical to your standard culture medium [71] [74].
Integrated Workflow
- Step 1: Pre-incubation. Culture all cells in the experimental groups under standard conditions until ~80% confluence.
- Step 2: Tracer Incubation. For the isotope tracing group, replace the medium with the 13C-labeled medium. Incubate for a predetermined time to reach an isotopic steady state (typically 4-24 hours for mammalian cells, requiring pilot studies) [72].
- Step 3: Parallel Assay Execution.
- Seahorse XF Assay: Perform the assay using the XF Glycolysis Stress Test Kit (sequential injections of glucose, oligomycin, and 2-DG) or the XF Mito Stress Test (injections of oligomycin, FCCP, and rotenone/antimycin A) according to the manufacturer's protocol [1] [73].
- Metabolite Extraction for Isotope Tracing: At the exact time point corresponding to the "basal" measurement in the Seahorse assay, rapidly wash the parallel cell plates with ice-cold saline and quench metabolism using cold methanol/water solutions. Scrape cells and perform a biphasic extraction for polar and non-polar metabolites. Collect extracts for LC-MS or GC-MS analysis [72] [74].
Metabolite Analysis and 13C-MFA
- LC-MS/GC-MS Analysis: Analyze metabolite extracts using coupled chromatography-mass spectrometry platforms. For polar metabolites (e.g., glycolytic intermediates, TCA cycle acids), hydrophilic interaction liquid chromatography (HILIC)-MS is often used. Detect and quantify the mass isotopologue distribution (MID) of each metabolite [71] [72].
- Data Processing: Use software (e.g., INCA, OpenFLUX) to correct raw MIDs for natural isotope abundance. Integrate the corrected MIDs with extracellular uptake/secretion rates to compute intracellular metabolic fluxes using computational models like Elementary Metabolite Unit (EMU) modeling [72].
Figure 1: Integrated experimental workflow for correlative analysis of Seahorse XF data and stable isotope tracing.
Key Validation Metrics and Correlation Analysis
Successful validation requires demonstrating that key parameters derived from Seahorse XF assays show strong correlation with quantitative fluxes obtained from 13C-MFA.
Glycolytic Pathway Correlations
Compare the Glycolytic Capacity from the Seahorse Glycolysis Stress Test (the ECAR after oligomycin injection) with the direct flux from 13C-glucose to lactate quantified by isotope tracing. A strong positive correlation validates Seahorse ECAR as a reliable indicator of glycolytic flux. Furthermore, the contribution of glucose to the serine/glycine biosynthesis pathway via 3-phosphoglycerate can be traced and related to the glycolytic proton efflux [71].
Mitochondrial Function Correlations
Correlate the Maximal Respiratory Capacity (OCR after FCCP injection from the Mito Stress Test) with the TCA cycle flux quantified by 13C-MFA, such as the citrate synthase flux or the combined efflux of labeled carbon from the TCA cycle as CO2 [1] [75]. The ATP-linked OCR (the drop after oligomycin) should correlate with the cellular ATP production rate, which can be independently quantified.
Table 2: Key Correlation Metrics for Method Validation
| Seahorse XF Parameter | Corresponding Isotope Tracer Metric | Expected Correlation | Biological Interpretation |
|---|---|---|---|
| Glycolytic Capacity (ECAR) | M+3 lactate enrichment from U-13C-glucose; Glycolytic flux from 13C-MFA | Strong Positive | Validates ECAR as a proxy for lactate production and glycolytic carbon flow [1] [71]. |
| Maximal Respiration (OCR) | TCA cycle flux (e.g., M+2 citrate/succinate enrichment; citrate synthase flux from 13C-MFA) | Strong Positive | Confirms that maximal OCR reflects the integrated activity of the mitochondrial electron transport chain and TCA cycle [1] [75]. |
| ATP-linked OCR | Cellular ATP production rate (calculated from 13C-MFA or measured directly) | Positive | Links the OCR consumed for ATP synthesis with the actual cellular ATP turnover. |
| Basal ECAR | Ratio of lactate M+3 / pyruvate M+3 from U-13C-glucose | Positive | Supports that basal acidification reflects glycolytic end-product formation. |
Figure 2: Logical relationships between key Seahorse XF parameters and corresponding isotope tracer metrics for validation.
Research Reagent Solutions
The following reagents are essential for the successful execution of the correlated validation protocol.
Table 3: Essential Research Reagents for Correlative Metabolic Flux Studies
| Reagent / Kit | Specific Role | Application in Protocol |
|---|---|---|
| Seahorse XF Glycolysis Stress Test Kit | Contains oligomycin and 2-DG to sequentially challenge glycolysis. | Measures glycolytic parameters (Glycolytic Capacity, Glycolytic Reserve) for correlation with tracer data [1]. |
| Seahorse XF Mito Stress Test Kit | Contains oligomycin, FCCP, and rotenone/antimycin A to probe mitochondrial function. | Quantifies key mitochondrial parameters (Basal/Maximal Respiration, ATP production, Proton Leak) [1] [73]. |
| U-13C-Glucose | Uniformly labeled 13C tracer for carbon mapping through metabolic pathways. | Primary tracer for quantifying glycolytic and TCA cycle fluxes; added to assay medium for isotope tracing arm [71] [74]. |
| Oligomycin | Inhibits ATP synthase (Complex V). | Used in both Seahorse Stress Tests and can be applied in tracer studies to directly link ATP synthase inhibition with changes in metabolic fluxes [1]. |
| FCCP | Mitochondrial uncoupler that collapses the proton gradient. | Injects during Seahorse Mito Stress Test to induce maximal respiration; useful for validating TCA cycle capacity under high demand [1]. |
| LC-MS/MS Solvents & Columns | High-purity methanol, acetonitrile, and HILIC columns for metabolite separation. | Critical for the high-resolution separation of polar metabolites prior to mass spectrometric analysis of 13C-labeling [72] [74]. |
This protocol provides a robust framework for validating functional metabolic readings from the Seahorse XF Analyzer against the quantitative, pathway-specific insights of stable isotope tracing. The demonstrated correlation between these methods empowers researchers to use Seahorse technology with greater confidence for high-throughput metabolic phenotyping, especially in drug development. The synergistic use of these tools, where Seahorse identifies real-time functional phenotypes and isotope tracing reveals the underlying mechanistic fluxes, provides a comprehensive view of cellular metabolism that is greater than the sum of its parts.
Within the landscape of cellular metabolism research, scientists have a diverse toolkit of analytical techniques at their disposal. Among these, radioactive assays and mass spectrometry (MS) have long been foundational methods. Radioactive assays, utilizing radiolabeled substrates, have been instrumental in tracing metabolic pathways and quantifying reaction rates [76]. Mass spectrometry, particularly when coupled with separation techniques like liquid or gas chromatography (LC-MS/GC-MS), offers exceptional sensitivity and metabolome coverage, enabling the identification and quantification of hundreds to thousands of metabolites [77] [78]. However, the emergence of Seahorse Metabolic Flux Analysis has provided a powerful alternative and complementary approach. This application note delineates the distinct advantages of the Seahorse platform, focusing on its capability for real-time, functional phenotyping of living cells, a feature not readily attainable with the aforementioned classical techniques. Framed within a broader thesis on cellular energetics research, this analysis underscores how Seahorse technology fills a critical methodological niche in the study of metabolic pathways and energy production.
Comparative Analysis of Key Technologies
The table below provides a direct comparison of the core characteristics of Radioactive Assays, Mass Spectrometry, and Seahorse Metabolic Flux Analysis.
Table 1: Comparative Overview of Metabolic Analysis Techniques
| Feature | Radioactive Assays [76] | Mass Spectrometry (MS) [77] [78] [79] | Seahorse Metabolic Flux Analysis [26] [12] [14] |
|---|---|---|---|
| Primary Measured Output | Decay events (e.g., disintegrations per minute) from radionuclides. | Mass-to-charge ratio (m/z) of ionized metabolites. | Real-time Oxygen Consumption Rate (OCR) and Extracellular Acidification Rate (ECAR). |
| Key Strengths | High sensitivity for specific tracer studies; direct measurement of atom incorporation. | High sensitivity (femtomolar to attomolar); broad metabolome coverage (300-1000+ metabolites); capacity for isotope tracing. | Real-time kinetic measurements; non-destructive and label-free; simultaneous measurement of oxidative phosphorylation & glycolysis; functional analysis of living cells. |
| Key Limitations | Use of hazardous radioactive materials; requires specific radiolabeled compounds; measures flux indirectly. | Destructive sample preparation; complex data analysis; potential for ion suppression; indirect functional assessment. | Limited to a subset of metabolic pathways (primarily glycolysis & mitochondrial respiration); does not provide molecular identity of metabolites. |
| Throughput | Generally low to medium. | Medium to high. | High (96-well plate format). |
| Temporal Resolution | Endpoint measurements. | Endpoint or semi-kinetic (with time-series sampling). | Real-time and continuous (minutes/hours). |
| Sample Status | Destructive (often requires extraction). | Destructive (requires metabolite extraction). | Non-destructive (cells remain viable for subsequent assays). |
| Functional vs. Molecular Data | Provides flux data for a specific reaction. | Provides molecular identity and abundance data. | Provides integrated, functional phenotypic data. |
Experimental Protocols for Seahorse XF Real-Time ATP Rate Assay
The following section details a standardized protocol for profiling metabolic fluxes in both adherent and suspension cells using the Agilent Seahorse XF Pro Analyzer, specifically with the XF Real-Time ATP Rate Assay Kit [12]. This assay simultaneously quantifies the rate of ATP production from glycolysis and mitochondrial oxidative phosphorylation (OXPHOS).
Principal Workflow
The overall experimental procedure, spanning two days, is visualized in the workflow below.
Detailed Step-by-Step Protocol
Day Prior to Assay: Sensor Hydration and Cell Seeding
Sensor Cartridge Hydration:
- Use the Seahorse XFe96/XF Pro PDL FluxPak.
- Add 200 µL of Seahorse XF Calibrant (provided in the FluxPak) to each well of the utility plate on the sensor cartridge.
- Place the hydrated cartridge in a 37°C non-CO₂ incubator overnight [12].
Cell Seeding:
- Harvest and count cells. The optimal cell number is highly cell-type dependent and must be determined empirically (typically 4,000–500,000 cells per well) [12] [14].
- For Adherent Cells: Seed the desired number of cells in 80 µL of growth medium into the Seahorse XF cell culture microplate. Then, add an additional 100 µL of medium to each well, bringing the total volume to 180 µL. Incubate the microplate overnight at 37°C in a CO₂ incubator [12].
- For Suspension Cells: On the day of the assay, coat the microplate with a suitable cell attachment solution (e.g., Poly-D-Lysine). Seed the desired number of cells in 180 µL of growth medium directly into the coated plate. Centrifuge the plate at 200 x g for 1-5 minutes to gently pellet the cells onto the well surface. Proceed immediately to the assay medium replacement step [12].
Day of Assay: Assay Medium Preparation and Instrument Run
Preparation of Seahorse XF Assay Medium:
- On the day of the assay, prepare the Seahorse XF Base Medium (e.g., XF RPMI or XF DMEM) by supplementing it with 1 mM pyruvate, 2 mM glutamine, and 10 mM glucose (or concentrations relevant to your biological question) [12].
- Warm the complete assay medium to 37°C and adjust the pH to 7.4.
Assay Medium Replacement and Cell Equilibration:
- Carefully remove the cell culture microplate from the incubator.
- Gently aspirate the growth medium from each well.
- Wash the cells by gently adding 180-200 µL of the pre-warmed, pH-adjusted Seahorse XF Assay Medium.
- Aspirate the wash medium and add a final 180 µL of fresh Seahorse XF Assay Medium to each well.
- Incubate the cell culture microplate in a 37°C non-CO₂ incubator for 45-60 minutes to allow temperature and pH equilibration [12].
Loading the Injector Ports and Instrument Run:
- During the cell equilibration, load the sensor cartridge's injector ports with the modulators from the XF Real-Time ATP Rate Assay Kit.
- Port A: Load with Oligomycin (1.5 µM final well concentration).
- Port B: Load with a mixture of Rotenone and Antimycin A (0.5 µM final well concentration each).
- Carefully place the hydrated sensor cartridge onto the cell culture microplate to create the assay cartridge. Load this into the Seahorse XF Pro Analyzer.
- Initiate the pre-programmed ATP Rate Assay protocol. The instrument will automatically perform baseline measurements of the OCR and ECAR, followed by sequential injections of the modulators and subsequent metabolic measurements [12].
- During the cell equilibration, load the sensor cartridge's injector ports with the modulators from the XF Real-Time ATP Rate Assay Kit.
Data Analysis and Interpretation
The Seahorse Wave software calculates the ATP production rates using the following logic and equations [12]:
- Following the injection of Oligomycin (ATP synthase inhibitor), the decrease in OCR is used to calculate the mitochondrial ATP production rate. The decrease in ECAR (or the corresponding increase in glycolytic proton efflux rate, glycoPER) is used to calculate the glycolytic ATP production rate.
- The key calculations are:
- Glycolytic ATP Production Rate = glycoPER
- Mitochondrial ATP Production Rate = (Basal OCR - OCR after Oligomycin) × (P/O Ratio)
- Total ATP Production Rate = Glycolytic ATP Production Rate + Mitochondrial ATP Production Rate
Table 2: Key Research Reagent Solutions for Seahorse XF ATP Rate Assay
| Reagent / Material | Function / Description | Source / Example |
|---|---|---|
| Seahorse XF Pro Analyzer | Integrated instrument measuring OCR and ECAR in a 96-well plate in real-time. | Agilent Technologies [12] |
| XF Cell Culture Microplate | Specialized microplate for seeding cells; part of the XF FluxPak. | Agilent Technologies [12] |
| Sensor Cartridge | Disposable cartridge with embedded fluorophores for O₂ and H⁺ detection; part of the XF FluxPak. | Agilent Technologies [12] |
| XF Calibrant Solution | Solution for hydrating the sensor cartridge to ensure stable sensor readings. | Agilent Technologies [12] |
| XF Base Medium | Buffered medium (e.g., XF DMEM, XF RPMI) lacking bicarbonate, phenol red, and serum. | Agilent Technologies [12] |
| XF Real-Time ATP Rate Assay Kit | Contains optimized concentrations of Oligomycin, and Rotenone/Antimycin A. | Agilent Technologies [12] |
| Oligomycin | Inhibitor of ATP synthase (Complex V). Used to calculate ATP-linked respiration. | Included in ATP Rate Assay Kit [12] |
| Rotenone & Antimycin A | Inhibitors of mitochondrial Complex I and III, respectively. Used to shut down mitochondrial respiration. | Included in ATP Rate Assay Kit [12] |
Metabolic Pathway Analysis and Data Interpretation
The Seahorse XF ATP Rate Assay specifically probes the functional activity of the core energy-producing pathways: glycolysis and mitochondrial oxidative phosphorylation. The modulators target specific complexes in the electron transport chain, allowing for a dissected view of mitochondrial function. The diagram below illustrates the targeted pathways and sites of inhibitor action.
The strategic injection of metabolic inhibitors allows for the functional dissection of the energy map:
- Basal Measurements: Represent the foundational metabolic state of the cell, showing the baseline OCR (mitochondrial respiration) and ECAR (glycolytic activity) under nutrient-replete conditions.
- Post-Oligomycin Injection: Oligomycin inhibits ATP synthase (Complex V). The resulting drop in OCR represents the portion of respiration dedicated to ATP production (ATP-linked respiration). The simultaneous increase in ECAR reveals the cell's capacity to upregulate glycolysis to compensate for the loss of mitochondrial ATP.
- Post-Rotenone & Antimycin A Injection: This combination shuts down the electron transport chain completely by inhibiting Complex I and III. The remaining OCR is non-mitochondrial respiration. This step confirms the mitochondrial-specific oxygen consumption and provides a key baseline for calculations.
This application note demonstrates that Seahorse Metabolic Flux Analysis occupies a unique and complementary position in the metabolic researcher's toolkit. While radioactive assays provide unmatched sensitivity for tracking specific atoms through pathways, and mass spectrometry offers a comprehensive snapshot of metabolic abundance, the Seahorse platform excels at delivering kinetic, functional phenotyping of living cells without the need for labels or destructive extraction. Its ability to simultaneously interrogate the two major ATP-producing pathways in real-time provides immediate insight into metabolic flexibility and bioenergetic capacity. For researchers in fundamental biology, cancer metabolism, immunology, and drug development, integrating Seahorse XF technology with targeted MS-based metabolomics and genomic approaches provides a powerful, multi-faceted strategy to unravel the complexities of cellular energetics.
The Agilent Seahorse XF Analyzer represents a pivotal technology in cellular bioenergetics research, enabling scientists to move beyond analyzing static cellular components to understanding dynamic cellular function. This technology measures the energy that drives over 20,000 genes, 200,000 proteins, and thousands of cellular pathways in real-time [80]. By simultaneously assessing the two major energy pathways—mitochondrial respiration and glycolysis—in live cells without requiring cell lysis or fixation, the platform provides a clear window into the critical functions driving cell signaling, proliferation, activation, toxicity, and biosynthesis [80] [55].
The fundamental measurements obtained are the Oxygen Consumption Rate (OCR), an indicator of mitochondrial respiration, and the Extracellular Acidification Rate (ECAR), primarily representing glycolytic proton efflux [12] [13]. These parameters are measured non-invasively at intervals of approximately 5-8 minutes while maintaining cells at 37°C to preserve normal physiology [12]. This real-time metabolic flux analysis has become indispensable for investigating metabolic reprogramming in cancer [38], characterizing immune cell activation [13] [29], and evaluating drug-induced mitochondrial dysfunction during pharmaceutical development [12].
Technical Advantages of Seahorse XF Platform
Real-Time Kinetic Measurement
The Seahorse XF platform captures metabolic dynamics that traditional endpoint assays cannot detect.
- Continuous Metabolic Monitoring: The analyzer takes sequential measurements every 5-8 minutes, generating kinetic data that reveals how cellular metabolism changes over time and in response to injected inhibitors or substrates [12]. This allows researchers to observe immediate cellular responses to perturbations, providing insights into metabolic flexibility and plasticity.
- Simultaneous Dual-Parameter Readout: By concurrently measuring OCR and ECAR from the same well, the technology reveals how both major energy-producing pathways interact and compensate for each other [55]. This dual-parameter approach was crucial for a recent study on CAR T cells, which identified a metabolic transition from oxidative phosphorylation to aerobic glycolysis by day 7 of expansion, followed by a return to oxidative phosphorylation by day 21 [29].
- Preserved Cellular Physiology: Since measurements are taken in live cells under controlled conditions (37°C, without cell fixation or lysis), the data reflects native cellular states more accurately than destructive methods [12]. The total assay time is typically 60-90 minutes, after which other biological assays can often be performed on the same cells [12].
Minimal Cell Requirement
The platform's compatibility with small cell numbers makes it suitable for studying precious or limited samples.
Table 1: Experimental Scales and Cell Requirements for Seahorse XF Systems
| Platform Format | Well Type | Typical Cell Number Range | Recommended Replicates | Applications |
|---|---|---|---|---|
| XF24 | 24-well | 20,000-100,000 cells/well | ≥4 wells/group [12] | Standard cell lines, tissue explants |
| XF96 | 96-well | 5,000-50,000 cells/well | ≥4 wells/group [12] | Primary cells, rare cell populations |
| Photoreceptor Protocol | 24-well | Dissociated mouse photoreceptors | Not specified | Specialized primary neuronal cells [37] |
The ability to work with primary cells is particularly valuable. For example, the protocol for dissociated mouse retinal photoreceptors enables metabolic assessment of specialized neuronal cells that cannot be expanded in culture [37]. Similarly, studies on activated T cells demonstrate the platform's utility for immune cells [13]. The option to use 96-well plates allows researchers to conduct experiments using fewer cells, media, and reagents while still obtaining robust data [12].
Non-invasive Methodology
The non-destructive nature of Seahorse analysis preserves cellular integrity and enables additional downstream applications.
- Sensor Probe Technology: The analyzer uses a sensor cartridge with two fluorophores for measuring oxygen and pH. The probes transiently create a microchamber of 200 microns at the bottom of each well, measure variations in dissolved oxygen and free proton concentrations for 2-5 minutes, then retract to allow the cellular environment to re-equilibrate [12]. This cyclical measurement approach avoids permanent perturbation of the cellular microenvironment.
- Post-Assay Viability: After completing a Seahorse assay, cells remain viable, allowing researchers to perform additional biological analyses on the same plate [12]. This multi-modal approach maximizes the information obtained from each sample.
- Flexible Normalization Strategies: Data can be normalized using various methods, including cell number (via Hoechst nuclear staining [55]), total protein content [12], or other relevant parameters, ensuring accurate quantification and comparison across experimental conditions.
Application Protocols
ATP Rate Assay for Suspension Cells
This protocol is optimized for profiling metabolic fluxes in suspension cells, such as hematopoietic cells or cancer cells in suspension.
Table 2: Key Research Reagent Solutions for Suspension Cell ATP Rate Assay
| Reagent/Kit Name | Catalog Number | Function | Application Notes |
|---|---|---|---|
| Seahorse XFe96/XF Pro PDL FluxPak | #103798-100 [12] | Provides PDL-coated microplates, sensor cartridges, and calibrant | Ensures proper cell adhesion for suspension cells |
| Seahorse XF RPMI Medium | #103576-100 [12] | Assay medium for hematopoietic cells | Maintains physiological pH and osmolarity |
| Seahorse XF Real-Time ATP Rate Assay Kit | #103592-100 [12] | Contains oligomycin, rotenone/antimycin A | Enables calculation of glycolytic and mitochondrial ATP production rates |
Day Prior to Assay:
- Sensor Cartridge Hydration: Assemble the sensor cartridge with utility plate filled with XF Calibrant and incubate in a non-CO₂ incubator at 37°C for 16 hours [12].
- Cell Preparation: Count suspension cells and seed appropriate numbers (typically 20,000-100,000 cells/well for XF24; 5,000-50,000 for XF96) in PDL-coated plates. Centrifuge plates at 200 × g for 1 minute to settle cells evenly [12].
- Incubation: Incubate cell culture plates overnight in a humidified CO₂ incubator at 37°C [12].
Day of Assay:
- Assay Medium Preparation: Prepare XF RPMI or DMEM medium supplemented with 1.0 M glucose, 100 mM pyruvate, and 200 mM glutamine as required [12].
- Cell Washes: Gently replace growth medium with pre-warmed assay medium and centrifuge again if needed to maintain cell attachment [12].
- Instrument Equilibration: Place cell culture plate in Seahorse XF Pro Analyzer equilibrated at 37°C without CO₂ [12].
- Assay Execution: Run the ATP Rate Assay program with sequential injections of oligomycin (complex V inhibitor) followed by rotenone/antimycin A (complex I and III inhibitors) [12].
Metabolic Flux Analysis in Primary Retinal Photoreceptors
This specialized protocol enables real-time assessment of mitochondrial respiration and glycolysis in dissociated mouse retinal photoreceptors [37].
Day Before Assay:
- Sensor Cartridge Hydration: Follow standard hydration procedures as described in section 3.1.
- Dark Adaptation: Place mice in new cages with food and water in a dark room for 16 hours to standardize retinal physiology [37].
- Equipment Preparation: Power on the XFe24 Analyzer and Wave software, allowing the machine to equilibrate at 37°C for 16 hours [37].
Day of Assay:
- Plate Coating: Coat Seahorse XF24 cell culture microplates with 100 μL of 0.01 mg/mL Poly-D-lysine solution for 1 hour, then aspirate and air-dry completely [37].
- Retina Dissociation:
- Euthanize dark-adapted mice and enucleate eyes under dim red light.
- Dissect retinas and transfer to papain dissociation solution.
- Incubate for 20 minutes in a cell culture incubator (5% CO₂, 37°C).
- Mechanically triturate retinas 10-15 times using a P1000 pipette.
- Add ovomucoid inhibitor solution and pass cell suspension through a 35 μm strainer [37].
- Cell Counting and Seeding: Count dissociated photoreceptor cells and seed onto pre-coated Seahorse plates. Over 90% of dissociated retinal cells are photoreceptors, ensuring cell-type-specific metabolic measurements [37].
- Stress Test Execution: Perform Glycolysis Stress Test and Mito Stress Test sequentially on the same plate using customized assay media [37].
Diagram 1: Retinal Photoreceptor Metabolic Assay Workflow
Data Analysis and Interpretation
Metabolic Parameter Calculations
The Seahorse Wave software automatically calculates key metabolic parameters from the raw OCR and ECAR measurements.
Table 3: Quantitative Metabolic Parameters from Stress Tests
| Parameter | Definition | Biological Significance | Typical Values in T Cells (Activated) |
|---|---|---|---|
| Basal OCR | Oxygen consumption rate under baseline conditions | Represents energy demand for housekeeping functions | Cell-type dependent [13] |
| ATP Production Rate | Sum of glycolytic and mitochondrial ATP production | Total cellular energy output | Calculated from glycoPER and OCR [12] |
| Glycolytic Capacity | Maximum ECAR after oligomycin injection | Maximum possible glycolytic output | Cell-type dependent [13] |
| Spare Respiratory Capacity | Difference between maximal and basal OCR | Ability to respond to increased energy demand | Cell-type dependent [13] |
For the Real-Time ATP Rate Assay, several key calculations are performed [12]:
- Glycolytic ATP Production Rate = glycolytic proton efflux rate (glycoPER)
- Mitochondrial ATP Production Rate = OCRATP × 2 × P/O ratio
- Where OCRATP = Basal OCR - OCR after oligomycin injection
- P/O ratio represents ATP molecules generated per oxygen atom reduced
- Total ATP Production Rate = Glycolytic ATP Production Rate + Mitochondrial ATP Production Rate
Data Normalization and Quality Control
Proper normalization is critical for generating reliable, interpretable data.
- Cell Number Normalization: Using Hoechst nuclear staining and automated imaging (e.g., Agilent BioTek Cytation5) provides accurate cell counting for normalization [55].
- Protein Content Normalization: As an alternative to cell counting, data can be normalized to total protein content measured post-assay [12].
- Quality Control Metrics: Include assessment of cell viability post-assay, consistency across replicate wells (recommended ≥4 replicates/group [12]), and appropriate response to inhibitor injections.
Diagram 2: Core Metabolic Pathways Measured by Seahorse XF
Applications in Biomedical Research
The technical advantages of real-time measurement, minimal cell requirements, and non-invasive methodology make Seahorse XF technology applicable across diverse research areas.
- Cancer Metabolism Research: The platform enables identification of metabolic switches that confer malignant characteristics and investigation of metabolic heterogeneity in tumors [12] [38]. Studies comparing suspension vs. adherent cancer cells have revealed distinct metabolic profiles, with adherent cells appearing more dependent on lactic fermentation and suspended cells showing decreased glycolytic reserve [12].
- Immunometabolism: Seahorse analysis has revealed that T cells undergo profound metabolic reconfiguration upon activation, transitioning from quiescence to a metabolically active state with increased aerobic glycolysis and mitochondrial respiration [13]. This metabolic plasticity is crucial for effective immune function and has been leveraged to improve CAR T cell manufacturing [29].
- Drug Discovery and Development: The technology provides methods to evaluate new drugs for potential mitochondrial toxicity, a critical safety assessment in pharmaceutical development [12]. The Agilent Seahorse XF Pro analyzer was recognized with the 2023 Scientists' Choice Award as the best new drug discovery & development product of 2022 [80].
- Neurological and Metabolic Diseases: The platform can investigate metabolic defects in specialized cells such as retinal photoreceptors, which has implications for understanding retinal diseases like age-related macular degeneration and diabetic retinopathy [37].
The integration of Seahorse XF technology with complementary techniques like metabolomics, isotope tracing, and hyperpolarized 13C-NMR provides researchers with a powerful toolkit for comprehensive metabolic characterization [38] [29]. This multi-modal approach continues to advance our understanding of cellular bioenergetics in health and disease.
Seahorse XF Analyzers have become a cornerstone technology in cellular bioenergetics, providing real-time, live-cell metabolic data. However, a comprehensive understanding of its inherent limitations and constraints is crucial for researchers and drug development professionals to accurately interpret data and design robust experiments. This application note details the key technological boundaries of Seahorse metabolic flux analysis, providing structured protocols to navigate these challenges effectively.
Core Technical Limitations of Seahorse XF Analysis
The Seahorse XF Analyzer measures oxygen consumption rate (OCR) and extracellular acidification rate (ECAR) as proxies for oxidative phosphorylation and glycolysis, respectively. While invaluable, these measurements come with significant interpretative constraints that must be accounted for in experimental design and data analysis.
Indirect Measurement and Assumption Dependency
A fundamental limitation lies in the indirect nature of the measurements. OCR and ECAR do not directly quantify ATP production but rather serve as surrogate parameters that require careful interpretation [81].
- OCR Assumptions: Oxygen consumption is assumed to primarily reflect mitochondrial respiration coupled to ATP synthesis. However, OCR also captures oxygen consumption from non-ATP-producing processes, including proton leak and reactions by non-mitochondrial oxidases [81].
- ECAR Limitations: While often interpreted as glycolytic flux, ECAR measurements capture all sources of extracellular acidification. This includes acid production from metabolic processes beyond lactate production (e.g., CO2 production from the TCA cycle, excretion of other organic acids), which can lead to overestimation of glycolytic rate [81].
Quantitative Conversion Challenges
Transforming raw OCR and ECAR measurements into quantitative ATP production rates requires multiple conversion steps with inherent limitations [81]:
Diagram 1: Conversion workflow from raw measurements to ATP production rates, highlighting multiple assumption-dependent steps.
Platform-Specific Technical Constraints
Different Seahorse XF platforms present specific technical constraints that impact experimental design and data interpretation:
Table 1: Key Quantitative Constraints in ATP Production Calculations
| Parameter | Constraint/Assumption | Impact on Data Interpretation |
|---|---|---|
| ECAR to Proton Production Conversion | Requires precise buffering power measurement of specific medium [81] | Unit conversion errors can propagate through all subsequent calculations |
| Non-Glycolytic Acidification | Must be empirically determined and subtracted [81] | Failure to account for this leads to overestimation of glycolytic ATP |
| ATP Stoichiometry | P:O ratio assumptions vary by cell type and metabolic state [81] | Incorrect stoichiometry directly affects absolute ATP production values |
| Platform Translation | 96-well vs 24-well instrument calculations are not directly transferable [81] | Volume differences in measurement microchambers affect absolute values |
Critical Assessment of Measurement Boundaries
Pathway Interpretation Constraints
The standard interpretation of OCR and ECAR as specific metabolic pathways represents a significant oversimplification of cellular metabolism. The reality involves substantial crosstalk and parallel contributions that complicate direct pathway assignment.
Diagram 2: Disconnect between direct measurements, common interpretations, and actual biological contributors.
Dynamic Range and Detection Limitations
The technology faces inherent detection limits that constrain its application in certain biological contexts:
- Cell Number Requirements: Most assays require 10,000-200,000 cells per well depending on cell type and metabolic activity, limiting applications with rare primary cells [82].
- Temporal Resolution: The standard 8-minute measurement cycle (3 min mix, 2 min wait, 3 min measure) provides limited temporal resolution for rapid metabolic transitions [83].
- Sensitivity Thresholds: Low metabolic rates approach instrument detection limits, particularly for OCR in cells with minimal mitochondrial function.
Experimental Protocols for Boundary Validation
Protocol 1: Validating ATP Production Calculations
This protocol provides a methodology to transform raw Seahorse data into ATP production rates while accounting for key limitations [81].
Materials and Reagents:
- Seahorse XF Analyzer (24-well or 96-well platform)
- Cell culture microplates appropriate for the platform
- Seahorse XF Base Medium
- Substrates of interest (glucose, glutamine, fatty acids)
- Metabolic inhibitors (oligomycin, rotenone, antimycin A, 2-DG)
- HEPES buffer for pH stabilization
- H₂SO₄ for buffering capacity calibration
Step-by-Step Methodology:
Buffering Power Calibration (Day 1)
- Prepare experimental medium identical to that used for cellular assays.
- In a Seahorse culture plate, add medium alone (no cells) to 3-5 wells.
- Program the analyzer to perform sequential injections of known H₂SO₄ concentrations.
- Record pH change after each injection to generate a standard curve.
- Calculate buffering power (pmol H+/mpH) using linear regression.
* Cellular Assay (Day 2)*
- Seed cells at appropriate density and incubate for 24 hours.
- Replace medium with calibrated Seahorse XF medium containing relevant substrates.
- Incubate at 37°C in a CO₂-free incubator for 45-60 minutes.
- Load cartridge with metabolic inhibitors according to experimental design.
- Run Seahorse assay using standard 8-minute measurement cycles [83].
Data Transformation
- Convert ECAR (mpH/min) to proton production rate (PPR, pmol H+/min) using:
- Subtract non-glycolytic acidification by measuring acidification after glucose removal or 2-DG inhibition.
- Apply stoichiometric conversions:
- Sum contributions for total ATP production rate.
Protocol 2: Addressing Non-Glycolytic Acidification
This specialized protocol quantifies and corrects for non-glycolytic acidification sources that confound ECAR interpretation [81].
Experimental Workflow:
- Parallel Plate Setup: Prepare identical cell plates for Seahorse analysis and extracellular metabolite quantification.
- Lactate Measurement: Collect medium from time-point matched wells for lactate quantification via mass spectrometry or biochemical assay.
- Acidification Partitioning: Calculate the proportion of total acidification attributable to lactate efflux versus other sources.
- Correction Factor Application: Derive cell-type specific correction factors for future experiments.
Research Reagent Solutions for Boundary Mitigation
Table 2: Essential Research Reagents for Addressing Seahorse Limitations
| Reagent/Kit | Primary Function | Role in Addressing Constraints |
|---|---|---|
| Seahorse XF Mito Stress Test Kit | Sequential inhibition of ETC complexes | Standardizes assessment of mitochondrial function parameters; enables cross-experiment comparison |
| Seahorse XF Glycolysis Stress Test Kit | Measures glycolytic capacity and reserve | Provides framework for interpreting ECAR within defined parameters |
| Seahorse XF Mito Fuel Flex Test Kit | Tests dependency on different fuel substrates [83] | Addresses assumption of uniform fuel usage across cell types |
| Extracellular Flux Analyzer Calibration Solution | Instrument and sensor calibration | Ensures measurement accuracy within instrument specifications |
| Custom H₂SO₄ Injection Plates | Empirical buffering power determination [81] | Enables accurate ECAR to PPR conversion |
| Parallel Metabolomics Platforms | Validation of lactate efflux and metabolite quantification [38] | Addresses non-glycolytic acidification limitations |
Strategic Framework for Technology Application
When employing Seahorse XF technology within a research or drug development pipeline, researchers should:
- Employ Complementary Techniques: Integrate Seahorse data with direct metabolomics, isotope tracing, and biochemical assays to validate findings [38].
- Contextualize Quantitative Claims: Present ATP production rates as estimates with clearly stated assumptions rather than absolute values.
- Prioritize Comparative Analyses: Focus on relative differences between experimental conditions rather than absolute values when assumptions are uncertain.
- Conduct Platform-Specific Validation: Establish cell-type and platform-specific calibration factors rather than relying on universal conversion values.
The constraints detailed herein do not diminish the utility of Seahorse XF technology but rather define its optimal application space. By understanding and accounting for these limitations, researchers can design more robust experiments, interpret data more accurately, and advance our understanding of cellular energetics in health and disease.
Metabolic flux analysis has become a cornerstone of cellular bioenergetics research, providing critical insights into the fundamental processes that sustain life and drive disease. The Agilent Seahorse Extracellular Flux (XF) Analyzer, a pivotal technology in this field, enables real-time, simultaneous measurement of two key metabolic parameters: the Oxygen Consumption Rate (OCR) for mitochondrial respiration and the Extracellular Acidification Rate (ECAR) for glycolytic flux [1]. This simultaneous assessment allows researchers to quantitatively analyze metabolic phenotypes and switching in live cells [84]. As we move forward, emerging applications and technological integrations are significantly expanding the capabilities and scope of metabolic flux analysis, particularly in drug discovery, cancer research, and immunometabolism [85]. This article explores these future directions within the context of a broader thesis on Seahorse metabolic flux analysis for cellular energetics research, providing detailed application notes and protocols for the scientific community.
Technological Innovations and Multi-Modal Integration
Combining Seahorse XF with High-Content Fluorescence Imaging
Recent methodological advances have successfully integrated Seahorse metabolic flux assays with high-content fluorescence imaging, creating a powerful platform for multidimensional analysis. This approach simultaneously provides data on bioenergetics and multiple mitochondrial properties within a single assay [16].
Key Measurable Parameters:
- Cell Number Normalization: Using nuclear stains (e.g., Hoechst) for accurate normalization of OCR and ECAR data.
- Cell Cycle Distribution: Analysis of cell cycle phases and their correlation with bioenergetic status.
- Mitochondrial Content and Morphology: Quantification via MitoTracker Red, including mitochondrial network fragmentation analysis.
- Mitochondrial Membrane Potential (Δψm): Measurement using TMRE (tetramethylrhodamine ethyl ester) sequestration.
- Mitochondrial Reactive Oxygen Species (mtROS): Detection via MitoSOX Red fluorescence [16].
This integrated strategy revealed novel insights into how Rho-GTPases regulate mitochondrial dynamics in breast cancer and characterized mitochondrial function following PGC1α and PRC1 inhibition in pancreatic cancer models [16].
Coupling with Mass Spectrometry-Based Metabolomics
The combination of Seahorse XF analysis with liquid chromatography-mass spectrometry (LC-MS) provides a multi-scale investigative approach, marrying cellular-resolution metabolic flux with molecular-resolution metabolite identification [86]. This powerful combination offers researchers:
- Comprehensive Metabolic Profiling: XF data on pathway fluxes complemented by LC-MS identification of specific metabolite changes.
- Enhanced Mechanistic Insights: Correlation of functional bioenergetic measurements with biochemical pathway alterations.
- Applications in Diverse Research Areas: This combined approach has provided comprehensive views of adipocyte metabolism during cool-temperature adaptation, metabolic alterations during infectious disease, mutation-specific metabolic flux in cancer cells, and metabolic responses to oxidative phosphorylation modulators [86].
The Agilent Seahorse XF Pro analyzer, with enhanced experimental design and analysis tools, further optimizes these workflows for pharmaceutical applications [84].
Advanced Computational Integration
Novel computational frameworks are expanding the analytical power of metabolic flux data:
- COMPASS: Integrates single-cell RNA sequencing (scRNA-seq) with flux balance analysis to predict cell-type-specific metabolic fluxes, having uncovered a metabolic switch between glycolysis and fatty acid oxidation governing T helper 17 (Th17) cell pathogenicity [85].
- iMetAct: Infers enzyme activity from gene expression data, integrating metabolic-transcriptional networks to identify metabolically distinct subtypes in hepatocellular carcinoma through an accessible online platform [85].
- IntOmics: This service offered by core facilities combines RNAseq enzyme transcripts with metabolomic data on an optimized metabolic network, providing systems-level integration [87].
Emerging Applications in Disease Research and Drug Development
Cancer Metabolism and Therapeutic Discovery
Metabolic flux analysis has become indispensable in cancer research, particularly for investigating the Warburg effect and metabolic heterogeneity within tumors [20] [38]. Emerging applications include:
Metabolic Phenotyping of Cancer Cells:
- Identification of metabolic switches conferring malignant characteristics like metastasis [20].
- Investigation of metabolic heterogeneity, including cancer stem cell subpopulations with distinct metabolic profiles [20].
- Profiling of suspension versus adherent cancer cells, revealing differential metabolic dependencies with therapeutic implications [20].
Drug Discovery Applications:
- Assessment of drug effects on mitochondrial function and cellular energy production.
- Identification of metabolic liabilities and targets for therapeutic intervention.
- Validation of potential metabolic modulators in early drug discovery research [84].
Table 1: Emerging Cancer Research Applications of Metabolic Flux Analysis
| Application Area | Specific Use Case | Relevant Assays | Research Insights |
|---|---|---|---|
| Metabolic Heterogeneity | Identification of cancer stem cell subpopulations | XF Real-Time ATP Rate Assay | Reveals distinct bioenergetic profiles of therapeutic resistant cells |
| Metabolic Dependencies | Comparison of suspension vs. adherent cancer cells | XF Cell Mito Stress Test, Glycolytic Rate Assay | Suspension cells show higher mitochondrial activity; adherent cells more glycolytic [20] |
| Drug Mechanism | Evaluating PCK2 as therapeutic target in triple-negative breast cancer | XF Pro Analyzer with integrated imaging | Confirmed target engagement and metabolic effects [87] |
| Tumor Microenvironment | Metabolic adaptation to hypoxia | XF Glycolytic Rate Assay | Hypoxia-driven shift from mitochondrial respiration to glycolysis [85] |
Immunometabolism and Cell Therapy
The critical role of cellular metabolism in regulating immune cell function has established metabolic flux analysis as essential in immunology research [85]. Key developments include:
T Cell Metabolic Profiling:
- Assessment of metabolic fitness critical for antitumor potency.
- Evaluation of persistence capacity for long-term immune responses.
- Determination of metabolic preparedness for survival in the tumor microenvironment [84].
Dendritic Cell Metabolism:
- Analysis of metabolic requirements for maturation and antigen presentation.
- Identification of mitochondrial dependence as a critical parameter for DC maturation and predictive biomarker of clinical response in melanoma [85].
Advanced Single-Cell Technologies:
- SCENITH: Measures cellular protein synthesis as a proxy for metabolic activity at single-cell resolution.
- scMEP: Enables single-cell metabolic profiling of heterogeneous samples.
- BONCAT: Employs noncanonical amino acids for non-toxic measurement of protein synthesis [85].
Mitochondrial Toxicity Assessment in Pharmaceutical Development
With mitochondrial dysfunction representing a leading cellular mechanism for drug safety failures, metabolic flux analysis has become critical in preclinical safety assessment [88] [84].
Key Applications:
- Early identification of drug-induced mitochondrial toxicity during drug discovery.
- Functional measurements of mitochondrial oxygen consumption rates to assess compound liability.
- High-throughput screening using acute exposure paradigms to model human response [88].
The acute XF assay has been validated using marketed drugs known to modulate mitochondrial function, establishing it as a robust, sensitive screening platform for evaluating drug-induced effects on mitochondrial activity in whole cells [88].
Advanced Experimental Protocols
Integrated Metabolic Flux with High-Content Imaging Protocol
This detailed protocol enables simultaneous assessment of mitochondrial bioenergetics and functional properties in adherent cancer cells.
Materials Required:
- Agilent Seahorse XF Pro Analyzer
- Seahorse XF96-well cell culture microplate
- BioTek Cytation5 Imager or equivalent
- Seahorse XF Mito Stress Test Kit (#103015-100)
- Fluorescent dyes: Hoechst 33342, MitoTracker Red CMXRos, TMRE, MitoSOX Red
- Appropriate cell culture media and reagents
Procedure:
- Cell Seeding and Preparation:
- Seed cells in XF96-well microplate at optimized density (3,000-50,000 cells/well based on cell type).
- Incubate for 24 hours at 37°C, 5% CO₂.
- Confirm monolayer confluence between 70-90% at time of assay.
Sensor Cartridge Hydration:
- Hydrate Seahorse XF sensor cartridge with XF Calibrant solution.
- Incubate overnight at 37°C in non-CO₂ incubator.
Metabolic Flux Assay Execution:
- Replace growth media with Seahorse XF Base Medium supplemented with 10mM glucose, 1mM pyruvate, and 2mM glutamine.
- Incubate cells for 45-60 minutes at 37°C in non-CO₂ incubator.
- Load Mito Stress Test compounds into injection ports: Port A - Oligomycin (1.5µM), Port B - FCCP (1.0µM), Port C - Rotenone/Antimycin A (0.5µM each).
- Run Mito Stress Test program on Seahorse XF Pro Analyzer.
Fluorescent Staining and Imaging:
- Via Port D, inject Hoechst 33342 (5µg/mL) combined with MitoTracker Red (100nM), TMRE (100nM), or MitoSOX Red (2.5µM).
- Incubate for 15-20 minutes at 37°C.
- Wash plates gently with warm PBS.
- Image using Cytation5 imager with appropriate filter sets:
- Hoechst: Ex 350/Em 461 (nuclear counterstain)
- MitoTracker Red: Ex 579/Em 599 (mitochondrial content)
- TMRE: Ex 549/Em 575 (membrane potential)
- MitoSOX Red: Ex 510/Em 580 (mitochondrial ROS)
Image Analysis and Data Normalization:
- Perform automated nuclei counting for cell number normalization.
- Analyze mitochondrial morphology using granularity algorithms.
- Quantify fluorescence intensity for TMRE and MitoSOX.
- Normalize OCR and ECAR values to cell number.
- Correlate bioenergetic parameters with mitochondrial functional metrics [16].
Suspension Cell Metabolic Profiling Protocol
Optimized workflow for profiling metabolic fluxes in suspension cells (e.g., lymphocytes, hematopoietic cells) using Seahorse technology.
Materials Required:
- Agilent Seahorse XF Pro Analyzer
- Seahorse XF96 PDL-coated microplates (#103798-100)
- Seahorse XF RPMI Medium, pH 7.4 (#103576-100)
- Seahorse XF Real-Time ATP Rate Assay Kit (#103592-100)
- Centrifuge with microplate rotor
- 37°C non-CO₂ incubator
Procedure:
- Sensor Cartridge Preparation:
- Hydrate sensor cartridge with XF Calibrant solution.
- Incubate overnight at 37°C in non-CO₂ incubator.
Cell Preparation and Seeding:
- Harvest suspension cells and centrifuge at 300 × g for 5 minutes.
- Resuspend in XF RPMI Medium supplemented with 10mM glucose, 1mM pyruvate, and 2mM glutamine.
- Count cells and adjust concentration to 2-5 × 10⁵ cells/mL based on cell size and metabolic activity.
- Seed 100-200μL cell suspension per well in PDL-coated XF96 microplate.
- Centrifuge microplate at 200 × g for 1 minute with slow acceleration and deceleration to promote cell attachment.
- Add additional 100-200μL assay medium to each well.
- Incubate for 15-30 minutes at 37°C in non-CO₂ incubator.
ATP Rate Assay Execution:
- Load XF Real-Time ATP Rate Assay compounds: Port A - Oligomycin (1.5μM), Port B - Rotenone/Antimycin A (0.5μM).
- Run ATP Rate Assay program on Seahorse XF Pro Analyzer.
- Measure basal OCR and ECAR, followed by sequential inhibitor injections.
Data Analysis and Normalization:
- Normalize data to cell number determined by parallel cell counting or protein content.
- Calculate metabolic parameters:
- Glycolytic ATP Production Rate = glycoPER
- Mitochondrial ATP Production Rate = OCRATP × 2 × P/O ratio
- Total ATP Production Rate = Glycolytic ATP Rate + Mitochondrial ATP Rate [20]
T Cell Metabolic Profiling Protocol
Specialized protocol for assessing metabolic fitness of primary T cells for immunotherapy applications.
Materials Required:
- Agilent Seahorse XF T Cell Metabolic Profiling Kit (#103721-100)
- Seahorse XF96 PDL-coated microplates
- Resting and activated primary human T cells
- XF RPMI Medium, pH 7.4
Procedure:
- T Cell Preparation:
- Isolate primary T cells from human peripheral blood.
- Split into resting and activated populations.
- Activate T cells using CD3/CD28 stimulation for 24-48 hours.
Cell Seeding:
- Seed 1.5-2 × 10⁵ cells/well in PDL-coated XF96 microplate.
- Centrifuge at 200 × g for 1 minute to promote attachment.
- Incubate for 15-30 minutes at 37°C in non-CO₂ incubator.
Metabolic Profiling Assay:
- Utilize T Cell Metabolic Profiling Kit with sequential injections of modulators.
- Assess basal respiration, glycolytic capacity, and metabolic potential.
- Determine metabolic phenotypes associated with persistence and effector function.
Data Interpretation:
- Identify metabolically fit T cells capable of sustained antitumor responses.
- Assess metabolic poise for survival in tumor microenvironment [84].
Research Reagent Solutions and Essential Materials
Table 2: Key Research Reagent Solutions for Advanced Metabolic Flux Studies
| Reagent/Kit | Manufacturer | Primary Function | Application Context |
|---|---|---|---|
| Seahorse XF Real-Time ATP Rate Assay Kit | Agilent Technologies | Simultaneously measures glycolytic and mitochondrial ATP production rates | Initial metabolic phenotyping; ideal entry point for cell metabolism analysis [84] |
| Seahorse XF Cell Mito Stress Test Kit | Agilent Technologies | Evaluates key parameters of mitochondrial function through ETC inhibition | Comprehensive assessment of mitochondrial respiration; pharmacodynamic studies [1] [84] |
| Seahorse XF Glycolytic Rate Assay Kit | Agilent Technologies | Quantifies proton efflux rate (PER) specific to glycolysis | Detailed glycolytic function analysis; transient metabolic switch detection [84] |
| Seahorse XF T Cell Metabolic Profiling Kit | Agilent Technologies | Generates bioenergetic parameters linked to T cell persistence and fitness | Cell therapy development; immunotherapy optimization [84] |
| Seahorse XF Mito Tox Assay Kit | Agilent Technologies | Identifies drug-induced mitochondrial toxicity through functional OCR measurements | Preclinical safety assessment; early drug discovery [84] |
| Seahorse XF Plasma Membrane Permeabilizer | Agilent Technologies | Permeabilizes plasma membrane while leaving mitochondrial membrane intact | Substrate oxidation studies; mitochondrial complex-specific assessment [84] |
| MitoTracker Red CMXRos | Thermo Fisher Scientific | Fluorescent staining of mitochondrial content and network morphology | Integrated imaging-bioenergetics platforms; mitochondrial dynamics [16] |
| TMRE (Tetramethylrhodamine ethyl ester) | Abcam | Fluorescent detection of mitochondrial membrane potential (Δψm) | Mitochondrial functional status assessment; polarized vs. depolarized mitochondria [16] |
Visualization of Experimental Workflows and Signaling Pathways
Integrated Metabolic Flux with Imaging Workflow
Mitochondrial Electron Transport Chain and Measurement Principle
Multi-Technology Integration for Comprehensive Metabolic Analysis
Conclusion
Seahorse Metabolic Flux Analysis has revolutionized the study of cellular bioenergetics by providing real-time, simultaneous measurement of key metabolic pathways in diverse biological systems. This technology enables researchers to capture dynamic metabolic phenotypes from basic cancer cell studies to complex 3D models and whole organisms, offering unprecedented insights into mitochondrial function and glycolytic activity. The integration with fluorescence imaging and development of robust normalization strategies further enhances its utility, while its non-invasive nature and compatibility with subsequent analyses make it invaluable for comprehensive metabolic profiling. As research continues to uncover the fundamental role of metabolism in health and disease, Seahorse technology stands poised to drive discoveries in drug development, personalized medicine, and our fundamental understanding of cellular energetics, particularly through expanded applications in physiological models and integration with multi-omics approaches.
References
- 1. Extracellular flux assay (Seahorse assay): Diverse ... [https://pmc.ncbi.nlm.nih.gov/articles/PMC11374971/]
- 2. High-content fluorescence imaging with the metabolic assay... flux [https://www.nature.com/articles/s42003-020-0988-z?error=cookies_not_supported&code=8cc63fa5-f498-4ff6-9e06-5db4fefa187d]
- 3. Measurement of Oxygen Consumption Rate (OCR) and ... [https://pmc.ncbi.nlm.nih.gov/articles/PMC8275291/]
- 4. Extracellular flux assay ( Seahorse assay): Diverse applications in... [https://pubmed.ncbi.nlm.nih.gov/39032561/]
- 5. The role of glycolysis and mitochondrial respiration in ... [https://www.nature.com/articles/s41598-019-48676-2]
- 6. An Optimized Protocol to Analyze Glycolysis and ... [https://pmc.ncbi.nlm.nih.gov/articles/PMC5226256/]
- 7. Study of AMPK-Regulated Metabolic in Neurons... | SpringerLink Fluxes [https://link.springer.com/protocol/10.1007/978-1-4939-7598-3_19]
- 8. An Optimized Workflow for the Analysis of Metabolic in... Fluxes [https://www.sigmaaldrich.com/CH/en/tech-docs/paper/1567345]
- 9. Seahorse Real-Time Cell Metabolic Analysis - XF Analyzers [https://www.agilent.com/en/product/cell-analysis/real-time-cell-metabolic-analysis/xf-analyzers?srsltid=AfmBOoq3FhFd8pXCoR_qBBmmQ5JzJgWtcxFKVzGcgUUevIzo0ZAwsCQI]
- 10. Seahorse XF Flex Analyzer [https://www.agilent.com/en/product/cell-analysis/real-time-cell-metabolic-analysis/xf-analyzers/seahorse-xf-flex-analyzer-9318021?srsltid=AfmBOopsguv8HgbykAqOdP1E0Q4FVbR28B4btbxZZYWoPUnKk9cyQgjr]
- 11. Cell Metabolism - In Vitro Technologies [https://lifescience.invitro.co.nz/cell-biology/cell-analysis/cell-metabolism/]
- 12. Optimised Workflows for Profiling the Metabolic Fluxes in ... [https://pmc.ncbi.nlm.nih.gov/articles/PMC11720317/]
- 13. Metabolic Screening of T Lymphocytes During Activation ... [https://pubmed.ncbi.nlm.nih.gov/40220238/]
- 14. Seahorse XFe96 Flux Analyzer - Research, Innovation & Impact [https://research.missouri.edu/cell-immunobiology/seahorse-xfe96-flux-analyzer]
- 15. Mitochondrial Respiration XF Cell Mito Stress Test [https://www.agilent.com/en/support/cell-analysis/mitochondrial-respiration-xf-cell-mito-stress-test?srsltid=AfmBOoqFBo-FzXiWb9tAc2M2jOco4Sb-HnB1cp5tjtRMHM99yu3yxqkO]
- 16. High-content fluorescence imaging with the metabolic flux ... [https://www.nature.com/articles/s42003-020-0988-z]
- 17. Seahorse XF Assay Journey [https://www.agilent.com/en/product/cell-analysis/real-time-cell-metabolic-analysis/seahorse-xf-assay-journey?srsltid=AfmBOoot_VJueVkQe8THKxqgOSAGcUKWubVfcLKoKr038-azRN2GKseh]
- 18. Seahorse Xfe24 Extracellular Flux Analyzer-based ... [https://pmc.ncbi.nlm.nih.gov/articles/PMC4632645/]
- 19. Seahorse XFe 96 Flux Analyzer [https://resuscitationscience.com/seahorse-xfe-96-flux-analyzer/]
- 20. Optimised Workflows for Profiling the Metabolic Fluxes in ... [https://www.mdpi.com/1422-0067/26/1/154]
- 21. Seahorse Real-Time Cell Metabolic Analysis - XF Analyzers [https://www.agilent.com/en/product/cell-analysis/real-time-cell-metabolic-analysis/xf-analyzers?srsltid=AfmBOorNY2GOi8Cm97sXMVrCZnDHp3Uk2MaO_KupdWaAp8Ro-h8IhUs4]
- 22. The role of mitochondrial function and cellular bioenergetics in ... [https://pmc.ncbi.nlm.nih.gov/articles/PMC4321783/]
- 23. Targeting mitochondrial bioenergetics as a promising ... [https://www.sciencedirect.com/science/article/pii/S2319417022000749]
- 24. Selected Metabolic Poisons [https://www.ruf.rice.edu/~bioslabs/studies/mitochondria/mitopoisons.html]
- 25. Mitochondrial electron-transport-chain inhibitors of ... [https://pubmed.ncbi.nlm.nih.gov/18032788/]
- 26. Extracellular flux assay (Seahorse assay): Diverse ... [https://www.sciencedirect.com/science/article/pii/S1016847824001201]
- 27. Real-Time SPR Biosensing to Detect and Characterize ... [https://www.mdpi.com/2218-273X/15/6/882]
- 28. Comprehensive real-time metabolic profiling of peripheral ... [https://www.frontiersin.org/journals/immunology/articles/10.3389/fimmu.2025.1676550/full]
- 29. Mapping real-time metabolic kinetics of expanded CAR T ... [https://www.nature.com/articles/s41598-025-24712-2]
- 30. Proof of concept: real-time viability and metabolic profiling ... [https://pmc.ncbi.nlm.nih.gov/articles/PMC11220157/]
- 31. Kinetic flux profiling for quantitation of cellular metabolic fluxes [https://pmc.ncbi.nlm.nih.gov/articles/PMC2710581/]
- 32. Evaluation of Glycolysis and Mitochondrial Function in ... [https://pmc.ncbi.nlm.nih.gov/articles/PMC11368073/]
- 33. Mito Stress Assay of PBMCs With Seahorse XFe96 Flux ... [https://pmc.ncbi.nlm.nih.gov/articles/PMC12152111/]
- 34. Seahorse XF Cell Mito Stress Test assay [https://bio-protocol.org/exchange/minidetail?id=18723603&type=30]
- 35. Seahorse XF Mito Stress Test Kits [https://www.agilent.com/en/product/cell-analysis/real-time-cell-metabolic-analysis/xf-assay-kits-reagents-cell-assay-media/seahorse-xf-cell-mito-stress-test-kit-740885?srsltid=AfmBOoqSHoYrQn-hsJMtcDqYQKS7gCXZpRurYbp26SQyCUs697pZumDX]
- 36. Mitochondrial and glycolytic extracellular flux analysis ... [https://www.nature.com/articles/s41598-021-99460-0]
- 37. Protocol for real-time assessment of energy metabolism in ... [https://pmc.ncbi.nlm.nih.gov/articles/PMC11795547/]
- 38. Methods and Guidelines for Metabolism Studies [https://www.mdpi.com/1422-0067/26/17/8466]
- 39. Synergistic targeting of cancer cells through simultaneous ... [https://www.nature.com/articles/s41418-025-01532-5]
- 40. How to run an assay [https://www.agilent.com/en/product/cell-analysis/how-to-run-an-assay?srsltid=AfmBOoqIU8OoCQIhpp1EIpVkSdCibaR2RklTabCe8EjHOgAwSnmvEYjH]
- 41. Metabolic Profiling of Tumor and Immune Cells Integrating ... [https://pubmed.ncbi.nlm.nih.gov/40402451/]
- 42. Organoids, Spheroids, & 3D Cell Culture [https://www.thermofisher.com/us/en/home/life-science/cell-culture/organoids-spheroids-3d-cell-culture.html]
- 43. An Optimized Workflow for the Analysis of Metabolic Fluxes in ... [https://pmc.ncbi.nlm.nih.gov/articles/PMC8909358/]
- 44. Three-Dimensional (3D) in vitro cell culture protocols to ... [https://pmc.ncbi.nlm.nih.gov/articles/PMC9907841/]
- 45. Tissue-engineered neuromuscular organoids [https://www.nature.com/articles/s42003-025-08484-z]
- 46. From spheroids to organoids: next-generation models for ... [https://www.frontiersin.org/journals/immunology/articles/10.3389/fimmu.2025.1626369/full]
- 47. Approaches to investigating metabolism in human ... [https://pmc.ncbi.nlm.nih.gov/articles/PMC9720749/]
- 48. Application Note for 3D Cell Culture [https://www.corning.com/emea/en/products/life-sciences/resources/webforms/application-note-for-3D-cell-culture.html]
- 49. Seahorse Real-Time Cell Metabolic Analysis - XF Analyzers [https://www.agilent.com/en/product/cell-analysis/real-time-cell-metabolic-analysis/xf-analyzers?srsltid=AfmBOooz4Hr21KAXMMEwmguC66AbuSHl6O9cQNVam6FBh1o45D6iaK42]
- 50. Persistent Metabolic Changes Are Induced by 24 h Low- ... [https://www.mdpi.com/1422-0067/26/3/1050]
- 51. Phenotypic and metabonomics studies of FMOs in C. ... [https://pmc.ncbi.nlm.nih.gov/articles/PMC12619732/]
- 52. Phenotypic and metabonomics studies of FMOs in C. ... [https://pubmed.ncbi.nlm.nih.gov/41241700/?utm_source=FeedFetcher&utm_medium=rss&utm_campaign=None&utm_content=0GaYCevddEDAfC5HA0wlElkFqaKqOUgRmbLrsDcYiaD&fc=None&ff=20251116065324&v=2.18.0.post22+67771e2]
- 53. Seahorse metabolic analysis [https://bio-protocol.org/exchange/minidetail?id=9996043&type=30]
- 54. A new alternative method using cyp3a65 expression in ... [https://www.sciencedirect.com/science/article/pii/S0160412025006233?dgcid=rss_sd_all]
- 55. Cellular and mitochondrial respiration and bioenergetics [https://research.yale.edu/cores/bioenergetics]
- 56. Adherent and suspension cell culture [https://greenelephantbiotech.com/blog/adherent-and-suspension-cell-culture/]
- 57. Adherent Cell Culture Protocol [https://www.thermofisher.com/us/en/home/references/gibco-cell-culture-basics/cell-culture-protocols/subculturing-adherent-cells.html]
- 58. Cell Biology Cell Count & Viability [https://chemometec.com/industry/cell-biology/]
- 59. Countess 3 FL Automated Cell Counter [https://www.thermofisher.com/us/en/home/life-science/cell-analysis/cell-analysis-instruments/automated-cell-counters/models/countess-3-fl.html]
- 60. Real-Time Cell Metabolic Analysis, Seahorse XF [https://www.agilent.com/en/product/cell-analysis/real-time-cell-metabolic-analysis?srsltid=AfmBOooyjL-v9iOPEMrK2zfQZVdKA0uj12gze2SqJ8Dxs2uaBXap_CGk]
- 61. In Vitro Methods for Measuring the Permeability of Cell ... [https://pmc.ncbi.nlm.nih.gov/articles/PMC8874757/]
- 62. Advancements in techniques for analyzing cell permeability [https://www.sciencedirect.com/science/article/pii/S2405844025022236]
- 63. Method for Extracellular Electrochemical Impedance ... [https://en.bio-protocol.org/en/bpdetail?id=5341&type=0]
- 64. Seahorse Real-Time Cell Metabolic Analysis - XF Analyzers [https://www.agilent.com/en/product/cell-analysis/real-time-cell-metabolic-analysis/xf-analyzers?srsltid=AfmBOopJJik14JmEwFASA35sQ5Ff3dXXxfv0jY8dJBHPFeCKcJM-1rJN]
- 65. Identifiability of phenotypic adaptation from low-cell-count ... [https://journals.plos.org/ploscompbiol/article?id=10.1371/journal.pcbi.1013202]
- 66. Data quality assessment pitfalls [https://www.gov.uk/government/news/data-quality-assessment-pitfalls]
- 67. 5 Data Quality Issues and How You Can Avoid Them [https://www.acceldata.io/blog/5-data-quality-issues-and-how-you-can-avoid-them]
- 68. 14 Most Common Data Quality Issues and How to Fix Them [https://lakefs.io/data-quality/data-quality-issues/]
- 69. Optimization and Application of Seahorse Glycolytic Stress Test in... [https://pubmed.ncbi.nlm.nih.gov/41247126/]
- 70. Protocol for Seahorse analysis of ex vivo mouse brown and ... [https://www.sciencedirect.com/science/article/pii/S2666166724002077]
- 71. Metabolomics and isotope tracing - PMC - PubMed Central [https://pmc.ncbi.nlm.nih.gov/articles/PMC6034115/]
- 72. Metabolic flux analysis: a comprehensive review on sample ... [https://pmc.ncbi.nlm.nih.gov/articles/PMC9449821/]
- 73. Validation of a method evaluating T cell metabolic potential ... [https://pmc.ncbi.nlm.nih.gov/articles/PMC7789274/]
- 74. Spatial single-cell isotope tracing reveals heterogeneity of ... [https://www.nature.com/articles/s42255-024-01118-4]
- 75. Gene and protein expression and metabolic flux analysis ... [https://elifesciences.org/articles/78335]
- 76. Critical comparison of radiometric and mass spectrometric ... [https://www.sciencedirect.com/science/article/abs/pii/S0003267007019964]
- 77. Beyond the Paradigm: Combining Mass Spectrometry and ... [https://pmc.ncbi.nlm.nih.gov/articles/PMC5448308/]
- 78. Comparison of NMR and MS | Metabolomics [https://www.ebi.ac.uk/training/online/courses/metabolomics-introduction/designing-a-metabolomics-study/comparison-of-nmr-and-ms/]
- 79. Advantages and Pitfalls of Mass Spectrometry Based ... [https://pmc.ncbi.nlm.nih.gov/articles/PMC4881458/]
- 80. Seahorse Real-Time Cell Metabolic Analysis - XF Analyzers [https://www.agilent.com/en/product/cell-analysis/real-time-cell-metabolic-analysis/xf-analyzers?srsltid=AfmBOoqQcnOcmO9KlD_6QliTp_sLNzfc-2rRsEHMriD3anMsAGg1c7oN]
- 81. Calculation of ATP production rates using the Seahorse XF ... [https://pmc.ncbi.nlm.nih.gov/articles/PMC10561364/]
- 82. Protocol for real-time assessment of energy metabolism in ... [https://www.sciencedirect.com/science/article/pii/S2666166725000012]
- 83. 2.11. Seahorse XF24 Metabolic Flux Analysis [https://bio-protocol.org/exchange/minidetail?id=6526235&type=30]
- 84. Seahorse XF Assay Journey [https://www.agilent.com/en/product/cell-analysis/real-time-cell-metabolic-analysis/seahorse-xf-assay-journey?srsltid=AfmBOor1zxFnFlDlnxnPz7X6FLSqgRsKPtBeZKsnfleseqxb3U_jAPAO]
- 85. Decoding immunometabolism with next-generation tools [https://pmc.ncbi.nlm.nih.gov/articles/PMC12583481/]
- 86. Combining Seahorse XF and LC/MS technologies [https://mitnano.mit.edu/events/mitnano-january-seminar-agilent-technologies]
- 87. Chemical Metabolism Core - Research at Yale [https://research.yale.edu/cores/cmc]
- 88. The Acute Extracellular Flux (XF) Assay to Assess ... [https://www.sciencedirect.com/science/article/pii/S2472555222072033]